1. Introduction
The functionality of proteins has been shown to play important role in food processing, since they are key components implicated in gelling, foaming, emulsifying and water/oil binding capacities. The gel formation is a property under which, a protein solution is turned up into a soft solid, space filling network structure, by a mean of heating, decreasing pH, cooling, etc. [1] -[4] , providing to food new rheological and textural properties. Recent studies have shown that high pressure treatments also have impact on inducing gelation in some globular proteins [5] .
Heat induced gel network, built up from globular proteins follows, primarily, the changes into the protein structure, by unfolding the native state, which exposes to the solution, the hydrophobic patches, normally hidden inside the protein matrix, which in turn prompts to new protein-protein interactions and therefore, the aggregation [4] -[7] . The gel formation can sometimes be useful in the food processing, for example, in processing yogurt, while completely to prevent, for example, in milk pasteurization and therefore, for better control and optimization; a clear understanding must be provided. In addition food is generally a complex system of many different ingredients, some even counter-acting against the desired functional properties.
Another dimension in the protein gelation that has recently received considerable attention is regarding phase separation [3] [6] [8] . For example, β-lactoglobulin, the whey protein largely studied, displays gels with network structures falling into one of the well-defined phase regions: the homogenous gel, the micro-phase separated gel and the precipitate, depending upon on the Salt/Protein concentration ratio, as established in the phase-equilibrium diagram and as provided that the pH values are far from the isoelectric points, as well [3] .
Regarding the coconut proteins, very little is known about their gelling properties and the literature in the topic is scarce. So, this work is an attempt to evaluate the gel forming abilities of the coconut press cake proteins, aiming to help in predicting the properties of the final related products. So, low strain oscillatory method with a ramp of temperatures in heating and cooling was used to determine the gel strength and elasticity, among other rheological measurements. Texture analysis on gel deformation to fracture, as well as the protein profile in the SDS-PAGE electrophoresis were also performed. Effects of protein concentration, pH, heating temperatures and rate, as well as the cooling, were also evaluated.
Coconut proteins are basically the 11S globulin or Cocosin, and 7S globulin, accounting for 90% of the total [9] .
2. Materials and Methods
2.1. Materials
The coconuts used to prepare the protein powder (CPP) were grown in Ivory Coast, but purchased from a local retailer in Lund, Sweden and stored at 10˚C, for a period no longer than a week before use. The protein was extracted from the coconut press cake, according to the method already described in our previous work [10] , concentrated 5 times by ultra-filtration (Membrane type 37/3.8, 10 kDa MWCO, Atech Innovations gmgh, Gladbeck, Germany) and freeze dried to a final powder, 43% protein, dry basis. However, this time, for pH adjustment in the alkaline extraction, 6 M NaOH was used instead of Na3PO4 buffer, which resulted in 20 mM of ionic strength in the final liquid extract, before concentration.
The water used in all preparations, including the extraction of the coconut protein was de-ionized and Millipore filtered. The SDS-PAGE gels, buffer strips, combs and MW standards for PhastGel™ system (Pharmacia, Uppsala, Sweden) were purchased from GE Healthcare (Uppsala, Sweden). Also, the chemicals evolved in the preparation of the sample buffer (0.0625 M Tris-HCl, 2% Sodium dodecyl sulphate, 10% Glycerol, 0.1 DTT and 0.01% Bromophenol blue, pH 6.8) were of pro-analysis grade, as well.
2.2. Sample Preparation
Suspensions of 15% w/w coconut protein powder (CPP), in the range the pH values 4 - 9, were prepared by adding the necessary amount to the water, with stirring, for at least 20 minutes and then adjusted to the necessary pH value by dropping HCl 2 M, since the initial pH after CPP dispersion was around 10. The samples were split in 2 parts: the first one, unheated, used for rheology, SDS-PAGE electrophoresis and preliminary assays and the second, heated, used for texture, electrophoresis and micro-structure observation.
2.3. Rheology Determination—The Gel Strength
The unheated samples were loaded directly into the plate geometries (PU40 serrated SC0015SS: PL65 inserted serrated; gap: 1 mm) and run in a rheometer (Kinexus, rspace version 1.50, Malvern Instruments, UK), under low strain oscillatory method (shear strain = 0.001 strain; frequency = 1 Hz), with a table of temperatures from 30˚C to 75˚C, in heating. The gel strength was monitored by following the elastic modulus G’, and phase angle δ, on the table of temperatures: 30, 40, 50 and from now on, increased by 2.5˚C up to 75˚C, holding in each plateau for 2.30 minutes for data acquisition. After reaching 75˚C, the cooling stage to the initial temperature, 30˚C, took place. However, at each temperature, aside from the holding time for data acquisition, there was also the necessary time for rising the temperature to the next table and for stabilization, which elapsed for approximately 6.2 minutes. Triplicates were used in the measurements at each pH value.
2.4. Texture Analysis
The gel strength and fracture was determined by back extrusion method, using a texture analyzer TA-XT2i (2010 model, Godalming, UK), with a cylindrical probe (11 mm diameter) in a 25 mm diameter container and the Exponent software as an interface. 3 g of unheated samples were first placed each in the vials (6 mm total depth), heated at 75˚C in a water bath, for 1 h, to induce gel formation and then stored in the fridge for 1day, before the determinations. The instrument was operated at test speed of 0.2 mm/s.
To reduce the noise, the raw data (Force versus Distance) were reprocessed, by averaging the force in each interval of 12 μm distance and re-plotted again. The new plot, “Average Force versus average Distance” permitted to easily detect, with no significant disturbance, the inflection points, which correspond to incipient fracture.
The work was calculated by the areas under the curves, between two anchors: the first one referring to the initial stages, when the loads were recording the lowest clearly discernible force, 0.006 N, and the last, at the corresponding inflexion point.
2.5. Gel Micro-Structure Observation
The gel micro-structure images were taken from the optical transmission microscope (Olympus BX50, LRI instrument, Lund, Sweden) under a magnification of ×50, so that 1 pixel corresponded to 0.19 micrometer. The images were processed by 2D Fourier transform and the radial profile of the transforms evaluated to determine the gel characteristical length scales, using Image J.
2.6. SDS-PAGE
Sodium dodecyl sulphate polyacrylamide gel electrophoresis (SDS-PAGE) was conducted on the initial samples before gelation, on gels and the remaining liquid phase entrapped in the gels, using the PhastGel™ system (Pharmacia LKB Biotechnology, Uppsala, Sweden), covering the whole range of the pH values, 4 to 9, accordingly to the user’s manual (PhastSystem™ Guide).
The unheated samples for electrophoresis were first diluted into the sample buffer to optimize the protein concentration to those recommended, 2 - 4 mg/ml, for the PhastGel™ SDS-PAGE mini-gel system, before heating at 95˚C, 10 minutes, as prescribed in the user’s manual. Therefore, there was no care in separating the insoluble part of the CPP, since the gelling process was also carried out from the whole suspension.
The remaining entrapped liquids were extracted from the gels by a mean of centrifugation at 5000 rpm (Eppendorf mini-span centrifuge), 5 minutes. These liquids were in turn centrifuged again at 10,000 rpm, 10 minutes, to get rid of any remaining insoluble particles and then treated with the sample buffer, as described previously.
The gels were washed out 5 times with sufficient water to remove any residual entrapped liquid phase, before loading adequate amount into the sample buffer for dissolution. So, from now on 3 µl of each sample were first gently filled in the wells and then loaded in the 8% - 25% Tris-HCl gradient mini-gel by a mean of 8/1 sample applicator. The system run for approximately 45 minutes, after which the gels were stained with Coomassie (0.025% Coomassie Brilliant Blue R-250, 40% Methanol, 7% Acetic Acid) overnight and distained successively in distaining solution I (40% Methanol, 7% Acetic Acid) and solution II (7% Acetic acid, 5% Methanol), as described in the manual.
3. Results and Discussion
3.1. Rheology—Gel Strength
The coconut press cake proteins (CPP) showed some abilities to form gels induced by heat, although this capacity was greatly affected by environmental factors, among which the most important were: the concentration, heating temperature and pH values. Preliminary essays conducted with 13% w/w CPP showed that the gelation occurred at 70˚C, in a limited range of pH 8 to 9, while with 20% CPP the onset temperatures dropped down to 60˚C, in a wider pH range of 7 to 9. This allowed setting up the conditions for the experiments to 15% CPP (approx. 6.5% protein) in the whole range of the pH 4 - 9 and temperatures, to 30˚C - 75˚C. Figure 1 illustrates the gel strengths, based on the elastic modulus (G’), phase angle (δ) over the temperature and pHs.
Generally, the onset temperatures for the main gels fell into the range of 65˚C - 80˚C, as predicted in the literature [4] [11] , but the gel strength was found to be affected by the pH, reaching the highest values at pH 9, followed by 8 and in minor extent at 7, as shown in Figure 1. Below the pH 7 no consistent gel was formed as it was even possible to see the gel floating over the container when gently shaken, which did not happen at higher pHs. On the other hand, one common feature on G’ profile at pH 9 and 8 is that it seems like as they followed two onset temperatures for gelation. One onset temperature would be at 53˚C, where the G’ increased 10 times and the other at 63˚C, where the G’ increased by 1000 times, suggesting that the previous was duo to proteins less active in gelation while the second was for those most prominent ones.
In addition the gels displayed visco-elastic properties, since the phase angle, δ < 45˚ over all experiments, which means that G’ (elastic modulus) > G’’ (loss modulus), over the whole range of the experiments.
The environmental conditions such as, the heating rate and temperature, suspension concentration, pH and ionic strength play important role in the gel formation and their related structures. However, in our particular case,

Figure 1. Gel development during heating and cooling for 15% w/w CPP suspensions in water at pH values ranging from 4 - 9 and temperatures, 30˚C - 75˚C, during heating and cooling. Each G’-curve represents an average of triplicate experiments and error bars are shown to that at pH 9. No measurable gel development could be obtained at pH 4.
the CPP suspensions were all prepared for the same concentration (15% CPP, approx. 6% protein) and also at practically the same low ionic strength, which therefore, left the temperature and pH as the sole important variables controlling the process.
The cooling stage did not increase the gel strengths, as expected; on the contrary, it decreased them slightly. One reason might be that the CPP was not a pure protein but rather an extract powder carrying a mixture of all different components incorporated during the extraction, which might have affected the stability of the gel structure.
Visual assessment permitted also to distinguish the appearance of the gels over the pHs. For example, at the pH values above 7 the gels were of the same color like as the CPP, the light brown and displaying a smooth and more homogeneous structure, while at the lower pHs and close to the pI, they become whitish and more heterogeneous, showing liquid phase separation (section 3.4). Van der Linden & Venema [12] [13] demonstrated in their review that the protein aggregation at pH values close to the isoelectric points results in opaque and particulate aggregate gels, of some microns in size, while in opposition, transparent or translucent gels of fine strands, of some nanometers are formed, provided that the ionic strength is lower. This agrees into some extent with our results, although no transparency on gels was observed, probably because of the higher concentration of the CPP suspensions. In addition, the solubility of the CPP over the pHs was not 100%, as demonstrated in our previous works [14] and also the isoelectric precipitation occurred at the lower pHs when adjusting the pH prior the heat-induced aggregation.
3.2. Texture Analyzer—Gel Strength
The texture analysis results correlate well with the rheology measurements, in terms of gel strength, since the loads for the gel deformation and fracture were comparatively higher at pH 9, followed by 8 and then 7, as illustrate in Figure 2 and no measurable effects detected below pH 7. The gel strength was below detectability for the lower pHs.
As seen from the Figure 2 the highest load (approx. 0.36 N) for gel fracture at the pH 9 occurred within 2.2 mm gel depth, which resulted in a performed work of 0.48 [N.mm]. Similarly, at the pH 8 the maximum load was approximately 0.25 N in 2.6 mm depth, with almost the same work performed (0.48 N.mm), due to the longer distance. The pH 7 required only 0.08 N.mm work in a depth of 1.3 mm.
3.3. SDS-PAGE Electrophoresis
The SDS-PAGE on the initial CPP suspensions, diluted 10 times with the sample buffer, displayed a range of different polypeptide subunits, spanning molecular weights from the lowest (12 kDa) to the highest (53 kDa). Figure 3 presents the results, which show clearly that the bands at 53 and 43 kDa were the most sensitive to
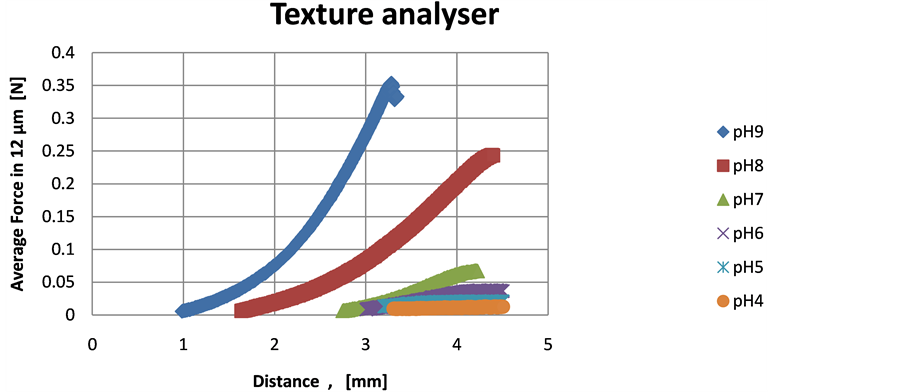
Figure 2. Gel texture analysis over pH. Test mode: back extrusion. Cylindrical probe (11 mm diameter, compression platens) and 25 mm diameter container. Test speed 0.2 mm/s.
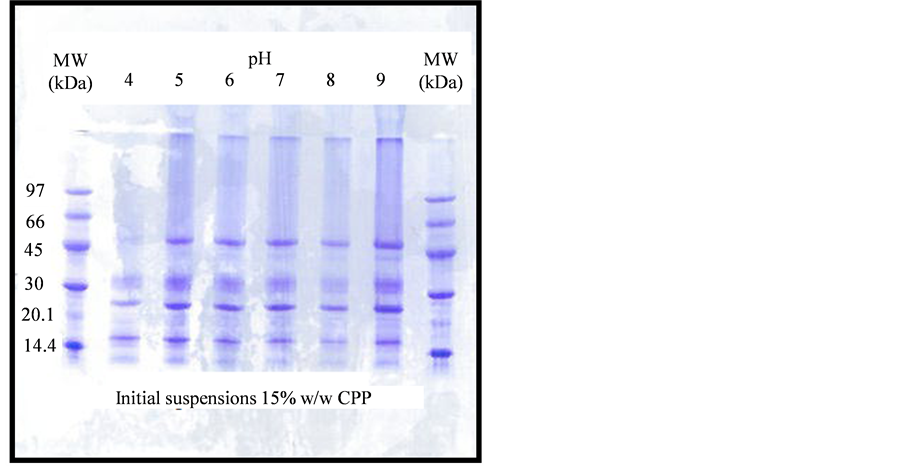
Figure 3. SDS-PAGE of initial CPP suspensions before heating, over the pH.
acidic environments. This effect, related to isoelectric precipitation was described in our previous work [14] . Large number of bands appeared at pH 9, compared to those at regions close to the isoelectric points. The electrophoresis pattern is, therefore, similar to many others already reported in the literature for coconut proteins [15] [16] , with very little differences.
Regarding the ability in gel formation, only some of the proteins present in the initial suspensions were found to participate in the gel network structures, as seen from Figure 4. The results show protein sub-units at 24 kDa, in the range of 32 - 34 kDa and at 53 kDa, as being the most responsible for gelation. These polypeptides were termed basic (22 - 24 kDa) and acidic (32 - 34 kDa) [15] [16] , which have the capacity to link together by disulfide bridges to form the 53 kDa, the subunit that composes an hexamer, the 11S globulin or cocosin, one of the major coconut endosperm protein.
Despite the same gel pattern over all pH range from Figure 4, however, there were significant differences in the gel structures and strength, as we described above. For example, the gels at pH 9, 8 and 7 were easy to wash out with water, without disrupting their structures and therefore, preventing to undertake the entrapped liquid or precipitated proteins that did not participate in the gel formation, to the assay. However, at pH below 7 it was difficult to separate the gel particulates from the precipitate aggregates and thus both of them were washed and put to run in SDS-PAGE.
The SDS-PAGE on the entrapped liquid phase after gelation, showed the remaining proteins, presenting the same profile as those in the initial suspension, Figure 3. This means that factors other than the availability of proteins might have limited the extension of gelation. Indeed, three factors: critical protein concentration, onset temperature and pH, for a given ionic strength, are considered as the main variables controlling the heat-induced gels of β-lactoglobulin, a whey globular protein [4] [11] . So, one reason for this might be that the gelation and related processes like precipitation, have consumed the proteins into an extent to which the final concentration was below the critical one. Although the ionic strength affects the minimum critical temperature, displacing it over the lowest, however, for the gelation to take effect, a minimal protein concentration is required. We observed in our preliminary experiments that below 13% CPP w/w (approx 5.5% protein) and heated at 75˚C for 1 hour, no gel was formed. Literature reports onset denaturation temperatures for soy proteins isolates of 70˚C and 80˚C, for β-conglycinin (or 7S globulin) and glycinin (or 11S globulin), respectively, at neutral pH and low ionic strength [17] , which are close to our results.
An increase in ionic strength has effect on the onset temperatures. Reports show that 7% w/v, β-lactoglobulin solution at an ionic strength of 100 mM NaCl gels at 73.4˚C and that the temperature drops down to 69.9˚C, when adding to the previous 20 mM CaCl2 [11] .
3.4. Gel Micro-Structure and Phase Separation
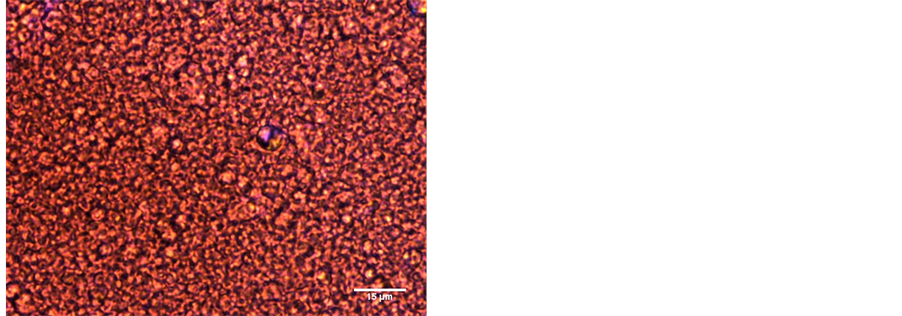
The gel phase separation is an issue that has received recently enormous interest and it has been shown that for β-lactoglobulin, the whey globular protein widely studied, the aggregation pattern falls into one of the phase equilibrium regions: the homogeneous gel, the phase separating gel or precipitate, depending on the Protein/Salt concentration ratio, when the pH is far from the isoelectric point [3] [13] . We also observed liquid separation in our gels, particularly those at the pH < 7, showing particulate gel structure. Figures 5 and 6 compare the gel structure at pH 4 and 9, taken from microscopy observation, at ×50 magnification.
To evaluate the micro-structure pattern, Image J Fourier transform (FFT) on the raw images were used, applying circular selection of 512 pixels (96.4 µm) radius on the FFT results, which generated the following radial profile heights, illustrated in Figure 7. At the given light microscopy resolution, homogenous texture with no predominant characteristic length was seen in images of pH 9, 8 and 7 gels.
The characteristic lengths in gels of pH 4 and 5 were identical, 4.2 micrometers, while pH 6 gel showed a broad distribution of larger structures centered on 8.0 micrometers.
4. Conclusions
The coconut press cake proteins form strong heat-set gels at 63˚C - 67˚C, in a range of pH 8 - 9 for 15% powd-

Figure 4. SDS-PAGE on the gels over the pH, observed only at pH 7 to 9. Below, it was a mixture of gel particulates and precipitate.
 (a)
(a)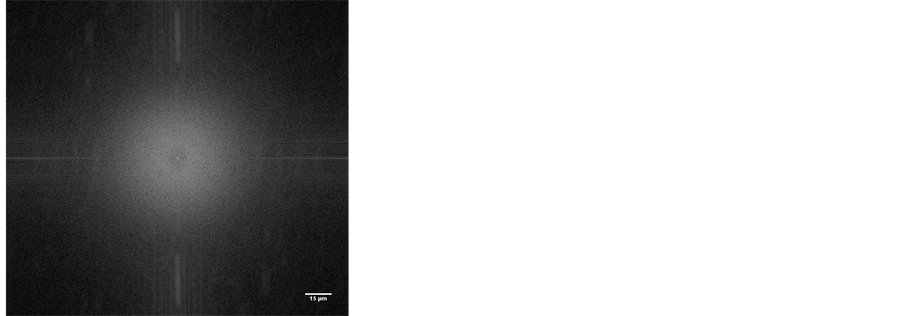 (b)
(b)
Figure 5. Particulate gel micro-structure at pH 4, with phase separation, taken from the microscopy, at ×50 magnification (a) and the Fourier transform image in reciprocal radio scale (b). Characteristic length of aggregates shown close to center.
 (a)
(a)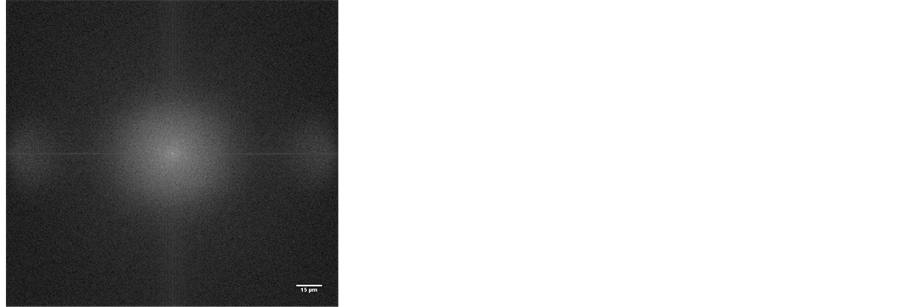 (b)
(b)
Figure 6. Smooth homogenousgel micro-structure at pH 9, taken from the microscopy, at ×50 magnification and the Fourier imagein reciprocal radio scale. No predominant length seen.

Figure 7. Fourier transform power spectrum of the images of gels varying pH.
er (6.5% protein), under low ionic strength. The gel strength and structure are greatly affected by the pH, reaching the maximum strength at pH 9. The gel structure becomes more particulate in the acidic environments, showing liquid phase separation.
The minimal critical concentration for gel formation is close to 13% w/w CPP (5.6% protein), and proteins at 24, 32 - 34 and 53 kDa in the SDS-PAGE are responsible for gelation.
Aknowledgements
This work is fully funded by SIDA (Swedish International Development Agency), to which the authors would like to thanks.