Nutritional Practices among Ethnic Minorities and Child Malnutrition in Mountainous Areas of Central Vietnam ()
1. Introduction
Protein energy malnutrition (PEM) among children under five is a key factor in growth failure and an increased mortality. Malnourished children are more susceptible to common childhood diseases than those who are adequately nourished. Annually more than six million children under five years old die in developing countries due directly or indirectly to malnutrition [1].
In Vietnam, the prevalence of malnutrition of children under five years old in 1985 was 51.5%. In recent years, with multi-sectoral participation and through the development and effective implementation of a Protein-Energy-Malnutrition prevention plan, the prevalence of children malnutrition has decreased remarkably to 26.6% in 2004. The rate of decrease in the prevalence of malnutrition in children (<5 y) is by around 2% annually. Currently, according to WHO and UNICEF definitions, Vietnam is considered to have an accelerated rate of decreasing malnutrition [2].
However, the prevalence of malnutrition in Vietnam still remains high. Prevalence of underweight among children under five in 2005 was 25.2% [3]. There is also an especially high prevalence of underweight children located in remote rural areas with the rates of 35.8% in the Central Highlands, 32.8% in the Northwest, 31.7% in the North Central region and 29.8% in the Northeast regions. Additionally, within each region, and even within the same province, the prevalence of malnutrition varies across cities, towns, and rural areas, as well as among ethnic groups. The problem of malnutrition in children less than 5 years old was also popular in surrounding countries of Vietnam. In Lao PDR, the rate of stunting was found to be 48%, wasting rate was 10% and underweight rate was 44% in a study published in 1996 [4]. Another study about malnutrition among ethnic children in China in 1995 showed that stunting rate was 51% and underweight rate was 18.9% [5].
Studies in Vietnam and in surrounding countries indicated factors associated with malnutrition among children less than 5 years of age include early complement food [6], discarding the colostrums milk [5,7,8]. Previous studies also indicated that malnutrition was associated with ethnic status of the mothers [5,7,8].
We carried out this study to identify the malnutrition and underweight rate of ethnic children less than 5 years old in this District and determine if there is association between nutritional practices of mothers with nutritional status of their children.
2. Methods
2.1. Study Location and Population
This study was conducted in February 2007 in Lang Chanh district, Thanh Hoa province. This is a predominantly mountainous, agricultural based area located 220 km Southeast of Hanoi. Encompassing an area of 586.32 square kilometers, Lang Chanh consists of 10 communes, one district town and a total of 98 villages. Lang Chanh has a population of 42,512. The Kinh group, the ethnic majority in Vietnam, accounts only for 10% of population, while the other 90% is made up of the Muong and Thai ethnic minority groups.
In this study, five communes were randomly selected from the list of communes obtained from the District People Committee. Children (n = 400) were randomly selected from the list of all children under five years of age in these communes, these lists were collected from these communes’ health centers. Children and their mothers were invited to take part in the study and the mothers were asked for an informed oral consent.
2.2. Sample and Sample Size
A sampling strategy was developed to take into account variability which may occur with respect to the indicators of interest between both individual children and between communes. We conducted a systematic random sampling which was based on a random table in order to select children in each commune. This sample selection was done in the list of all children less than 5 years of age in each commune with information about their date of birth, sex, mother’s name and home address provided by communes’ health centres before the fieldwork. The sample size of 384 children allowed us to measure the prevalence of malnutrition based on the weight for age within five percentage points with 95% confidence interval, and an expected prevalence of 48.6% within a 95% CI. 5% (16 children) was added to our sample size due to estimation of non-participation, as a result, we have a sample size of 400 children [9]. The list of all children from these five communes along with information about date of birth, sex, mother’s name and home address was completed before taking the survey. The selected children and their mothers, or care givers, were invited for the survey.
2.3. Data Collection
Body weight and height of the children were measured using standardized procedures [10] and recorded as the midpoint of duplicate measurements. The children’s weight was measured to the nearest 100 grams using an electronic scale (Seca, 890, UK) and the standing height was measured to the nearest 1 mm with a wooden staidometer (CMS equipment Ltd, UK). For infants and children (<2 y) the child was laid down, facing upwards, with the head exactly against the headboard. The child’s shoes were removed, and their knees were held straight with their toes pointing directly upward. A movable footboard was then placed against the heels and the measurement was read to the nearest 1 mm [10]. The subjects wore minimum clothing. Age was calculated from the birth date in the school records and based on birth certificates.
Mothers were asked about their breastfeeding and weaning practices and other socio-economic information such as ethnic background, education, income level, etc.
2.4. Data Analysis
Anthropometric indices were calculated using WHO/ NCHS reference data[11]. Wasting, stunting and underweight were defined by z-scores < −2SD for weightfor-height (WFH), height-for-age (HFA) and weight-forage (WFA), respectively.
2.5. Statistical Analyses
The data was entered and then cleaned and managed using Epi Info version 6 [12]. We then analyzed the data using SPSS 11.0 (SPSS Inc., Chicago IL, USA) [13]. Differences in nutritional status were assessed by age group, gender, frequency of food consumption using independent sample t-test for continuous variables. In order to assess the association between maternal child care practices and malnutrition rates, logistic regression was used to assess the effect of breastfeeding and weaning practices on nutritional status of children at the level of significance of p < 0.05.
3. Results
Totally 400 mothers and 400 children of these mothers participated in the study. The mothers in this study were mainly Muong and Thai ethnic groups (48.3% and 41.5% respectively) and the main occupation of the respondents is farmer (91.5%). The proportion of mothers having one child or two children is approximately equal (44.3% and 43.3%, respectively). 12.4% of mothers have three children and above. In terms of maternal education, 1.8% of mothers are illiterate, majority of whom (62.8%) have junior-secondary education level and only 2.6% have high school or University education level. Gender distribution among the surveyed children was split equally with 47.5% female and 52.5% male (data not shown).
There was not a significant difference between males and females in nutritional status as regard to the measurements of mean weight for age z-score (WAZ), mean height for age z-score (HAZ) and mean weight for height z-score (WHZ) (p > 0.05; t-test) (Table 1).
The malnutrition rate of children (<5 years old) in the study area was 29.3% by WAZ, 28.3% by HAZ and 10.0% by WHZ. There were very few incidents of moderate to severe malnutrition (5% by WAZ, 9% by HAZ and 1.5% by WHZ) (Figure 1). The highest prevalence of underweight individuals is observed in the 24 - 35.9 months age group (38.9%), followed by the 36 - 60 months age group (34.8%) and lowest in the 6 - 23.9 months group (23.7%), there were no underweight children younger than 6 months in this study. Stunting prevalence increased with age, starting with the under 6 month’s group (10%) and increased to a rate of 36.2% in the 36 - 60 months age group. The wasting prevalence was the highest in the group of children from 6 - 23.9 months, and was split equally in the 24 - 35.9 months and 36 - 60 months age groups. There was no incidence of wasting in the less than 6 months age group (Figure 2).
Table 2 shows that 78.3% of mothers breastfeed their child within 30 minutes after delivery. 6.4% of the mothers breastfeed their children very late (>6 hr after birth) and 27.3% of mothers discarded the colostrum milk before breastfeeding their infant. Surprisingly, 28.2% of mothers gave children different food or juices before breastfeeding their child. The mean length of the breastfeeding time was 17.5 ± 5.3 months. 53.7% of the children were introduced to complementary food before 4 months of age. Their first complementary foods consisted mainly of rice and rice flour (47.9% and 46.3% respectively). The number of meals consumed by children in the survey areas was 3.1 ± 0.6.
The prevalence of exclusive breastfeeding below 4 months was 53.7% and below one month was 36.4%. In terms of weaning practices: 7.4% of the children had completely ceased breastfeeding before one year of age, 36.4% had ceased breastfeeding between 12 - 18 months and 1% of the children had terminated breastfeeding at 18 - 24 months (data not shown).
Figure 3 indicates the frequency of food consumption of the children during the last week. For the protein rich
Table 1. Mean weight, height, WAZ, HAZ and WHZ of children by sex groups.
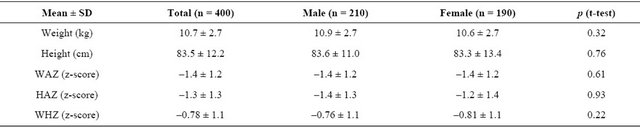

Figure 1. Nutritional status of children under five defined by different indicators.
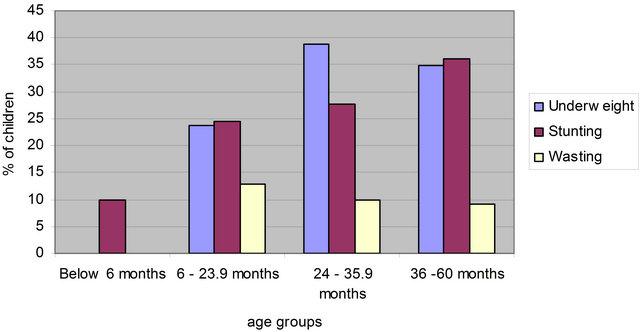
Figure 2. Malnutrition by different indicators by age groups.
Table 2. Breastfeeding and weaning practices.
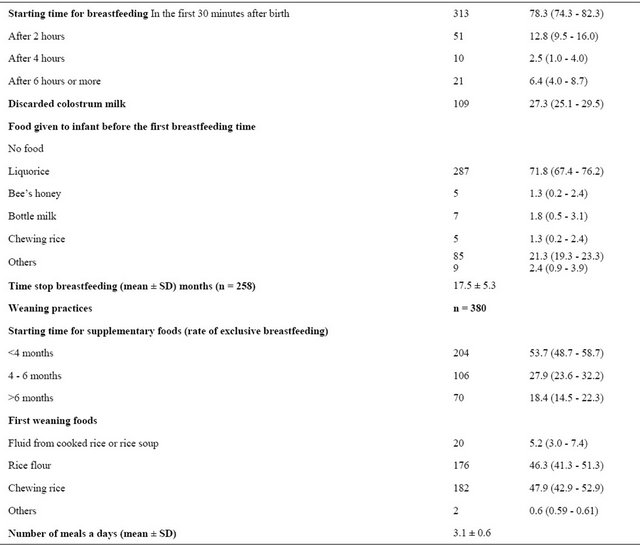
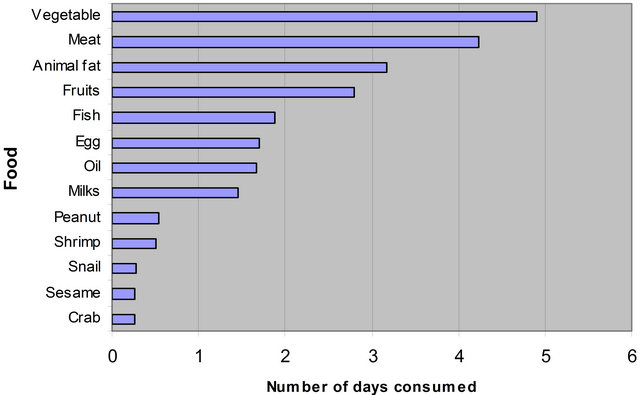
Figure 3. Food consumption of the surveyed children in the last week.
food group, the frequency of meat consumption (excluding fish) was peaked at approximately four times a week (4.2 ± 2.0), followed by fish (1.9 ± 1.6), and egg both with approximately two times per week (1.7 ± 1.7). Other protein rich products such as shrimp, crab and snails were consumed less than one time a week. For the lipid rich food group, animal fat was consumed most frequently, about 3 times a week (3.2 ± 2.8). The frequency of oil consumption was low at 1.7 ± 2.5 times per week. Alternative food group which are rich in fat such as peanut and sesame even less consumed by the children (0.5 ± 1.2 and 0.3 ± 0.9 respectively). Children consumed vegetables almost five times a week (4.9 ± 2.3) while the frequency of fruit intake was less than 3 times a week (2.8 ± 2.4).
Table 3 indicates that there is an association between malnutrition and meat consumption. The frequency of meat consumption by the malnourished underweight group was significantly lower than the meat consumption of the non-malnourished group (4.4 ± 1.9 compared to 3.8 ± 2.0; p = 0.01). There was also an association between egg consumption and nutritional status.
Data from Table 4 indicates that there was no relationship between the malnutrition status and the time to discontinue breastfeeding and start supplementary feeding. Moreover, the length of breastfeeding did not affect the nutritional status of children as indicated in the Table 3. The malnourished children were breastfeed for 16.8 ± 5.0 months and the non-malnourished children were breastfeed for mean of 18.0 ± 5.5 months with p > 0.05 (independent sample t-test). There was an association between ethnic group of mother and child malnutrition. This data indicates that children from ethnic minorities (Thai and Muong) have a 2.7 fold risk increase for underweight prevalence (OR = 2.7 95% CI = 1.1 – 6.5) than the Kin group (Table 4). There was no relationship shown between the mother’s education and the children’s nutritional status in this study.
4. Discussion
The present study showed child malnutrition rates of the underweight malnutrition (WAZ) being 29.3%, stunting (HAZ) rates at 28.3% and wasting (WHZ) rates at 10.0%. Comparing with the Vietnam national data in 2005, the underweight and wasting prevalence of the survey population was higher than that the national data (national average) (25.2% underweight and 6.9% wasted, respectively). The stunting prevalence in the survey was slightly lower than National average (28.3 % compared with 29.6%) [3]. The rate of underweight, stunting and wasting found in this study is lower than the corresponddence rate among children under 5 years old in another central province in Vietnam in 2007 (31.8%; 44.3% and 11.9% respectively) and the rates among Laos children in a study in 1993 [4,7]. The underweight and wasting rate in this study is higher and the stunting rate is lower than the correspondence rates among ethnic minority under 5 years old children in China in an article published in 1999 [5]. However, the underweight rate is similar to the finding of a study in Indonesia in 1999 [14].
The highest underweight prevalence belongs to 24 - 35.9 months group. No children younger than 6 months of age were suffering from underweight malnutrition. Stunting prevalence increased by age, with the lowest rates being from the 0 - 6 months group which is similar with the finding from others studies [3,15-18]. Stunting reflects the nutritional status of the past [3] and therefore is
Table 3. The association between frequency of food consumption and nutritional status.

Table 4. The association between mother’s demographic characteristics and mother nutrition practice with underweight and malnutrition.

an indicator of cumulative malnutrition prevalence. It is intuitive that this indicator would increase throughout the age groups. Underweight prevalence is congruent with the current nutritional status, and the prevalence of under weight individuals was highest in the 24 - 35.9 months age group. This may be explained by the fact that during this period exclusive breastfeeding was ceased and the child’s nutritional status depends very highly on the type of foods used for weaning [3]. For children 0 - 6 months of age, acute malnutrition was rare unless the infant was born with a low birth weight. This is because the infant’s main food at this stage is breast milk and in this period children do not suffer from many infectious diseases due to the antibodies transferred from the mother to the child.
Children in this study were introduced the weaning food very early in the child’s development, and in some cases the consumption of chewing rice was initiated immediately after birth. This practice is due to the local cultural belief that, without rice, children can not be healthy. This may be a contributing factor to the high prevalence of the malnutrition in the study area although the data did not show the association. The study also found that mother’s poor nutrition care behaviours such as early termination of exclusive breastfeeding before 4 months and early complement food feeding is associated with malnutrition in children. This finding is similar to the finding of other studies in Cambodia, Laos and China [4,5,19]. One study in Vietnam also showed that early complement food associated with poorer growth of children [6].
However, there was an association between the ethnic grouping of the mother and the nutritional status of the children. Other studies in Vietnam, China found similar result [5,7,8]. This may be explained that detrimental ethnic customs and habits of older generations have affected the belief and associated maternal nutritional child care practices. These practices include; the giving of chewing rice, discarding the colostrum milk and early weaning. These may be a contributing factor to the poor nutritional status of these children. However, this survey was not able to prove this.
There was an association between nutritional status of the children and the protein rich food consumption. This is in line with previous studies that show that low income households have a high prevalence of malnutrition due to a lower protein intake [15].
It is difficult to generalize the result of this study to the whole Lang Chanh district as because the study was just conducted in 5 communes where most of population are ethnic minority people. However, this study provided a very good understanding about breastfeeding and weaning practice of ethnic mother, as such, could provide valuable recommendations for health promotion programs targeting ethnic minority groups.
5. Conclusion
Malnutrition of children under five years of age is still a public health problem in the study region with the rate of underweight was 29.3%; stunting rate was 28.3% and wasting rate was 10%. Inappropriate breastfeeding and weaning practice among ethnic minority women is associated with this high malnutrition rate. Despite the fact that the first National Action Plan on Nutrition (1995- 2000) improved significantly the nutrition status of Vietnamese people [20], the result of this study shows that further effort should continue to improve the nutrition status of ethnic minority children under 5 years of age. Customized, culturally adapted interventions for ethnic minority women to strengthen their nutrition care knowledge, attitude and practice, especially breastfeeding and weaning practice is the key to achieve better nutrition status of their children. The development and implementation of health education intervention should include the participation of targeted minority mothers in order to understand their needs. Health communications should be in a format that attract community and appropriate with the local culture as well as using local language that could be understandable by local people. Art-based communication activities such as singing, drama contest, and roll-play are encouraged.
6. Author’s Contribution
HT Le was responsible for all aspects of protocol development, data collection, data analysis and report writing. NTT Vu was involved in data analysis and report writing.
7. Acknowledgements
This research is financially supported by World Vision Vietnam—an international non-Governmental Organization operates in Vietnam. World Vision Vietnam supported the coordination with local authorities to facilitate for the data collection at the studied location.
List of Abbreviations
PEM, Protein energy malnutrition;
NCHS, National Centre of Health Statistic;
WAZ, weight for age z-score;
HAZ, height for age z-score;
NOTES