Study of Galaxy Distributions with SDSS DR14 Data and Measurement of Neutrino Masses ()
1. Introduction
We measure neutrino masses by comparing the predictions of the ΛCDM model with measurements of the power spectrum of linear density perturbations
. We consider three measurements of
: 1) the Sachs-Wolfe effect of fluctuations of the Cosmic Microwave Background (CMB) which is a direct measurement of density fluctuations [1] [2] ; 2) the relative mass fluctuations
in randomly placed spheres of radius
Mpc with gravitational lensing and studies of rich galaxy clusters [2] [3] ; and 3) measurements of
inferred from galaxy clustering with the Sloan Digital Sky Survey [4] [5] [6] . Baryon Acoustic Oscillations (BAO) were considered separately [7] [8] and are not included in the present study, except for the final combinations.
To be specific, we consider three active neutrino eigenstates with nearly the same mass, so
. This is a useful scenario to consider because the current limits on
are much larger than the mass-squared-differences
and
obtained from neutrino oscillations [3] .
Figures 1-4 illustrate the problem at hand. Figures 1-3 present measurements of the “reconstructed” galaxy power spectrum
obtained from the SDSS-III BOSS survey [4] , while Figure 4 presents the corresponding “standard”
. The “reconstructed”
is obtained from the directly measured “standard”
by subtracting peculiar motions to obtain the power spectrum prior to non-linear clustering. Also shown are various fits to this data (with floating normalization), and to measurements of the Sachs-Wolfe effect, and
. The Sachs-Wolfe effect normalizes
, within its uncertainty, in the approximate range of
from −3.1 to −2.7, while
is most sensitive to the range −1.3 to −0.6. Full details will be given in the main body of this article.
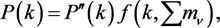
The fit in Figure 1 corresponds to the function
![]()
Figure 1. Comparison of
obtained from the SDSS-III BOSS survey [4] (“reconstructed”) with
obtained from a fit of Equation (5) with
eV to the Sachs-Wolfe effect,
, and
. The fit obtains
,
,
, and
, with
for 19 degrees of freedom. Also shown for comparison is the curve with the same parameters, except
eV.
![]()
Figure 2. Same as Figure 1, except that the curve “
eV” is fit. We obtain
,
,
, and
, with
for 19 degrees of freedom. Note that
is largely degenerate with the remaining parameters in Equation (5), unless we are able to constrain
.
![]()
Figure 3. Comparison of
obtained from the SDSS-III BOSS survey [4] (“reconstructed”) with
obtained from a fit of Equation (6) to the Sachs-Wolfe effect,
, and
. The fit obtains
eV,
, and
, with
for 20 degrees of freedom (so the statistical uncertainties shown need to be multiplied by
). Also shown is the fit with
eV fixed for comparison.
![]()
Figure 4. Comparison of
obtained from the SDSS-III BOSS survey [4] (“standard”) with
obtained from a fit of Equation (6) to the Sachs-Wolfe effect,
, and
. The fit obtains
eV,
, and
, with
for 20 degrees of freedom (so the statistical uncertainties shown need to be multiplied by
). Also shown is the fit with
eV fixed for comparison.
(1)
where
. Unless otherwise noted, we take the Harrison-Zel’dovich index n = 1 which is close to observations. The parameters A,
, and
, as well as the normalization factor b2, are free in the fit. The uncertainties of two data points that fall on BAO peaks are multiplied by three (since BAO is not included in
).
Also shown in Figure 1 is the suppression of
for k greater than
(2)
due to free-streaming of massive neutrinos that can not cluster on these small scales, and, more importantly, to the slower growth of structure with massive neutrinos [9] . The suppression factor for
for one massive neutrino, or three degenerate massive neutrinos, is
(3)
where
[9] .
is the total (dark plus baryonic plus neutrino) matter density today relative to the critical density, and includes the contribution
of neutrinos that are non-relativistic today.
eV for three left-handed plus right-handed Majorana neutrino eigenstates, or three eigenstates of left-handed Dirac neutrinos plus three right-handed Dirac anti-neutrinos, that are non-relativistic today (right-handed Dirac neutrinos and left-handed Dirac anti-neutrinos are assumed to not have reached thermal and chemical equilibrium with the Standard Model particles). We take
for
, and
(4)
for
and
eV, for galaxy formation at a redshift
[9] .
Figure 2 is the same as Figure 1 except that the function
(5)
with
eV is fit. We see that the parameter
is largely degenerate with the parameters A,
, and
, so that only a weak sensitivity to
is obtained unless we are able to constrain
. The power spectrum
of Equation (1) neglects the growth of structure inside the horizon while radiation dominates.
The fits in Figure 3 and Figure 4 make full use of the ΛCDM theory. The fitted function is
 (6)
(6)
where  is given by [2] :
 (7)
(7)
with
 (8)
(8)
C is a function of , and we take
  [2] .
[2] .  is a function given in Reference [2] . The pivot point
  is chosen to not upset Equation (41) below. The fit depends on h,
  , and the spectral index n, so we define
  [3] ,
[3] ,  [7] , and
  [3] , and obtain, tentatively,
 (9)
(9)
by minimizing the  with respect to
![]() , and
, and![]() . The statistical uncertainty has been multiplied by the square root of the
. The statistical uncertainty has been multiplied by the square root of the ![]() per degree of freedom. This result corresponds to the “reconstructed” data in Figure 3. The systematic uncertainties included are from the top-hat window function instead of the gaussian window function, and an alternative value of
per degree of freedom. This result corresponds to the “reconstructed” data in Figure 3. The systematic uncertainties included are from the top-hat window function instead of the gaussian window function, and an alternative value of ![]() (details will be given in Section 3). Not included is the systematic uncertainty due to the possible scale dependence of the galaxy bias b.
(details will be given in Section 3). Not included is the systematic uncertainty due to the possible scale dependence of the galaxy bias b.
To obtain![]() , we would like to measure the density
, we would like to measure the density ![]() at redshift z, but we only have information on the peaks of
at redshift z, but we only have information on the peaks of ![]() that have gone non-linear collapsing into visible galaxies. How accurate is the measurement of
that have gone non-linear collapsing into visible galaxies. How accurate is the measurement of ![]() with galaxies? The measurement of
with galaxies? The measurement of ![]() in Ref. [4] is based on a procedure described in [10] based on “the usual assumption that the galaxies form a Poisson sample [11] of the density field”. In other words, the assumption is that the number density of point galaxies
in Ref. [4] is based on a procedure described in [10] based on “the usual assumption that the galaxies form a Poisson sample [11] of the density field”. In other words, the assumption is that the number density of point galaxies ![]() is equal to its expected mean
is equal to its expected mean ![]() (which depends on the position dependent galaxy selection criteria), modulated by the perturbation of the density field:
(which depends on the position dependent galaxy selection criteria), modulated by the perturbation of the density field:
![]() (10)
(10)
Both sides of this equation are measured or calculated at the same length scale, and at the same time. The “galaxy bias” b is explicitly assumed to be scale invariant. If we choose a region of space such that ![]() is constant, then the galaxy power spectrum
is constant, then the galaxy power spectrum ![]() (derived from
(derived from![]() ) should be proportional, under the above assumption, to the power spectrum of linear density perturbations
) should be proportional, under the above assumption, to the power spectrum of linear density perturbations ![]() (derived from
(derived from![]() ) up to corrections:
) up to corrections:
![]() (11)
(11)
It is due to this bias b that we have freed the normalization of the measured ![]() in the fits corresponding to Figures 1-4.
in the fits corresponding to Figures 1-4.
In the following Sections we study galaxy distributions with SDSS DR14 data and with simulations, in order to understand their connection with the underlying power spectrum of linear density fluctuations![]() . In the end we return to the measurement of neutrino masses.
. In the end we return to the measurement of neutrino masses.
2. The Hierarchical Formation of Galaxies
This Section allows a precise definition of![]() , and an understanding of the connection between
, and an understanding of the connection between ![]() and
and![]() . We generate galaxies as follows (see [12] for full details). The evolution of the Universe in the homogeneous approximation is described by the Friedmann equation
. We generate galaxies as follows (see [12] for full details). The evolution of the Universe in the homogeneous approximation is described by the Friedmann equation
![]() (12)
(12)
The expansion parameter ![]() has been normalized to 1 at the present time
has been normalized to 1 at the present time![]() :
:![]() .
. ![]() has been normalized so
has been normalized so![]() . Therefore
. Therefore ![]() is the present Hubble expansion rate. With these normalizations we have
is the present Hubble expansion rate. With these normalizations we have![]() . The matter density is
. The matter density is![]() , where
, where ![]() is the critical density of the Universe. We are interested in the period after the density of matter exceeds the density of radiation. For our simulations we assume flat space, i.e.
is the critical density of the Universe. We are interested in the period after the density of matter exceeds the density of radiation. For our simulations we assume flat space, i.e.![]() , we neglect the radiation density
, we neglect the radiation density![]() , take
, take ![]() constant [7] , and the present Hubble expansion rate
constant [7] , and the present Hubble expansion rate ![]() with
with ![]() [3] . The solution to Equation (12) with these parameters is shown by the curve “
[3] . The solution to Equation (12) with these parameters is shown by the curve “![]() ” in Figure 5. The present age of the universe with these parameters is
” in Figure 5. The present age of the universe with these parameters is ![]() Gyr.
Gyr.
Setting ![]() we obtain the critical universe with expansion parameter
we obtain the critical universe with expansion parameter
![]() (13)
(13)
also shown in Figure 5. We note that![]() . Let us now add density fluctuations to this critical universe and consider a density peak. The growing mode for this density peak is obtained by adding a negative
. Let us now add density fluctuations to this critical universe and consider a density peak. The growing mode for this density peak is obtained by adding a negative ![]() to the critical Universe. This prescription is exact if the density peak is spherically symmetric. An example with “expansion parameter”
to the critical Universe. This prescription is exact if the density peak is spherically symmetric. An example with “expansion parameter” ![]() is presented in Figure 5. Note that
is presented in Figure 5. Note that ![]() grows to maximum expansion and then collapses to zero at time
grows to maximum expansion and then collapses to zero at time![]() , and, in our model [12] , a galaxy forms. In the example of Figure 5 the galaxy forms at redshift
, and, in our model [12] , a galaxy forms. In the example of Figure 5 the galaxy forms at redshift![]() .
. ![]() is the linear approximation to
is the linear approximation to![]() . In the linear approximation for growing modes the density fluctuations relative to
. In the linear approximation for growing modes the density fluctuations relative to ![]() grow in proportion to
grow in proportion to![]() :
:
![]() (14)
(14)
while![]() . At the time
. At the time![]() , when the galaxy forms,
, when the galaxy forms, ![]() in the linear approximation (which has already broken down).
in the linear approximation (which has already broken down).
In the linear approximation the density due to Fourier components of wavevector ![]() is
is
![]() (15)
(15)
where
![]() (16)
(16)
![]() are random phases. The sum of the Fourier series is over comoving wavevectors that satisfy periodic boundary conditions in a rectangular box of volume
are random phases. The sum of the Fourier series is over comoving wavevectors that satisfy periodic boundary conditions in a rectangular box of volume![]() :
:
![]() (17)
(17)
where![]() ,
, ![]() ,
, ![]() ,
, ![]() , and
, and
![]() (18)
(18)
where![]() , and
, and![]() .
.
Inverting Equation (16) obtains
![]() (19)
(19)
where ![]() is the comoving coordinate in the linear approximation. The power spectrum of density fluctuations
is the comoving coordinate in the linear approximation. The power spectrum of density fluctuations
![]() (20)
(20)
is defined in the linear approximation corresponding to![]() , and is approximately independent of V for large V. Averaging over
, and is approximately independent of V for large V. Averaging over ![]() in a bin of
in a bin of ![]() obtains
obtains![]() . Note that
. Note that
![]() (21)
(21)
Each term in this equation is approximately independent of V. The Fourier transform of the power spectrum is the correlation function:
![]() (22)
(22)
The generation of galaxies at time t proceeds as follows. We start with![]() , calculate
, calculate![]() , and search for local maximums of
, and search for local maximums of ![]() inside a comoving volume
inside a comoving volume![]() . If a maximum exceeds 1.69 we generate a galaxy of radius
. If a maximum exceeds 1.69 we generate a galaxy of radius
![]() (23)
(23)
and dark plus baryonic plus neutrino mass
![]() (24)
(24)
if it “fits”, i.e. if it does not overlap previously generated galaxies. I is increased by 1 unit to generate galaxies of a smaller generation, until ![]() is reached. See Figure 6.
is reached. See Figure 6.
The peculiar velocity of the generated galaxies is
![]() (25)
(25)
and their peculiar displacement is
![]() (26)
(26)
![]() is the proper coordinate of a galaxy at the time t of its generation, and
is the proper coordinate of a galaxy at the time t of its generation, and![]() . The comoving coordinate of this galaxy, i.e. its position extrapolated to the present time, is the corresponding
. The comoving coordinate of this galaxy, i.e. its position extrapolated to the present time, is the corresponding![]() .
. ![]() causes the difference between the data points
causes the difference between the data points ![]() in Figure 3 and Figure 4 at large k.
in Figure 3 and Figure 4 at large k.
Note in Figure 6 that the formation of galaxies is hierarchical: small galaxies form first, and, as time goes on, density perturbations grow, and groups of galaxies coalesce into larger galaxies in an ongoing process until dark energy dominates and the hierarchical formation of galaxies comes to an end. The distribution of galaxies of generation I depend only on ![]() for
for![]() . Also,
. Also,
![]()
Figure 6. The hierarchical formation of galaxies [12] . Three Fourier components of the density in the linear approximation are shown. Note that in the linear approximation![]() . When
. When ![]() reaches 1.69 in the linear approximation the exact solution diverges and a galaxy forms. As time goes on, density perturbations grow, and groups of galaxies of one generation coalesce into larger galaxies of a new generation as shown on the right.
reaches 1.69 in the linear approximation the exact solution diverges and a galaxy forms. As time goes on, density perturbations grow, and groups of galaxies of one generation coalesce into larger galaxies of a new generation as shown on the right.
luminous galaxies occupy a total volume (luminous plus dark) less than 1/2.69 of space.
Neutrinos with ![]() eV become non-relativistic after the densities of radiation and matter become equal, as illustrated in Figure 7.
eV become non-relativistic after the densities of radiation and matter become equal, as illustrated in Figure 7.
3. Fluctuation Amplitude σ8
![]() is the root-mean-square fluctuation of total mass relative to the mean in randomly placed volumes of radius
is the root-mean-square fluctuation of total mass relative to the mean in randomly placed volumes of radius ![]() Mpc. We use a “gaussian window function”
Mpc. We use a “gaussian window function”
![]() (27)
(27)
which smoothly defines a volume
![]() (28)
(28)
Note that
![]() (29)
(29)
The Fourier transform of ![]() is
is
![]() (30)
(30)
Then
![]() (31)
(31)
An alternative window function is the “top hat” function ![]() for
for![]() , and
, and ![]() for
for![]() . Then
. Then
![]() (32)
(32)
Direct measurements obtain [3]
![]() (33)
(33)
80% of ![]() is due to k/h in the range 0.05 to 0.25 Mpc−1. For comparison, from the 6-parameter ΛCDM fit [3] ,
is due to k/h in the range 0.05 to 0.25 Mpc−1. For comparison, from the 6-parameter ΛCDM fit [3] ,![]() .
.
4. The Sachs-Wolfe Effect
The spherical harmonic expansion of the CMB temperature fluctuation is
![]() (34)
(34)
Averaging over m obtains![]() . The variable that is measured is [2]
. The variable that is measured is [2]
![]() (35)
(35)
For ![]() the dominant contribution to
the dominant contribution to ![]() is from the Sachs-Wolfe effect [1] [2] [3] . This range corresponds to
is from the Sachs-Wolfe effect [1] [2] [3] . This range corresponds to![]() . The Sachs-Wolfe effect relates temperature fluctuations of the CMB to perturbations of the gravitational potential
. The Sachs-Wolfe effect relates temperature fluctuations of the CMB to perturbations of the gravitational potential ![]() [2] :
[2] :
![]() (36)
(36)
When expressed as a function of comoving coordinates, ![]() is independent of time when matter dominates. The primordial power spectrum of gravitational potential fluctuations is assumed to have the form [2]
is independent of time when matter dominates. The primordial power spectrum of gravitational potential fluctuations is assumed to have the form [2]
![]() (37)
(37)
The relation between ![]() and
and ![]() is
is ![]() [2] . In the present analysis, unless otherwise stated, we assume the Harrison-Zel’dovich power spectrum with n = 1, which is close to observations [3] . For
[2] . In the present analysis, unless otherwise stated, we assume the Harrison-Zel’dovich power spectrum with n = 1, which is close to observations [3] . For![]() , [2]
, [2]
![]() (38)
(38)
where the “quadrupole moment” Q is measured to be
![]() (39)
(39)
from the 1996 COBE results (see list of references in [2] ). Then, for![]() ,
,
![]() (40)
(40)
and for![]() ,
,
![]() (41)
(41)
independently of![]() . Detailed integration obtains results within 10% for
. Detailed integration obtains results within 10% for![]() .
.
5. Data and Simulations
The data are obtained from the publicly available SDSS DR14 catalog [5] [6] , see acknowledgement. We consider objects classified as GALAXY, with redshift z in the range 0.4 to 0.6, with redshift error![]() , passing quality selection flags. We further select galaxies in the northern galactic cap, in a “rectangular” volume with
, passing quality selection flags. We further select galaxies in the northern galactic cap, in a “rectangular” volume with ![]() Mpc along the line of sight (corresponding to redshift
Mpc along the line of sight (corresponding to redshift![]() ),
), ![]() Mpc (corresponding to an angle 860 across the sky), and
Mpc (corresponding to an angle 860 across the sky), and ![]() Mpc (corresponding to an angle 320). In total 222470 galaxies pass these selections. The distributions of these galaxies are shown in Figure 8.
Mpc (corresponding to an angle 320). In total 222470 galaxies pass these selections. The distributions of these galaxies are shown in Figure 8.
Unless otherwise specified, the simulations have ![]() Mpc,
Mpc, ![]() ,
, ![]() ,
, ![]() ,
, ![]() ,
, ![]() , and the input power spectrum of density fluctuations is (5) with
, and the input power spectrum of density fluctuations is (5) with ![]() Mpc3,
Mpc3, ![]() Mpc−1,
Mpc−1, ![]() , and
, and ![]() eV. We generate galaxies at redshift
eV. We generate galaxies at redshift![]() , corresponding to
, corresponding to ![]() Gyr, and
Gyr, and![]() . This reference simulation has 34,444 galaxies, which is near the limit we can generate with available computing resources.
. This reference simulation has 34,444 galaxies, which is near the limit we can generate with available computing resources.
Some definitions are in order. For data we define the absolute red magnitude of a galaxy MAGr at redshift z as the SDSS DR14 variable -modelMag_r corrected to the reference redshift 0.35. Similarly, we define the absolute green magnitude of a galaxy MAGg at redshift z as the SDSS DR14 variable -modelMag_g corrected to the reference redshift 0.35. For a simulated galaxy we define the absolute magnitude MAG![]() , where M is defined by Equation (24). Note that MAGr and MAGg are derived from observed luminosities, while MAG is derived from the total (baryonic plus dark plus neutrino) mass of the simulation. These quantities can only be compared if the luminosity-to-mass ratio is known.
, where M is defined by Equation (24). Note that MAGr and MAGg are derived from observed luminosities, while MAG is derived from the total (baryonic plus dark plus neutrino) mass of the simulation. These quantities can only be compared if the luminosity-to-mass ratio is known.
The number of galaxies per unit volume depends on the limiting magnitude of the survey, or on ![]() of the simulation.
of the simulation.
6. Distributions of Galaxies in SDSS DR14 Data and in Simulation
We would like to obtain ![]() from Equation (19) and Equation (20). Unfortunately we do not have access to the relative density fluctuation
from Equation (19) and Equation (20). Unfortunately we do not have access to the relative density fluctuation![]() . Instead we have access to the positions of galaxies and their luminosities. The relation between luminosity and mass of galaxies depends on many variables and is largely unknown, so we focus on the information contained in the positions of galaxies.
. Instead we have access to the positions of galaxies and their luminosities. The relation between luminosity and mass of galaxies depends on many variables and is largely unknown, so we focus on the information contained in the positions of galaxies.
Let
![]() (42)
(42)
be the number density of point galaxies at redshift z as a function of the comoving coordinate![]() . We have applied periodic boundary conditions in a comoving volume
. We have applied periodic boundary conditions in a comoving volume![]() , so
, so ![]() has the discrete values of Equation (17).
has the discrete values of Equation (17). ![]() is real, so
is real, so![]() . The number of galaxies in V is
. The number of galaxies in V is![]() . To invert Equation (42), we multiply it by
. To invert Equation (42), we multiply it by![]() , integrate over V, and obtain a sum over galaxies j:
, integrate over V, and obtain a sum over galaxies j:
![]() (43)
(43)
The first term on the right hand side of Equation (43) is the result of a coherent sum of ![]() terms corresponding to mode
terms corresponding to mode![]() . The second term is the result of an incoherent sum which we have approximated to
. The second term is the result of an incoherent sum which we have approximated to![]() , where the phase
, where the phase ![]() is arbitrary. We define the “galaxy power spectrum”
is arbitrary. We define the “galaxy power spectrum”
![]() (44)
(44)
and obtain
![]() (45)
(45)
The transition between signal and noise occurs at ![]() for our data sample, and ≈3.49 for our reference simulation. To test these ideas we can select a narrow range of MAGr, MAGg, or MAG to shift the noise upwards, compare Figures 9-11 (which plot the first term on the right hand side of Equation (45) and include the noise at large k).
for our data sample, and ≈3.49 for our reference simulation. To test these ideas we can select a narrow range of MAGr, MAGg, or MAG to shift the noise upwards, compare Figures 9-11 (which plot the first term on the right hand side of Equation (45) and include the noise at large k).
Averaging over ![]() in a bin of
in a bin of ![]() obtains
obtains![]() . The factor V is inserted so that
. The factor V is inserted so that ![]() becomes independent of the arbitrary choice of V for large V. The function
becomes independent of the arbitrary choice of V for large V. The function ![]() defines statistically the distribution of galaxies. The variables
defines statistically the distribution of galaxies. The variables ![]() in Equation (16) and Equation (45) should not be confused: there is not necessarily a one-to-one relation between them.
in Equation (16) and Equation (45) should not be confused: there is not necessarily a one-to-one relation between them.
Results for data are presented in Figures 9-11. We note that the galaxy bias b depends on MAGr and MAGg. Even tho![]() ,
, ![]() at small k. For this reason
at small k. For this reason ![]() in Figure 9 extends to higher k than in Figure 10 and Figure 11 before saturating with noise. Figure 12 presents the noise subtracted galaxy power spectrum
in Figure 9 extends to higher k than in Figure 10 and Figure 11 before saturating with noise. Figure 12 presents the noise subtracted galaxy power spectrum![]() , obtained from Figure 9, compared with
, obtained from Figure 9, compared with ![]() calculated with the indicated parameters. Their ratio is the bias b2.
calculated with the indicated parameters. Their ratio is the bias b2.
Results for the simulations are presented in Figures 13-15. In Figure 15 we compare the reference simulation with![]() , with simulations with
, with simulations with ![]() (“steeper slope”), or
(“steeper slope”), or ![]() (“less slope”). Note that the function
(“less slope”). Note that the function ![]() varies between ≈1.3 to ≈0.5 in the region of interest. We observe, qualitatively, that the slope of
varies between ≈1.3 to ≈0.5 in the region of interest. We observe, qualitatively, that the slope of ![]() has a larger effect on
has a larger effect on ![]() than the amplitude A. A comparison of the
than the amplitude A. A comparison of the
![]()
Figure 10. Galaxy power spectrum (plus noise visible at large k) in bins of MAGr from SDSS DR14 galaxies with redshift![]() .
.
![]()
Figure 11. Galaxy power spectrum (plus noise visible at large k) in bins of MAGg from SDSS DR14 galaxies with redshift![]() .
.
![]()
Figure 12. Noise subtracted galaxy power spectrum![]() , obtained from Figure 9, compared with
, obtained from Figure 9, compared with ![]() calculated with the indicated parameters. Their ratio is b2.
calculated with the indicated parameters. Their ratio is b2.
![]()
Figure 13. Galaxy power spectrum (plus noise visible at large k) from simulations with three amplitudes A. All other parameters of the simulation are given in Section 5.
simulations in Figure 15 with ![]() from data in Figure 9 favors a power spectrum
from data in Figure 9 favors a power spectrum ![]() “steeper” than in the reference simulation. The reference simulation has parameters of
“steeper” than in the reference simulation. The reference simulation has parameters of ![]() similar to the ones obtained from the fit in Figure 1 which assumes scale invariant b, and
similar to the ones obtained from the fit in Figure 1 which assumes scale invariant b, and ![]() eV. The reference simulation is also similar to the fit “
eV. The reference simulation is also similar to the fit “![]() eV” in Figure 12 (taken from Figure 3 which assumes scale invariant b). A steeper
eV” in Figure 12 (taken from Figure 3 which assumes scale invariant b). A steeper ![]() implies
implies ![]() as shown in Figure 12 by the curve “
as shown in Figure 12 by the curve “![]() eV”, and corresponds to a bias b with positive slope as in Equation (55) below.
eV”, and corresponds to a bias b with positive slope as in Equation (55) below.
7. Luminosity and Mass Distributions of Galaxies
Distributions of MAGr and MAGg from data, and MAG from several simulations are presented in Figure 16 and Figure 17. From these figures it is possible to obtain the “mean” luminosity-to-mass ratios. We note that these figures do not show useful sensitivity to![]() .
.
8. Test of Scale Invariance of the Galaxy Bias b
In this Section we test the scale invariance of the bias b defined in Equation (11). To do so, we count galaxies in an array of ![]() spheres of radii
spheres of radii![]() , and obtain their mean
, and obtain their mean![]() , and their root-mean-square (rms). All spheres have their center at redshift
, and their root-mean-square (rms). All spheres have their center at redshift ![]() to ensure the homogeneity of the galaxy selections. The results for
to ensure the homogeneity of the galaxy selections. The results for![]() , and 256/h Mpc are presented in Table 1. The (rms)2 has a contribution
, and 256/h Mpc are presented in Table 1. The (rms)2 has a contribution ![]() from
from![]() , and a contribution
, and a contribution ![]() from statistical fluctuations:
from statistical fluctuations:
![]() (46)
(46)
We compare ![]() obtained from galaxy counts, with the relative mass fluctuations
obtained from galaxy counts, with the relative mass fluctuations ![]() obtained from Equation (6) and Equation (31). The ratio of these two quantities divided by a correction factor
obtained from Equation (6) and Equation (31). The ratio of these two quantities divided by a correction factor
 [2] is the bias b.
![]()
Figure 16. Distributions of MAGr and MAGg of SDSS DR14 data, and distributions of MAG of several simulations (see definitions in Section 5). The difference between the MAGr or MAGg of data and MAG of simulations determines the “mean” galaxy L/M ratio.
![]()
Figure 17. Same as Figure 16 with additional simulations.
The measured bias b is a function of![]() ,
, ![]() , h and the spectral index n. Results for
, h and the spectral index n. Results for ![]() and
and ![]() are presented in Table 1. The last column is the
are presented in Table 1. The last column is the ![]() of the five b’s of spheres with
of the five b’s of spheres with![]() , assuming these b’s are scale invariant with respect to their weighted average. Additional measurements of
, assuming these b’s are scale invariant with respect to their weighted average. Additional measurements of ![]() are presented in Figure 18. Assuming that b is scale invariant we obtain
are presented in Figure 18. Assuming that b is scale invariant we obtain
![]() (47)
(47)
with minimum ![]() for four degrees of freedom. We have defined
for four degrees of freedom. We have defined![]() , and
, and![]() .
.
In conclusion, the galaxy bias b is scale invariant within the statistical uncertainties of b presented in Table 1, provided ![]() satisfies Equation (47), else scale invariance is broken. Note in Table 1 that the variation of b with scale depends on
satisfies Equation (47), else scale invariance is broken. Note in Table 1 that the variation of b with scale depends on![]() .
.
9. Measurement of Neutrino Masses with the Sachs-Wolfe Effect and σ8
We return to the measurement of neutrino masses. Since the galaxy bias b may be scale dependent, in this Section we exclude measurements of ![]() with galaxies.
with galaxies.
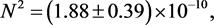
The ΛCDM model is described by Equation (6) that has three free parameters: N2, n, and![]() . We keep n fixed. We vary the two parameters N2 and
. We keep n fixed. We vary the two parameters N2 and ![]() to minimize a
to minimize a ![]() with two terms corresponding to two observables: the Sachs-Wolfe effect (N2 from Equation (41)), and
with two terms corresponding to two observables: the Sachs-Wolfe effect (N2 from Equation (41)), and ![]() given by Equation (33). We therefore have zero degrees of freedom. The result is a function of h,
given by Equation (33). We therefore have zero degrees of freedom. The result is a function of h, ![]() , and the spectral index n, so we define
, and the spectral index n, so we define ![]() [3] ,
[3] , ![]() [7] , and
[7] , and ![]() [3] , and obtain
[3] , and obtain
![]() (48)
(48)
Note that in the “6 parameter ΛCDM fit” [3] , which assumes ![]() eV,
eV,
![]() . Here, and below, the systematic uncertainties are obtained by repeating the fits with the top-hat window function instead of the gaussian window function for
. Here, and below, the systematic uncertainties are obtained by repeating the fits with the top-hat window function instead of the gaussian window function for ![]() (and for
(and for ![]() if applicable), and also with
if applicable), and also with ![]() obtained with the “6 parameter ΛCDM fit” [3] , instead of
obtained with the “6 parameter ΛCDM fit” [3] , instead of ![]() from direct measurements, Equation (33).
from direct measurements, Equation (33).
The fit of Equation (48) is compared with measurements of ![]() obtained from the SDSS-III BOSS survey [4] in Figure 19. It is interesting to note that the discrepancy, i.e. the drop of
obtained from the SDSS-III BOSS survey [4] in Figure 19. It is interesting to note that the discrepancy, i.e. the drop of ![]() in the range
in the range![]() , is also observed in Figure 12.
, is also observed in Figure 12.
For comparison, reference [8] obtains ![]() and
and
![]() (49)
(49)
where![]() , from a study of BAO with SDSS DR13 galaxies. We allow
, from a study of BAO with SDSS DR13 galaxies. We allow ![]() to vary by one standard deviation, i.e.
to vary by one standard deviation, i.e. ![]() [7] . To combine the independent measurements (48) and (49) we add one more term to the
[7] . To combine the independent measurements (48) and (49) we add one more term to the ![]() corresponding to the measurement (49), so we now have one degree of freedom. We obtain
corresponding to the measurement (49), so we now have one degree of freedom. We obtain
![]() (50)
(50)
with ![]() for one degree of freedom, so the two independent measurements of
for one degree of freedom, so the two independent measurements of![]() , Equation (48) and Equation (49), are consistent. Note that the uncertainty of h dominates the uncertainty of
, Equation (48) and Equation (49), are consistent. Note that the uncertainty of h dominates the uncertainty of ![]() in Equation (50).
in Equation (50).
We now free h and add one term to the ![]() corresponding to
corresponding to ![]() [3] , and obtain
[3] , and obtain
![]() (51)
(51)
![]() (52)
(52)
with ![]() for one degree of freedom. The systematic uncertainties in Equation (51) now include
for one degree of freedom. The systematic uncertainties in Equation (51) now include![]() . The 1σ, 2σ, and 3σ contours are presented in Figure 20.
. The 1σ, 2σ, and 3σ contours are presented in Figure 20.
If instead we set ![]() from the direct measurement of the Hubble expansion rate [3] , we obtain
from the direct measurement of the Hubble expansion rate [3] , we obtain
![]() (53)
(53)
![]()
Figure 20. Contours corresponding to 1, 2, and 3 standard deviations in the ![]() plane, from Sachs-Wolfe,
plane, from Sachs-Wolfe, ![]() ,
, ![]() , and BAO measurements. Points on the contours have
, and BAO measurements. Points on the contours have![]() , and 9, respectively, where
, and 9, respectively, where ![]() has been minimized with respect to N2. The total uncertainty of
has been minimized with respect to N2. The total uncertainty of ![]() is dominated by the uncertainty of h. In this figure n = 1, and the systematic uncertainties, presented in Equation (51), are not included.
is dominated by the uncertainty of h. In this figure n = 1, and the systematic uncertainties, presented in Equation (51), are not included.
![]() (54)
(54)
with ![]() for 1 degree of freedom. The corresponding 1σ, 2σ, and 3σ contours are presented in Figure 21. Note that the fitted h does not change significantly.
for 1 degree of freedom. The corresponding 1σ, 2σ, and 3σ contours are presented in Figure 21. Note that the fitted h does not change significantly.
10. Measurement of Neutrino Masses with the Sachs-Wolfe Effect, σ8, and Pgal(k)
We repeat the fit of Figure 3, which includes the “reconstructed” SDSS-III BOSS ![]() measurements [4] , but this time we allow the galaxy bias b to depend on scale:
measurements [4] , but this time we allow the galaxy bias b to depend on scale:![]() . Minimizing the
. Minimizing the ![]() with respect to
with respect to![]() , N2, n,
, N2, n, ![]() ,
, ![]() , and
, and![]() , we obtain
, we obtain
 (55)
(55)
with  for 18 degrees of freedom. The uncertainties have been multiplied by
 . Confidence contours are presented in Figure 22. Fixing
![]()
Figure 22. Contours corresponding to 1, 2, and 3 standard deviations in the ![]() plane, from Sachs-Wolfe,
plane, from Sachs-Wolfe, ![]() ,
, ![]() , and
, and ![]() measurements. Points on the contours have
measurements. Points on the contours have![]() , and 9, respectively, where
, and 9, respectively, where ![]() has been minimized with respect to N2, n,
has been minimized with respect to N2, n, ![]() , and
, and![]() .
.
![]() obtains
obtains![]() , so including the scale dependence of b is necessary.
, so including the scale dependence of b is necessary.
11. Measurement of Neutrino Masses with the Sachs-Wolfe Effect, σ8, and Galaxy Fluctuations
We repeat the measurements of ![]() of Section 9 but add 4 more experimental constraints:
of Section 9 but add 4 more experimental constraints: ![]() of galaxy counts in spheres of radius
of galaxy counts in spheres of radius ![]() , and 128/h Mpc, which are listed in Table 1. Spheres of radius 8/h Mpc were not considered because they have
, and 128/h Mpc, which are listed in Table 1. Spheres of radius 8/h Mpc were not considered because they have![]() . Spheres of radius 256/h Mpc were excluded because there are only 4 spheres of this radius, and the difference between the rms for the top-hat and gaussian window functions turns out to be large (while consistent results are obtained for the other radii). We add two more parameters to be fit:
. Spheres of radius 256/h Mpc were excluded because there are only 4 spheres of this radius, and the difference between the rms for the top-hat and gaussian window functions turns out to be large (while consistent results are obtained for the other radii). We add two more parameters to be fit: ![]() and
and ![]() which define the bias
which define the bias![]() , with
, with ![]() for
for![]() , and 128/h Mpc, respectively. Note that we do not obtain a good fit with fixed bias
, and 128/h Mpc, respectively. Note that we do not obtain a good fit with fixed bias![]() , and so have introduced a “bias slope”
, and so have introduced a “bias slope”![]() .
.
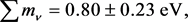
From the Sachs-Wolfe effect, ![]() , and the
, and the ![]() measurements we obtain
measurements we obtain
![]() (56)
(56)
with ![]() for 2 degrees of freedom. The variables that minimize the
for 2 degrees of freedom. The variables that minimize the ![]() are
are![]() ,
, ![]() ,
, ![]() , and
, and![]() . This result may be compared with (48).
. This result may be compared with (48).
Freeing![]() , and keeping
, and keeping ![]() fixed, we obtain
fixed, we obtain
![]()
![]()
![]()
![]()
![]() (57)
(57)
with ![]() for 2 degrees of freedom.
for 2 degrees of freedom.
Combining with the BAO measurement (49) we obtain
![]() (58)
(58)
with ![]() for 3 degrees of freedom. The variables that minimize the
for 3 degrees of freedom. The variables that minimize the ![]() are
are![]() ,
, ![]() ,
, ![]() , and
, and![]() . Freeing
. Freeing![]() , and keeping
, and keeping ![]() fixed, we obtain
fixed, we obtain
![]()
![]()
![]()
![]()
![]() (59)
(59)
with ![]() for 3 degrees of freedom.
for 3 degrees of freedom.
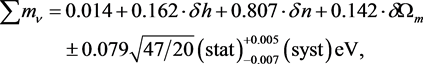
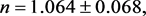
Finally, freeing n, and minimizing the ![]() with respect to
with respect to![]() , N2, n,
, N2, n, ![]() ,
, ![]() , and
, and![]() , we obtain
, we obtain
![]()
![]()
![]()
![]()
![]()
![]() (60)
(60)
with ![]() for 2 degrees of freedom. The parameter correlation coefficients, defined in [3] , are
for 2 degrees of freedom. The parameter correlation coefficients, defined in [3] , are
Note that we have measured the amplitude N2 and spectral index n of![]() , and the bias
, and the bias ![]() including its slope
including its slope ![]() for the SDSS DR14 galaxy selections at redshift z = 0.5. 1, 2, 3, and 4 standard deviation contours are presented in Figure 23.
for the SDSS DR14 galaxy selections at redshift z = 0.5. 1, 2, 3, and 4 standard deviation contours are presented in Figure 23.
![]()
Figure 23. Contours corresponding to 1, 2, 3, and 4 standard deviations in the ![]() plane, from Sachs-Wolfe,
plane, from Sachs-Wolfe, ![]() ,
, ![]() , BAO, and
, BAO, and ![]() measurements. Points on the contours have
measurements. Points on the contours have![]() , and 16, respectively, where
, and 16, respectively, where ![]() has been minimized with respect to N2, n,
has been minimized with respect to N2, n, ![]() , and
, and![]() . The total uncertainty of
. The total uncertainty of ![]() is dominated by the uncertainty of h. In this figure the systematic uncertainties, presented in Equation (60), are not included.
is dominated by the uncertainty of h. In this figure the systematic uncertainties, presented in Equation (60), are not included.
Figure 23 and Equation (60) are our final results.
12. Conclusions
We have studied galaxy distributions with Sloan Digital Sky Survey SDSS DR14 data and with simulations searching for variables that can constrain neutrino masses. Fitting the predictions of the ΛCDM model to the Sachs-Wolfe effect, ![]() ,
, ![]() , fluctuations of galaxy counts in spheres of radii ranging from 16/h to 128/h Mpc, BAO measurements, and
, fluctuations of galaxy counts in spheres of radii ranging from 16/h to 128/h Mpc, BAO measurements, and![]() , in various combinations, with free spectral index n, and free galaxy bias and galaxy bias slope, we obtain consistent measurements of
, in various combinations, with free spectral index n, and free galaxy bias and galaxy bias slope, we obtain consistent measurements of![]() . The uncertainty of
. The uncertainty of ![]() is dominated by the uncertainty of h, so we have presented confidence contours in the
is dominated by the uncertainty of h, so we have presented confidence contours in the ![]() plane.
plane.
Fitting the predictions of the ΛCDM model to the Sachs-Wolfe effect and ![]() we obtain (48). Fitting the predictions of the ΛCDM model to the Sachs-Wolfe effect,
we obtain (48). Fitting the predictions of the ΛCDM model to the Sachs-Wolfe effect, ![]() , and galaxy number fluctuations
, and galaxy number fluctuations ![]() in spheres of radius
in spheres of radius![]() , and 128/h, we obtain (56). These results are consistent with the measurement (49) with BAO. Combining these last two independent measurements we obtain
, and 128/h, we obtain (56). These results are consistent with the measurement (49) with BAO. Combining these last two independent measurements we obtain
![]() (61)
(61)
Note that the uncertainty of ![]() is dominated by the uncertainty of h. A global fit with
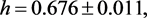
is dominated by the uncertainty of h. A global fit with ![]() obtains
obtains ![]() eV,
eV, ![]() , and the amplitude and spectral index of
, and the amplitude and spectral index of![]() :
:![]() , and
, and![]() . The fit also returns the galaxy bias b including its scale dependence.
. The fit also returns the galaxy bias b including its scale dependence.
Figure 23 and Equation (60) are our final results. These results follow from the data analyzed and the assumptions of the validity of the ΛCDM model and![]() . The measured
. The measured ![]() is anticorrelated with h. All steps in this analysis have been fully described.
is anticorrelated with h. All steps in this analysis have been fully described.
Note added in proof: Let us comment on Equations (49) and (56). Equation (49) is mainly determined by the precise measurement of the sound horizon angle ![]() by the Planck experiment, and by the assumption that the BAO wave stalls at redshift
by the Planck experiment, and by the assumption that the BAO wave stalls at redshift![]() . Equation (49) tells us that
. Equation (49) tells us that ![]() lies on the diagonal shown in Figure 23 (with some uncertainty from
lies on the diagonal shown in Figure 23 (with some uncertainty from![]() ). Equation (56) is a constraint mainly between
). Equation (56) is a constraint mainly between ![]() and n with large uncertainties. To determine
and n with large uncertainties. To determine ![]() we need as input a value for h (or a value for n). In this article we have taken
we need as input a value for h (or a value for n). In this article we have taken ![]() from [3] . If
from [3] . If ![]() we obtain
we obtain ![]() eV, and
eV, and![]() . If however
. If however ![]() we obtain
we obtain ![]() eV, and
eV, and![]() . And if
. And if![]() , we obtain
, we obtain ![]() eV. Alternatively, if we fix
eV. Alternatively, if we fix![]() , then
, then ![]() and
and ![]() eV. Or if we fix
eV. Or if we fix ![]() [3] , then
[3] , then ![]() and
and ![]() eV. At the Guadeloupe 2018 Conference, Adam Riess, representing the SH0ES Team, presented the latest direct measurement of the expansion parameter:
eV. At the Guadeloupe 2018 Conference, Adam Riess, representing the SH0ES Team, presented the latest direct measurement of the expansion parameter:![]() , which corresponds to negative
, which corresponds to negative![]() ! The solution may come from an unexpected direction: gravitational waves from merging black holes are a “standard siren”. The single black hole merger GW170817 already obtains
! The solution may come from an unexpected direction: gravitational waves from merging black holes are a “standard siren”. The single black hole merger GW170817 already obtains![]() , see the talk by Archil Kobakhidze!
, see the talk by Archil Kobakhidze!
Acknowledgements
Funding for the Sloan Digital Sky Survey (SDSS) has been provided by the Alfred P. Sloan Foundation, the Participating Institutions, the National Aeronautics and Space Administration, the National Science Foundation, the U.S. Department of Energy, the Japanese Monbukagakusho, and the Max Planck Society. The SDSS Web site is http://www.sdss.org/.
The SDSS is managed by the Astrophysical Research Consortium (ARC) for the Participating Institutions. The Participating Institutions are The University of Chicago, Fermilab, the Institute for Advanced Study, the Japan Participation Group, The Johns Hopkins University, Los Alamos National Laboratory, the Max-Planck-Institute for Astronomy (MPIA), the Max-Planck-Institute for Astrophysics (MPA), New Mexico State University, University of Pittsburgh, Princeton University, the United States Naval Observatory, and the University of Washington.
Conflicts of Interest
The authors declare no conflicts of interest regarding the publication of this paper.