The Effects of Annealing Process on Dielectric and Piezoelectric Properties of BMT-Base Lead-Free Ceramics ()
1. Introduction
The microstructure of ceramics strongly depends on annealing process and it determines the ceramic’s physical behavior. Density, homogeneity and grains size in the annealing steps are important to achieve the desired electrical properties [1]. Crystal formation and complete perovskite phase are the most important events that occur during annealing. The grain size growth and the optimum electrical properties of the samples are done at this stage. With the rise of annealing temperature, the grain size becomes larger and ceramic to be denser. But if the temperature is too high, it can cause cracks in the sample because of thermal expansion. Then this reduces the density and increases porosity of the ceramic and the resulting reduction in mechanical strength [2]. Barium titanate (BT) can be developed as the first lead-free piezoelectric ceramic with perovskite structure (ABO3) which below the Curie temperature (130˚C) has the tetragonal phase and above the Curie temperature has the cubic phase [3]. Nowadays, the BT-based ceramics such as barium zirconium titanate (BZT) for applications in multi-layer capacitors (MLCs), piezoelectric transducers and electro optic devices are further studied. The BT-based ceramics have a high dielectric constant and a relatively large strain [4-7]. The dielectric constant of capacitors in the multilayer form is higher than that in the disc form [8]. The dielectric constant can be improved significantly by adding metals such as Ag [9] and Ni [10]. BT-based nano- powder has been prepared by a few methods, including coprecipitation, sol-gel process, combustion, hydrothermal method, etc. However, finding an efficient way is a challenge to prepare BT-based nano-powder with particle size in about several nanometers. Therefore, we made an attempt to prepare Mg doping BT by two methods, namely auto combustion method (ACM), and mixed oxide method (MOM) for comparative investigation of their properties. The effect of calcination and sintering temperature on the Ba(Ti1−x, Mgx)O3 lead-free ceramics prepared by two methods were studied. The dielectric, piezoelectric and electrical properties of samples were measured and discussed with respect to the sintering temperature.
2. Experimental Procedure
The nano-powder of 0.94Ba(Mg0.33,Ti0.67)O3-0.06BaTiO3 was synthesized by using salt’s precursors as starting materials. Raw materials used in auto combustion method consist of barium nitrate [Ba(NO3)2], titanium isopropoxide Ti[OCH(CH3)2]4 and magnesium acetate [(CH3COO)2Mg·4H2O]. Aqueous solution of each single cation (i.e. Ba+2, Mg+2 and Ti+4) was prepared by dissolving barium nitrate and magnesium acetate in distilled water and titanium isopropoxide was dissolved in the mixture of nitric acid, citric acid and hydrogen peroxide for preparation of Ti+4. The solutions of barium, magnesium and titanium were added to the aqueous solution of citric acid under continuous stirring at 65˚C - 75˚C and finally at the end the pH of the sol was maintained at 6.5 by the addition of ammonium hydroxide. In order to obtain the gel the peroxo-citrato-nitrate sol of BMT was heated at about 80˚C. After auto combustion of the gels by addition nitric acid as a fuel the resultant powders were calcinated at different temperatures to obtain the desired single-phase powders. BMT nano-powders were produced by the auto combustion technique was labeled as BMT-ACM (obtained from ACM). Raw materials used in mixed oxide method consist of barium nitrate [Ba(NO3)2], magnesium acetate [(CH3COO)2Mg.4H2O] and titanium dioxide [TiO2]. First, for improvement mixed oxides we added the BT and BMT powders together which prepared separately. With using the pure ethanol and stirring them for two hours at room temperature, a homogenous BMT-BT milky precursor was prepared. After drying a white powder was obtained. The heating rate of calcination step powder was 2˚C/min from room temperature to various temperatures ranging from 700˚C to 850˚C for 2 h, and it was labeled as BMTMOM (obtained from MOM). The flow diagram of the samples processing method employed in this study are shown in Figure 1.
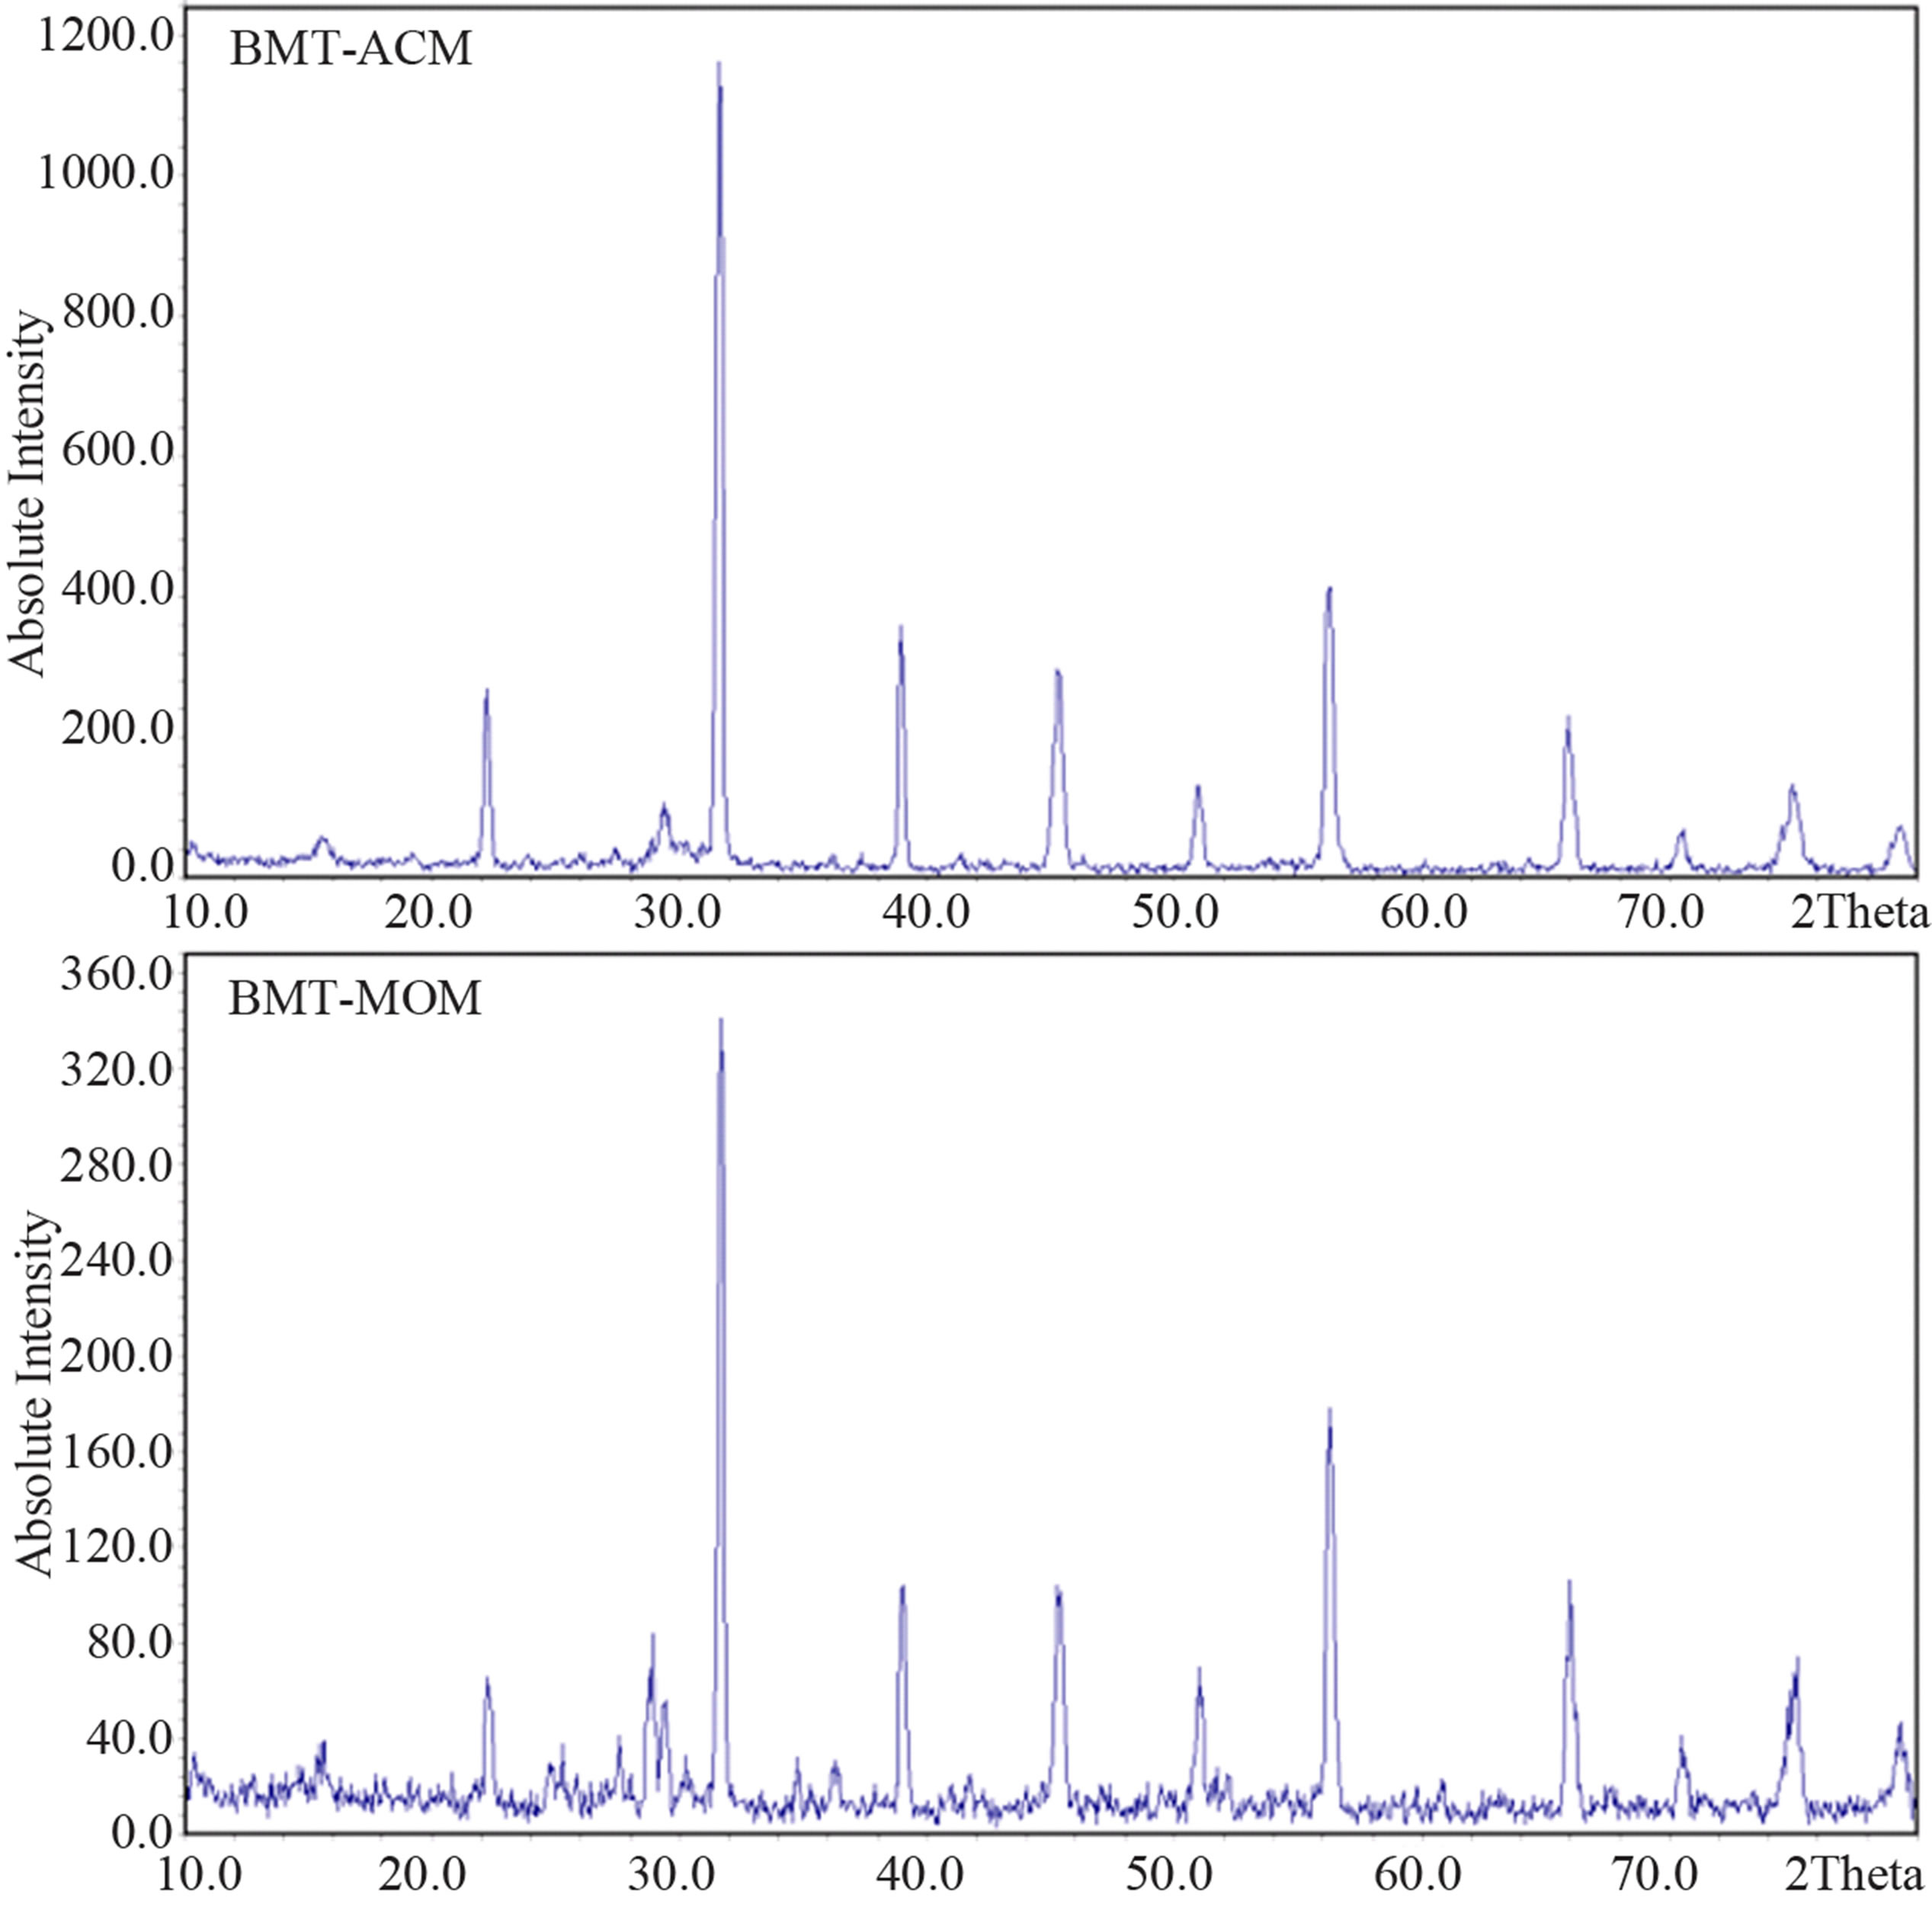
X-ray diffraction patterns used to study the structure of phase and we found that the suitable calcination temperature is 1000˚C. The XRD patterns of BMT powders calcinated at 1000˚C are shows in Figure 2. Pellets made under 3 Mpa pressure after aggregation and shaping of the powders and sintered at different temperatures from 1100˚C to 1250˚C.
3. Results and discussion
3.1. X-Ray Analysis
According to Figure 2, the XRD results reveal the existence of a tetragonal type phase for MOM and ACM method at 1000˚C. According to Figure 3, there is a percentage of the unwanted phase at 900˚C temperature.
As can be seen from Figure 3, the percentage unwanted phase at BMT-MOM is more than BMT-ACM and this result indicates that for synthesis of BMT in nano scale, we require less energy than micro scale. Because the maximum phase purity was obtained only for powder at 1000˚C, this powder was selected as starting powder for electrical measurement. Table 1 shows the X-ray diffraction analysis data.

Figure 1. The flow diagrams of BMT. (a) ACM; (b) MOM.

Figure 2. XRD spectra of samples of the BMT calcinated at 1000˚C temperatures.

Figure 3. XRD spectra of samples of the BMT calcinated at 900˚C.

Table 1. Parameters of X-ray diffraction analysis.
3.2. TEM Image
The typical TEM image of the BMT nano-powder calcinated at temperatures of 1000˚C prepared by the auto combustion method is shown in Figure 4. From TEM analysis the primary particle size of the nano-powders can be determined. The particle size of the BMT-ACM powder was found to be approximately 24 nm in diameter.
3.3. Microstructure Investigation
Figures 5 and 6 show the microstructure and histogram of the BMT-MOM and BMT-ACM lead free ceramics that have been sintered at different temperatures. According to these figures it can be observed that increasing of annealing temperature leads to the grain size increase. For example, at sintering temperature of 1100˚C, the grain size of the BMT-MOM ceramic is about 2.02 µm, when sintering temperature will increase to 1300˚C the grain size grew unusually and reaches the size of about 2.69 µm. The grain size has strong effects on dielectric properties and polarization of piezoelectric materials [11]. The relationships between the grain size and the ceramic dielectric and piezoelectric properties are discussed in the next section.
3.4. Density
Generally, synthesis single phase of Ba(Mg1/3,Ti2/3)O3 ceramic is difficult. However, the synthesis of 0.94Ba (Mg0.33,Ti0.67)O3-0.06BaTiO3 composition is more difficulties and sintering stage becomes much easier. All the compositions were sintered in air at 1100˚C, 1150˚C, 1200˚C and 1250˚C for 2 h and the temperature gradient for annealing were 5˚C/min and 1˚C/min for BMT-MOM and BMT-ACM, respectively. Generally, as shown in Figure 7, density increases with increasing temperature until the density reaches to its maximum at 1200˚C, then at 1250˚C the density decreases. The pattern of the graph may be interpreted according to the sintering model of Coble [12].
3.5. Hysteresis Loop
The hysteresis loop is one of the important characteristics

Figure 4. TEM micrograph of the prepared BMT-ACM powders at 1000˚C.
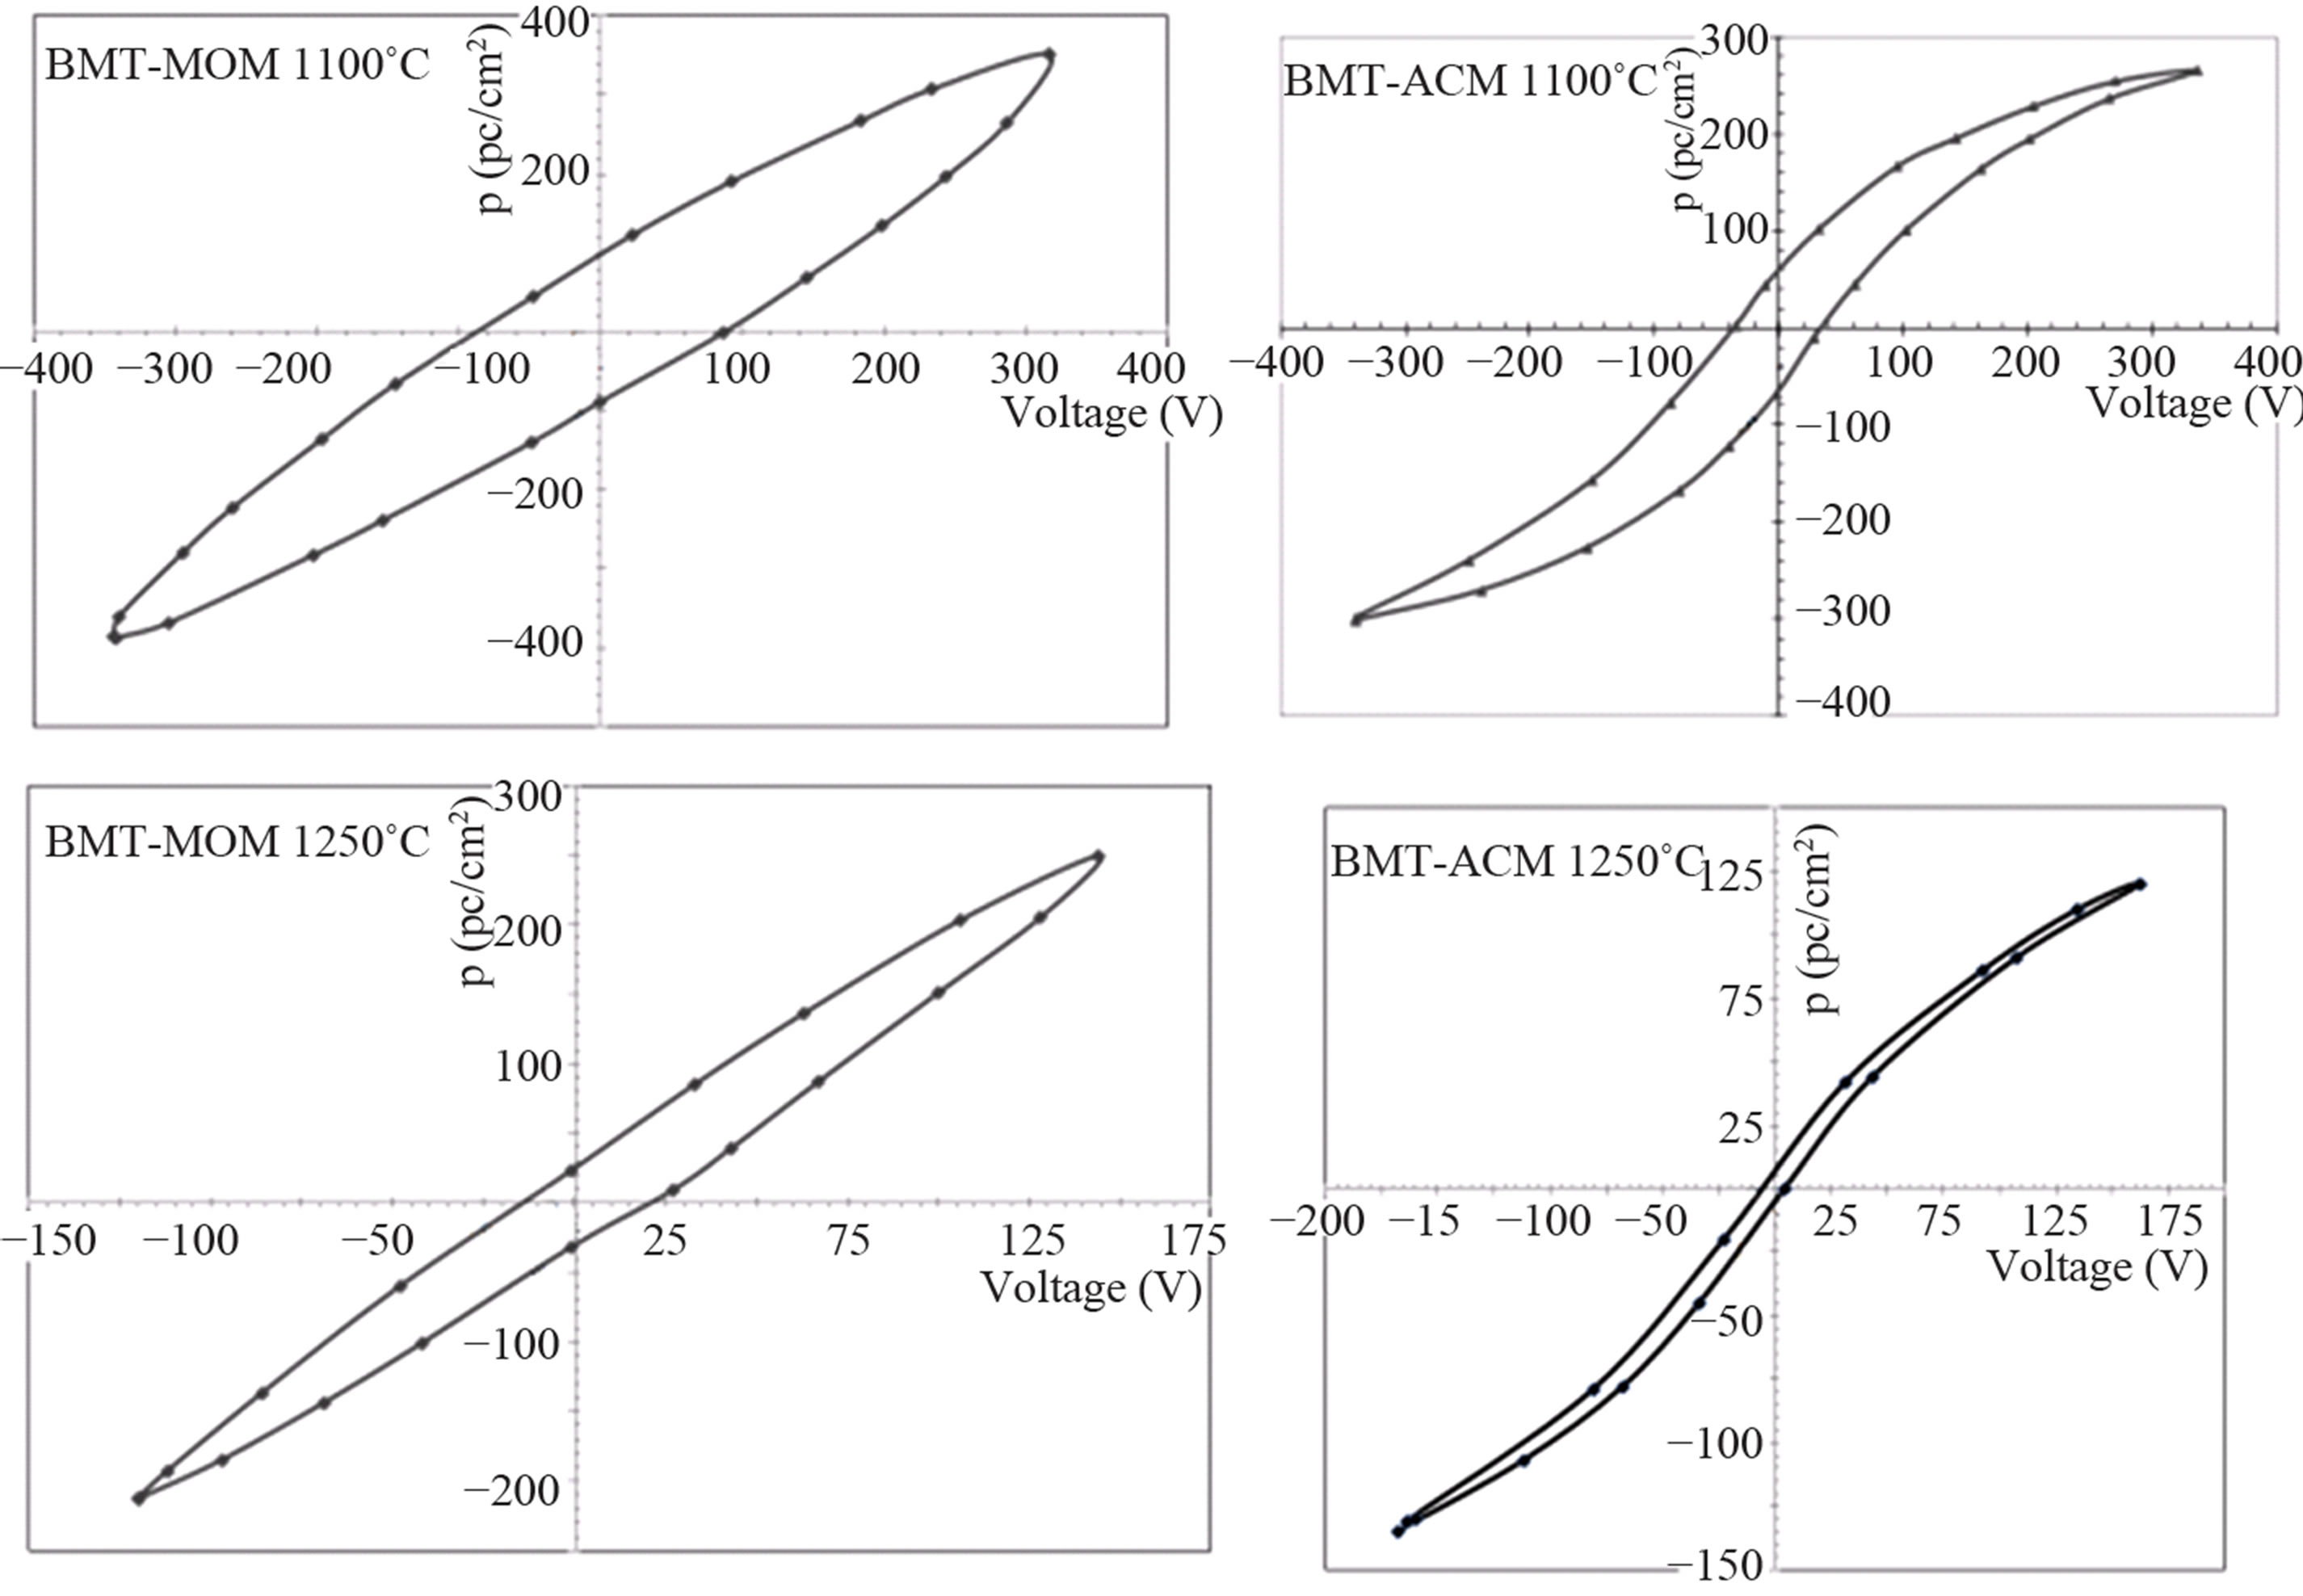
that shows ceramic is considered to be ferroelectric and gives comprehensive information about the polarization. Figure 8 shows the P-E hysteresis loops of the BMT lead free piezoelectric ceramics measured at room temperature. As can be seen in Figure 8, with increasing temperature hysteresis loops are thinner and it reaches to zero at Curie temperature and Pr has a maximum value at 1200˚C. The reason may be the presence of nano-sized domains that have been polarized in the phase boundary polarization are leading a lot of quality [13,14].
3.6. Piezoelectric Constant d33
The piezoelectric coefficient (d33) for two BMT lead-free ceramic at room temperature (Pennebaker, model:8000) are shown in Figure 9. As can be seen from Figure 9, the amount of d33 reached a peak to 87.6 pC/N in 1215˚C, which led to a drop to 72.3 pC/N at 1300˚C. According to Figure 9, the d33 amount of BMT-MOM is more than BMT-ACM in each of the sintering temperatures. This could be due to the insufficient grain growth in the sintering step.
3.7. Dielectric Constant
The polarization is active by thermal processes and thus

Figure 5. SEM graphs of surface of BMT-MOM and BMT-ACM ceramics.

Figure 6. The grain histogram of BMT-MOM and BMT-ACM ceramics.

Figure 7. The density of the BMT-MOM and BMT-ACM ceramics.
the dielectric constant is dependent on temperature. Dielectric constant may be increased or decreased through polarizetion. At Curie temperature the BMT-MOM and BMT-ACM have a very large spontaneous polarization that leads to a large dielectric constant. At below Curie temperature, the structure of samples changes from cubic to tetrahedral and the position of magnesium and titanium ions becomes an off-center position corresponding to a permanent electrical dipole. To the investigation of dielectric properties, the temperature dependence of the dielectric constant for ceramics polarized, were measured at 100 kHz frequency. Figure 10 shows the variation of dielectric constant of the BMT-MOM and BMT-ACM

Figure 8. The P-E hysteresis loops of the BMT-MOM and BMT-ACM ceramics sintered at 1100˚C and 1200˚C.

Figure 9. Piezoelectric coefficient d33 as a function of sintering temperature.

Figure 10. Dielectric constants of BMT-MOM and BMTACM as a function of temperature.
ceramics which sintered at 1200˚C. It was found that the dielectric constants for the BMT-ACM are higher than 750. According to Figure 10, the dielectric constant increases steeply from 412 to 773 by 55˚C and 126˚C, respectively, then its value is reduced to 418 at 180˚C. Moreover, the variations of the dielectric constant through polarize also depend on the domain alignment, and this leads to a rise of dielectric constant.
To the investigation of relaxor properties, the temperature dependence of the dielectric constant for ceramics polarized was measured at different frequencies (100, 500, 1000 kHz).
According to Figure 11, the curve peak with increaseing frequency, has not an outstanding displacement along the vertical axis and this represents which the BMT-BT lead free ceramic is not ferroelectric relaxor. Table 2 listed the electrical parameters of the BMT-MOM and BMT-ACM ceramics that sintered at different temperatures. According to Table 2, the grain size has strong effects on dielectric properties and polarization of piezoelectric materials [15]. On the other hand, all electrical coefficients at optimum temperatures (1200˚C) were increased.
4. Conclusion
The ferroelectric of 0.94Ba(Mg0.33,Ti0.67)O3-0.06BaTiO3 was prepared by the mixed oxide method and auto combustion method using oxide and non-oxide precursor. The powders with maximum tetragonal phase and ceramic’s sample uniform microstructure were obtained at the optimum temperature of 1000˚C and 1200˚C, respec-

Figure 11. Temperature dependence of dielectric constant for BMT-MOM ceramics at different frequencies.

Table 2. Various parameters on some electrical properties.
tively. Electrical property investigations indicated that excellent ferroelectric and piezoelectric properties were obtained at this composition. This result may be due to grain growth. In particular, the BMT ceramics have a relatively high Curie temperature and a better temperature stability of permittivity. Dielectric investigations show that a peculiar relaxor behavior cannot be observed in this system.