ANP impairs the dose-dependent stimulatory effect of ANG II or AVP on H+-ATPase subcellular vesicle trafficking ()
1. INTRODUCTION
The effect of angiotensin II (ANG II) on H+-ATPase activity is controversial. In proximal [1] and distal [2] rat kidney tubules and in intercalated cells of connecting tubule [3], cortical [3,4] and medullary [5] collecting duct ANG II (10−12 - 10−9 M) stimulates H+-ATPase. However, in the rat cortical [6] and outer medullary [7] collecting duct, ANG II (10−10 - 10−5 M) causes a dosedependent decrease in H+-ATPase activity. In addition, our studies in MDCK cells, a permanent cell line originated from the renal collecting duct, indicate that after intracellular pH (pHi) acidification using an NH4Cl pulse, ANG II (10−12, 10−9 or 10−7 M) stimulates H+-ATPase in a dose-dependent manner by increasing the cytosolic free calcium ([Ca2+]i). In agreement with these results, atrial natriuretic peptide (ANP) or dimethyl-BAPTA/AM (BAPTA, chelates intracellular calcium) alone decreases the [Ca2+]i levels but does not affect the H+-ATPase activity; however, these compounds interfere with the pathway responsible for the increase in [Ca2+]i, blocking the stimulatory effect of ANG II on H+-ATPase [8].
The effect of arginine vasopressin (AVP) on H+-ATPase activity is unclear. In an in vivo microperfusion study, we demonstrated that in the late distal tubule of rat kidney, luminal AVP (10−9 M) stimulates H+-ATPase via the activation of V1 receptors [9]. In principal and intercalated cell of rabbit cortical collecting duct, AVP increases cAMP accumulation [10]; however, it has been suggested that in this duct, luminal AVP (10−9 M) impairs electrogenic H+ secretion [11] and in rat medullary thick ascending limb cells, AVP does not affect H+-ATPase directly [12]. In addition, our data with MDCK cells suggest that the increase in [Ca2+]i and cAMP plays a role in regulating the dose-dependent stimulatory effect of AVP on H+-ATPase after pHi acidification, via V1 and V2 receptor mediated pathways; in agreement with these data, ANP or BAPTA inhibits the increase in [Ca2+]i in response to AVP and blocks the stimulatory effect of AVP on H+-ATPase [13].
Moreover, it is known that: 1) acute cellular acidification stimulates exocytosis and elicits a rapid increase in proton secretion that is mediated by an H+-ATPase [14]. 2) an increase in [Ca2+]i might reflect a physiological mechanism to stimulate H+-ATPase-mediated protein export under acidic conditions [15,16]. 3) cAMP stimulates V-ATPase accumulation, microvillar elongation, and proton extrusion in kidney collecting duct A-intercalated cells [17] and 4) vesicle trafficking and exocytosis play a role in the regulation of H+ transport in MDCK cells [18,19].
Based on these findings, in the present study we investigated the effect of ANG II (10−12 and 10−7 M) or AVP (10−12 and 10−6 M) alone or plus ANP (10−6 M) on the subcellular acidic vesicle trafficking in MDCK cells following intracellular acidification using NH4Cl. The experiments were performed in a Na+-free solution containing Schering 28080 (specifically inhibits H+/K+-ATPase), experimental conditions under which H+-ATPase is the only mechanism for pHi recovery in the MDCK cells [13]. To determine if blocking the increase in [Ca2+]i affects the ANG II or AVP stimulatory effect on acidic vesicle trafficking, BAPTA (5 × 10⁻⁵ M) was added to the cells. Additionally, we investigated the interaction of ANG II or AVP plus colchicine (10−5 M, 2-h preincubation; inhibits microtubule-dependent vesicular trafficking [20]) on the acidic vesicle movement. Our data indicate that there is a dose-dependent stimulatory effect of ANG II or AVP on H+-ATPase subcellular vesicle trafficking, which is impaired by ANP or BAPTA. The results suggest a role for the [Ca2+]i in the regulation of these hormonal effects; whether [Ca2+]i is a direct mechanism or is a side effect of other signaling pathways which will require additional studies. Colchicine also abolishes these hormonal effects, suggesting that micro-tubuledependent H+-ATPase vesicular trafficking is involved in the stimulatory effect of ANG II or AVP on the pHi recovery mediated by H+-ATPase and impaired by ANP.
2. MATERIALS AND METHODS
2.1. Cell Culture
We used serial cultures of wild-type MDCK cells (American Type Culture Collection, Rockville, MD) at passage 66 - 75 and exhibiting 320 ohm·cm2 resistance (measured using EVOM, WPI), which is compatible with the cell strain I [21]. The cultures were maintained in Dulbecco’s modified Eagle’s medium (DMEM, Gibco, Grand Island, NY) supplemented with 2 mM glutamine, 10% fetal bovine serum, 100 IU/ml penicillin and 100 mg/ml streptomycin, at 37˚C and in humidified air (5% CO2, pH 7.4) in a CO2 incubator (Lab-Line Instruments, Melrose Park, IL). The cells were harvested using trypsin ethyleneglycol-bis (b-aminoethyl ether)-N, N’-tetraacetic acid (EGTA, 0.02%), seeded on sterile glass coverslips and incubated for 72 h in the DMEM medium until confluent. At the time of the experiment, the mean pHi was 7.16 ± 0.04 (n = 97), measured by the exposure of the cells to 10 mM BCECF-AM in the external solution, which was  -free and at pH 7.4 [22]; therefore, these MDCK cells are subtype C11 [23].
2.2. Acidic Cytoplasmic Vesicle Movement
The cells were loaded with acridine orange 5 mM in control solution (mM: NaCl 145, KCl 5, MgCl2 1, CaCl2 1.8, HEPES 30, Na2SO4 1, NaH2PO4 1, Glucose 10; pH = 7.4) for 30 s [24], and the subcellular acidic cytoplasmic vesicles were visualized at room temperature (22˚C) using a Zeiss LSM 510 confocal microscope (objective 63×) [25]. The preparation was illuminated using an argon laser at 488 nm, and the emission of fluorescence was measured between 515 and 565 nm. A preliminary bleaching control was performed in the cells preincubated with the acridine orange in an Na+-free solution (mM: KCl 5, MgCl2 1, CaCl2 1.8, HEPES 30, Glucose 10, N-methylD-glucamine 145; pH = 7.4) containing Schering 28080 (10−5 M), demonstrating that the fluorescent marker was taken up rapidly by the MDCK cells, concentrated in the cytoplasmic vesicles and not lost during the initial 12 min of the experiment. After acidification of the pHi by exposure to NH4Cl solution (mM: NaCl 125, KCl 5, MgCl2 1, CaCl2 1.8, HEPES 30, Na2SO4 1, NaH2PO4 1, Glucose 10, NH4Cl 20; pH = 8) for 2 min, the rapid acidification of the cells and vesicles was observed, as a result of the NH3 efflux [8]. The acidification was accompanied by quenching of the acridine orange fluorescence. That is, acridine orange (AO) is a weak base that can permeate the vesicle membrane; when the vesicle becomes acidic, AO will enter the vesicle and form AOH+ in the interior, where it accumulates. Therefore, as the vesicle becomes more acidic, the AOH+ level becomes higher, decreasing the fluorescence; however, agents that stimulate the proton pumps make the vesicle less acidic and thus more fluorescent [24,26].
In the present work the H+-ATPase activity was assessed as the rate of increase in fluorescence occurring during the pHi recovery period after acid loading, in a Na+-free solution containing Schering 28080. In the control conditions, it was noted that during the pHi recovery period, the largest concentration of vesicles is around the nucleus and/or at the basolateral side of the cells. However, in presence of ANG II or AVP, as pHi recovery proceeds, the density of vesicles at the apical pole of the cells increases, suggesting their transfer toward this pole (Figures 1(a) and 2(a)).
To detect the movement of the cytoplasmic vesicles inside the cells during the pHi recovery period, the acridine orange fluorescence was measured [27] for a total of 10 min and a z sequence, at stepwise depths of 1.4 mm, was recorded every 82 s. The z sequence started at the apical cell surface (0 mm) and ended at the basolateral surface (9.8 mm). The Figures 1 and 2 demonstrate the sequence of fluorescence images taken over time and
 (a) (b)
Figure 1. Confocal microscopy images of MDCK cells preincubated with acridine orange. Effect of ANG II (10−12 and 10−7 M) or/and ANP (10−6 M) on the movement of acidic vesicles within the cells during the pHi recovery period via H+-ATPase after the acid loading induced by NH4Cl. The vesicular trafficking was followed by measuring the fluorescence density from the basolateral (lower) to the apical (upper) areas. Under the control conditions, during the entire period of pHi recovery the largest concentration of fluorescence was observed at the basolateral side of the cells. In presence of ANG II alone (a), as the pHi recovery progressed, the fluorescence density at the apical pole of the cells increased in a dose-dependent manner, suggesting the transfer of the acidic vesicles toward this pole. With ANP alone or plus ANG II (b), as the pHi recovery proceeded, the largest concentration of fluorescence was observed at the basolateral side of the cells, suggesting that the movement of the vesicles toward the apical pole did not occur. Objective 63×, pinhole 347, fluorescence density (in green).
 (a) (b)
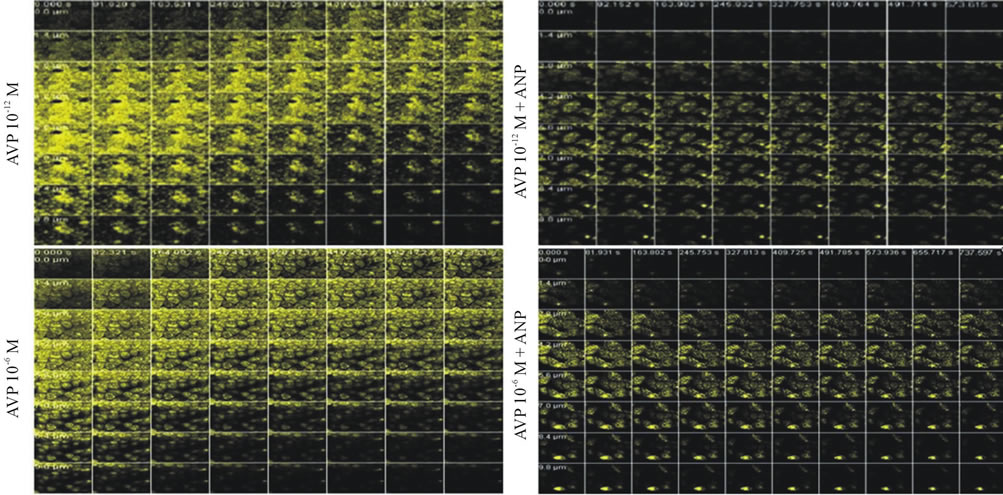
Figure 2. Confocal microscopy images of MDCK cells preincubated with acridine orange. Effect of AVP (10−12 and 10−6 M) or/and ANP (10−6 M) on the movement of acidic vesicles within the cells during the pHi recovery period via H+-ATPase after the acid loading induced by NH4Cl. The vesicular trafficking was followed by measuring the fluorescence density from the basolateral (lower) to the apical (upper) areas. In the presence of AVP alone (a), as the pHi recovery progressed, the fluorescence density at the apical pole of the cells increased in a dose-dependent manner, suggesting the transfer of the acidic vesicles toward this pole. With AVP plus ANP (b), as the pHi recovery proceeded, the largest concentration of fluorescence was not observed at the apical side of the cells, indicating that the movement of the vesicles toward this pole did not occur. Objective 63×, pinhole 347, fluorescence density (in yellow).
indicate the z-axis depth. The images were stored on a CD and were analyzed using the Adobe Photoshop 6.0 image program. The movement of the vesicles was determined in 10 cells by measuring the fluorescence density of the cytoplasm from the basolateral to the apical areas (outside the cell nucleus). This process was quantified by determining the time course of the apical to basolateral cytoplasmic fluorescence density ratio [25]. The experiments were performed under control conditions or in the presence of ANG II (10−12 and 10−7 M) or AVP (10−12 and 10−6 M) and/or ANP (10−6 M), BAPTA (5 × 10⁻⁵ M) or colchicine (10−5 M, 2-h preincubation).
2.3. Solutions and Reagents
The osmolality of the solutions was approximately 300 mOsmol/Kg H2O, which is the osmolality of the culture medium. ANP (28-aminacid) was purchased from Bachem Fine Chemicals (New Haven, CT, USA) and BAPTA was from Molecular Probes (Eugene, OR, USA). The ANG II (1046 molecular weight), AVP (molecular weight 1.084) and all other chemicals were obtained from the Sigma Chemical Company (St. Louis, MO, USA).
2.4. Statistics
The results are presented as the means ± SEM; (n) is the number of experiments. The data were analyzed statistically by analysis of variance followed by Bonferroni’s contrast test. Differences were considered significant if p < 0.05.
The Biomedical Sciences Institute, University of São Paulo, Ethical Committee for Animal Research (CEEA) approved this study.
3. RESULTS
Figure 3 shows the fluorescent cytoplasmic vesicles in an MDCK cell preincubated under the preliminary experimental conditions, i.e., in the Na+-free solution containing Schering 28080 and in the absence of acid loading. The data indicate that acridine orange is taken up rapidly by the cell, concentrates in cytoplasmic vesicles and is not lost during the initial 12 min of the experiment (upper) and that ANG II (10−12 M) increases the number of vesicles that can be detected in the cytoplasm (lower).
Figures 1 and 2 demonstrate the movement of the fluorescent vesicles inside the cells during the pHi recovery period following the NH4Cl loading. As the pHi recovery proceeded, under the control conditions the largest concentration of fluorescence was observed at the basolateral side of the cells over time, and with ANG II (10−12 and 10−7 M) the fluorescence density at the apical pole of the cells exhibited a dose-dependent increase
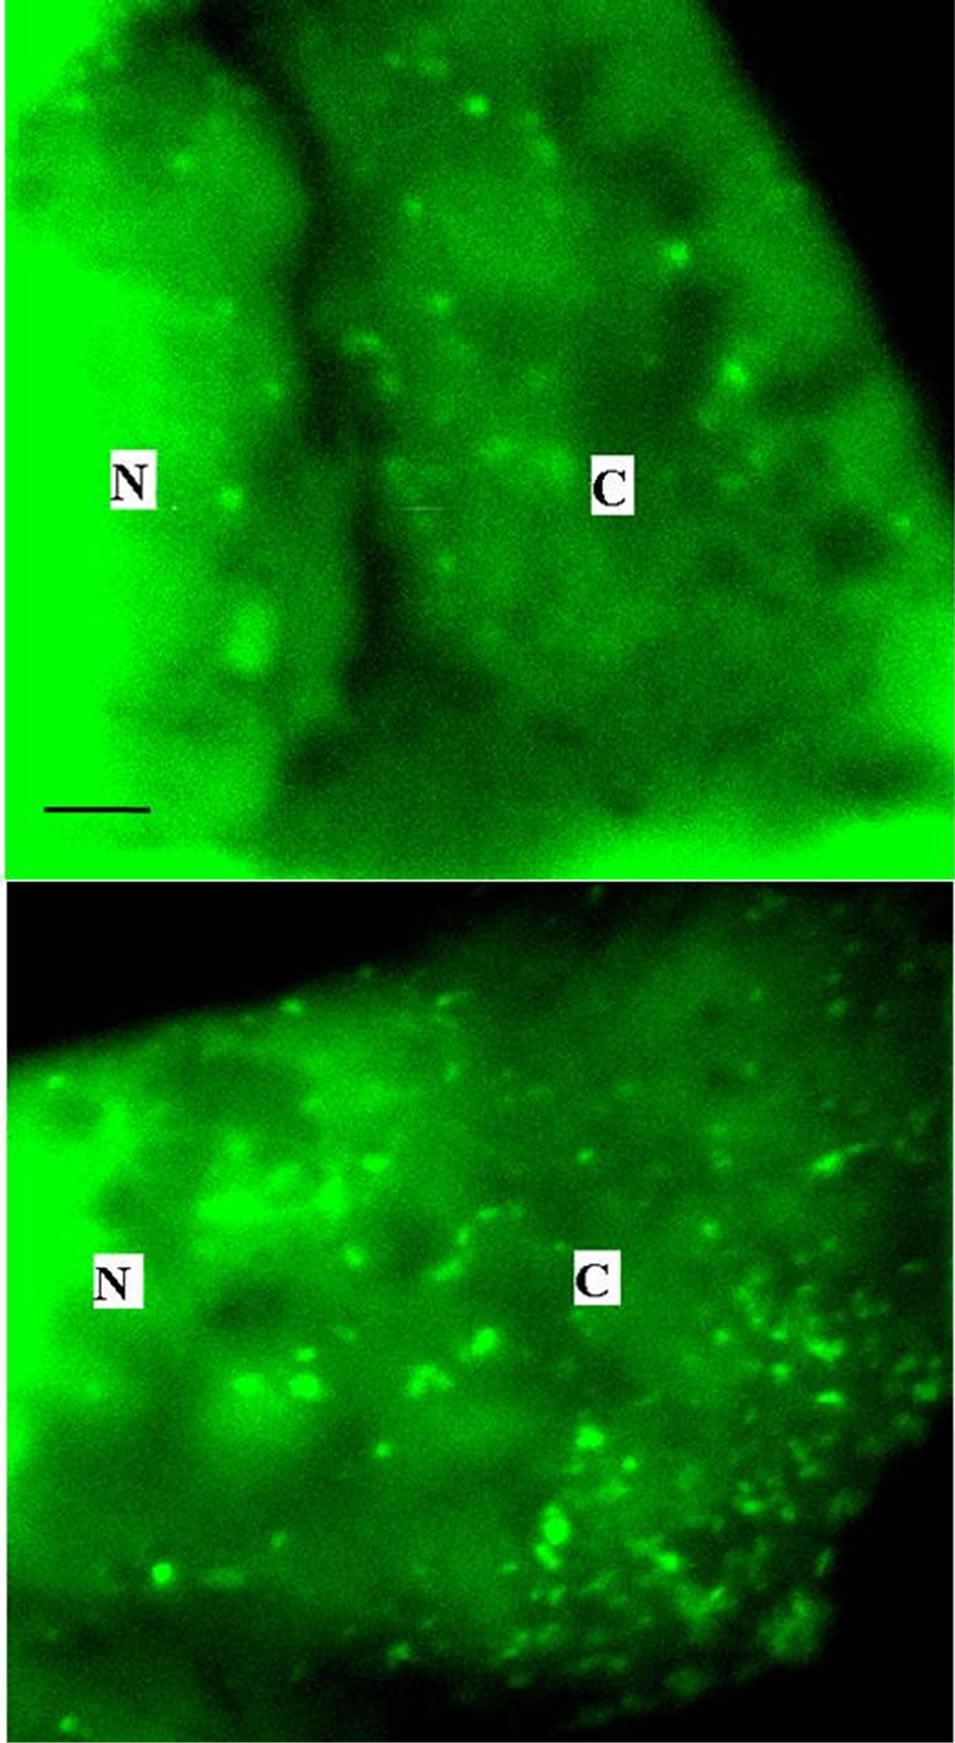
Figure 3. Fluorescent cytoplasmic vesicles in an MDCK cell preincubated with acridine orange in a Na+-free solution containing Schering 28080 in the absence of acid loading, under the control conditions (upper). The presence of ANG II (10−12 M) caused an increase in the number of vesicles that can be detected in the cytosol (lower). N = nuclei. C = cytoplasm. Bar @ 0.5 mm.
with time (Figure 1(a)). However, an increase in the fluorescence density at the apical pole was not observed with ANP alone or in combination with ANG II (10−12 and 10−7 M) (Figure 1(b)). As the pHi recovery proceeded in the presence of AVP (10−12 and 10−6 M) the fluorescence density at the apical pole of the cells exhibited a dose-dependent increase with time (Figure 2(a)); nevertheless, it did not increase in the presence of AVP (10−12 and 10−6 M) plus ANP (Figure 2(b)).
In addition, the results also indicate that, similar to what occurs with ANP, in the presence of BAPTA or colchicine alone or plus ANG II or AVP, as the pHi recovery proceeded, the largest concentration of fluorescence was observed at the basolateral side of the cells, suggesting that the movement of the vesicles toward the apical pole was inhibited (Figures not shown).
Figure 4 ((a) upper and (b) upper) shows that, as the pHi recovery proceeded, under the control conditions the apical/basolateral fluorescence density ratio (FDap/ FDbl) remained almost constant over time. Already with ANG II (10−12 and 10−7 M) the FDap/FDbl increased markedly, particularly at 10−7 M ANG II (Figure 4(a) upper); however, in the presence of ANG II (10−7 M) in combination with ANP, BAPTA or colchicine the (FDap/FDbl) demonstrated only minor changes over time (Figure 4(a) lower). In the presence of AVP (10−12 and 10−6 M), the FDap/FDbl exhibited a dose-dependent increase with time (Figure 4(b) upper); nevertheless, with AVP (10−6 M) plus ANP, BAPTA or colchicine the FDap/FDbl did not change significantly with time (Figure 4(b) lower). The mean slopes (changes in FDap/FDbl over time) of the lines shown in Figure 4 were calculated during the first 5.30 min of the pHi recovery period. Table 1 indicates that under the control conditions the mean slope was 0.079 ± 0.0033 min−1 (n = 14), and that it increased significantly in the presence of ANG II, in a dose-dependent manner. However, this increase was not observed with ANP, BAPTA or colchicine alone or in combination with ANG II. Table 1 also demonstrates that in the presence of AVP the mean slopes increased markedly, in a dose-dependent manner. Yet, similar to ANG II, this increase was not observed with AVP plus ANP, BAPTA or colchicine.