Split Addition of Nitrogen-Rich Substrate at Thermophilic and Mesophilic Stages of Composting: Effect on Green House Gases Emission and Quality of Compost ()
1. Introduction
Solid waste management refers to the collection, transfer, treatment, recycling and disposal of solid waste. The various options involved in effective management of waste are source reduction and re-use, composting, recycling, waste combustion and disposal in landfills [1] . The primary purpose of solid waste management is to promote good health, environmental protection, aesthetic, land use and economics associated with improper solid waste management [2] . According to [3] , growth in population aside increasing the quantities of waste generated, has resulted in complexity of the generated wastes due to changing life styles, culture, geographic location. According to [4] , waste generation rate of Ghana at the household level was 0.47 kg/person/day, translating into about 12,710 tonnes of waste per day per then population of 27,043,093. Biodegradable waste generation in Ghana was 0.318 kg/person/day, forming 61% of the solid waste stream [4] and this fraction is increasingly becoming a major source of environmental pollution especially in urban areas [5] . The high biodegradable waste could be attributed to high dependency on agricultural products [6] . The high fraction of biodegradables in the waste stream requires biological treatment option for optimal management of the waste. Composting presents a tactic for coping with high volumes of organic waste in environmentally sound and desirable manners [7] . Composting converts organic materials into a soil-like material with the microorganisms utilizing oxygen and releasing carbon dioxide [8] . Composting helps to optimize nutrient management. Land application of compost may contribute to combat soil organic matter decline and soil erosion [9] . MSW compost due to its heterogeneous materials composition lacks some basic nutrients for plant growth, especially nitrogen [10] . Compost optimization should therefore put emphasis on increasing or maintaining the nitrogen content of compost, and reducing nitrogen losses and greenhouse gas emissions. Several technologies such as the addition of crop residues [11] , the control of aeration rate [12] and the control of pH [13] have been suggested as ways of reducing nitrogen losses and GHGs emission from composting. However, most of these interventions are inadequate to fit easily into small-scale farming systems in developing countries because these practices are expensive. Amendment processes which are not cost effective, retain nitrogen and minimize GHGs emissions from composting are more desirable. Timing and the split addition of nitrogen-rich substrate at mesophilic and thermophilic stages during composting have not been given the needed attention.
To date, the relationship between the timing and optimal mixing rate of N-rich substrate as an additive at mesophilic and thermophilic temperature stages of composting, is yet to be fully understood. Also, GHG emissions from composting municipal solid waste (MSW) are yet to be comprehensively studied. Experiments are therefore needed to link the quality of the matured compost to its GHG emissions and the quality of compost. Hence the need for the present work which seeks to ascertain how the split addition of nitrogen-rich substrate at mesophilic and thermophilic stages of composting municipal solid waste affected greenhouse gas emission and the quality of compost. Split-addition of Nitrogen-rich substrate at mesophilic and thermophilic stages during composting was investigated in this study and its effect on the quality of compost and GHs emissions was assessed.
2. Materials and Methods
2.1. Study Area
The study was conducted in the Ejisu Municipality of the Ashanti Region, Ghana. The Ejisu Municipality lies in the central part of the Ashanti Region occupying a large area of 238 km2 with Ejisu as its district capital. It lies within 1.37 degrees north to 1.54 degrees north and longitude 6.60 degrees west to 6.79 degrees west (Figure 1). The municipality shares boundaries with four districts in the region, Kwabre district to the north-west, Juaben to the north-east, Bosomtwe district to the south-west and Oforikrom to the west. The distance between the capital Ejisu and the regional capital Kumasi is approximately 17 km.
The municipality has bi-modal rainfall pattern. The major rainfall periods begin from March to July. The average annual rainfall for the major season is between 1200 mm - 1500 mm per year. The minor rainfall period begins in September and ends in November with annual rainfall range of 900 mm - 1120 mm. Mean annuals temperatures in the municipal area are lowest in August, around 25˚C and at highest 32˚C in March [14] . The 2010 population and housing census showed that, the population in the Ejisu-Juaben municipality was 143,762 comprising of 68,648 (47.8%) males and 751 (52.2%) females with annual growth rate of 2.5%. The projected population of the current Ejisu municipality for 2022 is 118,048 this reduction in population was as a result of the creation of Juaben Municipality out of the Ejisu-Juaben Municipal Assembly. Agriculture is the main occupation in the municipality; the population of agricultural households according to the 2010 population census was 15,549 and accounted for 47% of the total households.
2.2. Collection and Preparation of Composting Materials
The study area was stratified into three socioeconomic area, high, middle and low income residential areas based on type of building, access to road, type of road and layout of the area [15] . The number of households and houses to select
for the collection of waste was from recommendations on solid waste assessment by [16] [17] and [18] . A waste bin lined with trash bags were supplied to the selected households for the collection of biodegradable household waste generated. The biodegradable waste collected from each of these three straters was mixed to obtain a representative sample. Biodegradable solid waste collected included: vegetables; peelings of cassava, yam and plantain; kitchen leftovers; leaves; among others. Sorting was done and all non-degradable materials such as polythene bags, food wrappers, metals, textiles, etc were separated from the waste. The collected biodegradable solid wastes were cut into smaller pieces using cutlass and mixed with shovelto obtain homogenous mixture. Three composting materials used were; 1) Biodegradable household waste; 2) Pig dung; 3) Goat dung. Five treatments were prepared from these materials for co-composting Table 1. The weights of biodegradable solid waste, goat dung and pig dung used were estimated on fresh weight basis. The goat and pig dung used for composting were obtained from goat pen and pig farms within the municipality. Five main compost formulation were prepared by the combinations; 4:2:1 compost (4 parts of biodegradable solid waste; 80 kg: 2 parts of pig dung; 40 kg: 1 part of goat dung; 20 kg).
![]()
Table 1. Treatment of compost at mesophilic and thermophilic stages.
2.3. The Composting Processes
Addition of different rate of nitrogen-rich substrate (40 kg of goat dung and 20 kg of pig dung) to 80 kg of biodegradable household waste at thermophilic stage was done on the 6th day when the temperature of the compost had increased to 50˚C. Addition at mesophilic stage was done at the initial preparation of the compost (Table 1). The composting materials were heaped and occasionally turned into piles for a composting period of 12 weeks. Monitoring data; temperature, moisture and pH were taken frequently. Temperature was measured using an industrial thermometer placed at the centre of the compost pile for 4 minutes. Readings were taken between 11:30 am to 12:30 pm daily for the period of composting. The ambient temperature was also measured by leaving the thermometer in air for five minutes at each reading time. Moisture content and pH of the compost pile were by direct measurement of weight loss and glass electrode meter measurement, respectively. The pile was watered with 10L water once every month to soften the substrate and facilitate degradation process. In addition, the pile was turned after every month (during pile watering) to ensure homogenous mixture of the compost. To ensure accuracy, each compost treatment was replicated three times.
2.4. Physicochemical and Biological Analysis of the Matured Compost
Representative samples of each compost were taken dried at room temperature and grounded to pass through a 1mm sieve and was used for laboratory analysis. Total macro nutrients (N, P, K, Ca and Mg), total organic carbon, heavy metals (Cu, Zn, Cr, Pb, Ni and Hg), polyphenol and lignin content, were analyzed. The biological analysis involved identification of fungi and bacteria.
Kjeldahl method was used for the determination of nitrogen [19] . The Gallenkamp flame analyser was used for potassium determination while phosphorus was determined from the standard curve [19] . Calcium and magnesium were estimated using the treatments sample solution containing the calcium and magnesium ions which reacted with an excess of ethylene diaminetetraacetic acid (EDTA) procedure as reported by [20] . The metals were determined from theatomic adsorption spectrophotometer [21] . Polyphenol content was by the Folin-Denis method while Lignin content was determined by acid detergent fiber method [20] . Faecal coliforms were determined from the most probable number (MPM) as reported by [22] . Bacteria and fungi were cultured at 37˚C for 24 hours for growth to occur, the colony forming units were counted using Quebec colony counter and the procedure repeated using cassava dextrose agar as a medium for fungi determination as reported by [23] .
2.5. Toxicity Test of Matured Compost
A 20 g compost sample was weighed into a 100 ml plastic beaker. To this, 50 ml distilled water was added from a measuring cylinder, stirred and allowed to stand for 30 minutes and filtered. A 10 ml portion of the compost filtrate was poured into petri dishes lined with whatman paper No.1 filter papers. Petri dishes containing 10 mls distilled water without filtrate was included as a control treatment. Maize seeds (20) were put in each petri dish, covered, labeled and kept in a dark place at room temperature for seven days. Each treatment was set up in a triplicate. Germination index as proposed by [24] was calculated as follows:
2.6. Measurement of Emissions of GHGs
The anaerobic composting method was used for the process. All the composting formulations as in the windrow composting pile were repeated (Table 1) in an airtight polythene bag. An infrared biogas 5000 analyzer was carefully inserted into the pile to measure CH4, CO2, N2O gas weekly (Figure 2). To ensure accuracy, each gas measurement from compost treatments were replicated three times.
![]()
Figure 2. GHGs emissions measurements using the Infrared Gas Analyzer.
2.7. Statistical Analysis
GenStat software was used to run one-way analysis of variance for comparisons of all treatments at 5% significant level. TUKEY TEST was used to show exactly which treatments showed differences and exactly where the differences occurred. All graphs were drawn with Microsoft Excel.
3. Results and Discussion
3.1. Initial Characteristics of Composting Materials
Chemical properties of the three composting materials are presented in Table 2. Household waste had the highest C:N ratio while pig manure had the highest value of moisture, organic carbon, total nitrogen, phosphorus, calcium and magnesium. The chemical properties of the goat manure were generally between the pig manure (high) and household waste (low), except for Total potassium which was highest in the goat manure. Pig manure is therefore a suitable nitrogen-rich substrate for improvement of household waste. There were significant differences among the chemical properties of the composting materials at P = 0.05 (Table 2). This implies that combining them would produce varying quality of compost that could meet the nutrient needs of soil for sustainable crop production.
3.2. Chemical Properties of Matured Compost
The analysed matured compost showed significant difference in electrical conductivity (EC) among the treatments except between T1 and T2 (Table 3). This shows that the differences existing from the ratios of the nitrogen-rich substrate has significant influence on the EC of a compost whether added at mesophilic or thermophilic stage. Precipitation of mineral salts and the production of metabolites such as ammonium generate these from the compost, especially the nitrogen-rich substrate [25] . It was observed that all treatments had EC levels above
![]()
Table 2. Chemical properties of compost materials (Mean ± SD).
NB: p = 0.05.
![]()
Table 3. Chemical properties of matured compost.
*Means with same superscript letter in a row are not significant different at 5% probability level (p = 0.05).
the acceptable limit of 4 mS/cm, implying that they might be phytotoxic when used, could inhibit seed germination [26] . However, [27] observed that high EC value in composting may indicate the presence of nutrient.
The difference in macronutrients was generally not significant among the treatments, however, the different ratios of the nitrogen-rich substrate had effect on the nutrients content, except for organic carbon. The variations in N contents among treatments in this study could be explained by the high temperatures, the long duration of the thermophilic phase (Figure 3). Therefore, it can be considered that temperaturevariation and maintenance during composting process directly affect thedegradation process and microbial action on the materials [28] . All NPK values for all treatments were within the acceptable range for quality of compost [29] [30] with T2 having the highest N, P and K, 1.34%, 0.97% and 2.45%, respectively. C:N ratio in all the treatments were below the acceptable limit of 25:1 [30] , with T2 recording the lowest, 14.78 (Table 3). [31] revealed that sound composting reactions can also be expected when C:N ratios are also lower than 25:1. During the composting process, the C:N ratio of the initial feedstock declines. According to [32] , this decline occurs because each time organic compounds are consumed by micro-organisms, two-thirds of the carbon is given off as carbon dioxide. Thestudy is also in agreement with [33] who reported that C:N ratio declined during the composting process because organic carbon is oxidised and the N mineralized by the micro-organisms. The lignin content decreased in all the treatments at the end of the composting process and this was because of the high temperatures especially in week 2. According to [34] , the optimum temperature for mesophilic and thermophilic fungi involved inlignin degradation ranges from 40˚C - 60˚C. Assessed nutrients (Total Ca and Total Mg) in all treatments were at appreciable levels needed for agriculture application. According to [35] , Magnesium is necessary for chlorophyll production and nitrogen metabolism. [30] indicated that Calcium (Ca) and Magnesium content in a matured should be within 1.5% - 7%.
3.3. Heavy Metal Content
The level of heavy metals determined in each treatment is presented in Table 4. Generally, all the heavy metals in the treatments were lower than the recommended limit by [36] probably due to the use of source separated household waste. There was no significant difference in concentrations of Cu and Hg in all the treatments. The highest observed Cu concentrations was in T4 (15.57 ± 1.8 mg/kg) and that of Hg was in T1 (0.3 ± 0.02 mg/kg).There was a significant difference in Cr concentration among T2 (15.13 ± 2.03), T3 (15.7 ± 2.23) and T4 (17.83 ± 3.69), T5 (17.03 ± 0.6). The highest and lowest levels of Cr were in T4 and T2, respectively. The highest Cd was determined in T4 and was significant different from all other treatments (Table 5). Pb was highest in T5 (19.42 ± 0.98 mg/kg) and lowest in T4 (17.39 ± 2.12 mg/kg). There was significant difference in Pb only between T4 and T5. In the case of Ni, T3 had the highest concentration (16.06 ± 3.33 mg/kg) and a significant difference existed between T3 and T5 as well as T4 and T5. The difference in Zn was significant between T5 and T1, T2, T3 with the highest obtained from T5 (48.3 ± 2.37 mg/kg). Studies have shown that a lower heavy metal serve as essential micro-nutrients, yet they become harmful at higher concentrations [37] .
![]()
Table 4. Heavy metals concentration in the matured compost.
*Means with same superscript letter in a row are not significantly different at 5% probability level (p = 0.05).
![]()
Table 5. Microbial biomass counted in compost.
*Means with same superscript letter in a column are not significant different at 5% probability level (p = 0.05).
3.4. Microorganisms and Their Load
The levels of indicator organisms such as coliform bacteria allow predictions on concentrations of other pathogens because they are simple, safer to detect as well as generally occurring at higher levels [38] . Also they indicate sanitaryquality of composts [39] . All treatments at the end of composting had faecal coliform below 5.0 × 10² MPN/g, which are the recommended fecal coliform densities for compost quality (c).
The microbial biomass in the composted materials showed a higher level of bacteria in treatment, which had N-rich substrates added at the thermophilic stage (T2 and T4). This is due to the short duration of the thermophilic stage after the addition (Table 5). Thus, to ensure efficient pathogen inactivity, maintaining a minimum temperature of 50˚C or greater during the composting period is recommended.
Fungi have been reported to be an important group and are considered to play a verysignificant role in biodegradation and conversion of complex materials into simpler form during composting. Fungal diversity is reported to utilize many carbon sources of lignocellulosic polymers and are mainly responsible for compost maturation [40] . Temperature has adverse effect on the growth of fungi, as they are eliminated by higher temperature and recover during the maturation phase when the temperature is moderate. Fungi were highest under the same N-rich substrate added at both mesophilic and thermophilic stages (T3) and showed significant difference between T1, T3, T4 and T5 (Table 5). Most fungi are mesophilic tolerating an optimum temperature of 25˚C - 45˚C. However, at temperature of 55˚C during the early stages of thermophilic composting, fungal growth is significantly limited [41] . [42] indicated that fungirequire optimum level of nitrogen for their growth as fungi were observed in all treatments after composting. Furthermore, fungi can survive at high temperature as spores and start to increase soon after the decline of thermophilic phase. This study detected low fungi during the initial stages of composting due to dominance of bacteria and had high proliferation soon after thermophilic phase same as has been reported by [43] .
3.5. Temperature Trend during Composting
Temperature is an exothermic process which indicates higher microbial activity resulting in high release of CO2 and degradation of organic matter. Temperature is considered the most significant and easiest indicator of efficiency in composting process affecting decomposition and biological activity, which changes in direct response to heat production [44] . Temperatures were at mesophilic stage at the start of the composting for all treatments, 31.8˚C - 32.7˚C (Figure 3(a)). From week 0 to week 1, all the treatments increased in temperature reaching thermophilic temperatures between 56.5˚C and 64.2˚C during the composting period. The passage into the thermophilic phase for the five treatments could be attributed to the presence of indigenous microorganisms which attack rapidly the readily degradable materials, the high content of available nutrients and the relatively small size of the organic wastes [45] . In week 1, temperature for T1 and T5 were similar and significantly higher than T2, T3, and T4. The higher temperature in T1 and T5 wasdue to the different ratio of the amendment materials (amount of pig manure and Goat manure) added at start of the composting. From week 1 to week 2 of the composting, a slight increase in temperature was observed in T2 and T4 whiles T1, T3, and T5 decreased in temperature. The slight increases could be attributed to the addition of 100% and 80% of the nitrogen-rich substrate to T2 and T4, respectively (thermophilic stage). Thus, thermophilic bacteria were very active and the resulting heat produced at this stage was important in destroying pathogens and weed [46] [47] . All treatments decreased after week 2 of composting. Studies indicate that effective pathogen inactivation occurs when a minimum temperature of 56˚C is manifested at least 15 days of composting. However, the thermophilic temperature time-phase of treatments in the study were relatively shorter due to smaller size of the compost. Size of the pile has effect on duration of the thermophilic phase [48] .
![]()
Figure 3. Temperature (a), pH (b) and moisture content (c) dynamics during composting (errors bars = standard deviation).
The continuous decrease of temperaturecould have resulted from the replacement of the thermophilic microflora by a mesophilic one, which partially degraded existing bio-resistant compounds, essentially cellulose and in the lesser degree lignin [49] . In week 11, temperature of the treatments had reached ambient temperature and decreased further below ambient temperature in week 12. At this stage, low amount of heat was generated and decomposition could no longer take place effectively suggesting that the composting process was near completion.
3.6. pH Trend during Composting
pH of all the treatments showed an increasing trend from week 0 to week 4 (Figure 3(b)). Thisconfirmed what was reported by [50] that pH levels increase during the first few weeks of composting due to the reduction of volatile acids and further combination with ammonium gas released during denaturing of protein. After week 4, T2, T3 and T4 decreased slightly whiles T1 and T5 increased slightly from week 4 to week 5. The decrease in pH was due to the large portion of the nitrogen substrates (100%, 50% and 80%) added at the thermophilic stage to T2, T3 and T4, respectively which is similar to observations made by [51] . There were further drops in pH generally after week 9 up to the end of the composting period due to the action of acid-producing bacteria that breaks down complex organic materials (biodegradation of polycarbohydrates by Krebs cycle) to organic acid intermediates [52] . Also, the rise in pH during composting can be due to therelease of CO2 by organic matter degradation and ammonification/mineralization oforganic nitrogen [39] [53] . At the end of the composting period, pH values for all the treatments were between 7 and 8, which is within the acceptable range for agriculture use [54] .
3.7. Moisture Content (MC) Trend during Composting
Moisture content in a compost blend is an important variable as it provides a medium for transport of dissolved nutrient required for metabolic and physiological activities of microorganisms [55] . According to [56] , moisture content between 50% and 60% by weight provides adequate moisture without limiting aeration. If the moisture content falls below 40%, bacterial activity will slow down and will cease entirely below 15%. The moisture content of the compost piles at the beginning of the process was in the range 41.6% - 41.8% which is acceptable for effective composting.
Generally, MC increased gradually in all treatments from week 0 up to week 3, after which there was a sharp decrease in all the treatments to week 5 week, later increasing in week 6 (Figure 3(c)). The increases observed were as a result of the high quantity of water that was added in those weeks. A slightly decrease in MC was observed in all treatments, from week 7 to week 12. The slight decline in the moisture content at the end of the composting period may be attributed to evaporation and turning [57] . At the end of the composting, MC in the treatments was 38% - 40%.
3.8. Seed Germination Test
Test on the quality of the compost with seed germination, showed that 100% N-rich substrate added at the thermophilic stage (T2) had the highest germination index 82%. It implies that the addition of 100% N-rich substrate especially at the thermophilic phase produced a suitable nutrient compared to adding all the N-rich substrate at the beginning of the composting. According to [58] , composts with GI values, greater than 60% are considered non-phytotoxic. Significant difference existed between T1 (65%) and T2 (82%), T5 (80%) at LSD of 9.10 implying that the 20% N-rich substrate added at thermophilic stage in T5 had a higher influence in conserving nutrient relevant for germination compared to the quantity of N-rich substrates added at the mesophilic stage in T1, T3 (72%) and T5. T4 had germination index of 73%. The lowest germination index was recorded in T1 (65%), which also indicates that compost from this treatment is safe and has no phytotoxic organic compounds. It should be noted that, GI increases with composting time as phytotoxic organic compounds are gradually removed during the composting process [59] , hence, the 12 weeks composting period in this study was enough in reducing these phytotoxic compounds.
3.9. Greenhouse Gas Emissions
3.9.1. Carbon Dioxide (CO2) Emissions
Carbon dioxide ranged between 90 g/kg/day and 116.67 g/kg/day was emitted amongst the five treatments at the beginning of the composting (Figure 4(a), Appendix A1). After the first week, T1 recorded the highest (1066.67 g/kg/day) emission of CO2 and T2 recorded the lowest (633.33 g/kg/day). This was due to the fact that the 100% of the N-rich substrate was added to T2 in week 1 (thermophilic stage) while T1 already had the N-rich substrate added (mesophilic stage addition). In week 2, T2 followed by T4 recorded the highest CO2 emissions since N-rich substrate added decomposed compared to the other treatments that had majority already decomposed. Thermophilic stage effect on treatments (T2, T4 and T3) generally, was higher till week 9 from which the treatments with mesophilic addition of N-rich substrate (T1, T5 and T3) recorded higher emissions than the thermophilic (Appendix A1). Afterwards, all treatments showed a decreasing trend till week 12. The cumulative emissions of CO2 showed that thermophilic stage N-rich substrate addition (T2 and T4) had the highest emission of CO2 (Figure 4(d)). According to [32] , higher total cumulative CO2 emissions indicate a higher microbial activity, biodegradation rate and stabilization. With lower biological action due to deprival of organicmatter, emissions of CO2 were reduced after the 12th week thereby denoting the stability of the compost. [32] reported an 80% contribution of CO2 to total GHG emissions during household waste composting. Higher CO2 emissions indicate a greater stability of the remaining material (i.e. a higher decomposition).
![]()
![]()
![]()
Figure 4. CO2 (a), CH4 (b) and N2O (c) emission during composting and Cumulative CO2 (d), CH4 (e) and N2O (f) emission during composting (Errors bars = standard deviation).
3.9.2. Methane (CH4) Emissions
Methane is generated in anoxic hotspots by methanogenic microbes [60] . Methane generation increased gradually from week 0 to week 2 to 5 g/kg/day before sharply increasing to 30 g/kg/day in week 3 (Figure 4(b)). The sharp increased in methane emission from week 0 to week 2 was due to 100% and 80% addition of n-rich substrate at the start of composting (T1 and T5) which created anaerobic pocket in the pile due to availability of nitrogen for methane causing bacterial. Further more, the sharp increase of methane emission from week 2 to week3 suggests an increased in biodegradation or mineralization due to high bioavailability of nitrogen for optimal activities of methanogenic bacterial responsible for the production of methane. The emission dropped in week 4 and 5 and increased slightly in week 6 followed with a consistent decrease till week 12 (Figure 4(b)). Therefore, at the initial stage of composting, CH4 was in the range of 1.00 - 1.33 g/kg/day for all the treatments (Appendix A2). In week 1, T1 recorded the highest CH4 emissions, 4.67 g/kg/day followed by T3 and the lowest was from T2, 2.67 g/kg/day. It implies that the increased activity of biodegradation has significant effect on CH4 emissions. In week 3 under thermophilic conditions, CH4 emissions increased in the range of about 26 - 31 g/kg/day which was the highest recorded during the 12 weeks of composting (Appendix A2). Generally, N-rich substrate addition at mesophilic stage, treatments T1, T5 and T3 recorded high emissions of CH4 in descending order compared with the thermophilic stage treatments (Figure 4(b), Appendix A2). Generally, it was observed that the split addition increased methane emissions in all treatments, hence, the timing of the addition of the N-rich substrate had only a marginal effect on methane emissions amongst the treatments.
According to [61] , the high CH4emission duringearly additions of the N-rich substrate could be explained by 1) the high quantity of materials which results in more anaerobic pockets within the pile, 2) the presence of high temperatures in conjunction with high available C and N for the methanogens which increases CH4 production, and 3) low methane oxidation due to the similarity between enzymes involved in methane and ammonium oxidation. The cumulative emission of CH4 showed that treatments with N-rich substrate addition at mesophilic stage (T1 and T5) had the highest emissions (Figure 4(e)). This is because high
concentrations obtainedby addition of the N-rich substrates, might have reduced methane oxidation in the thermophilic phase due to the enzymatic similarity between methane and ammonium oxidation [60] .
3.9.3. Nitrous Oxide (N2O) Emissions
N2O is produced during nitrification in aerobic microsites and denitrification in anaerobic microsites [60] . Generally, N2O increased slightly from week 0 to 2 and showed a sharp increase in week 3 and 4 before a gradually decreasing from week 5 (Figure 4(c)). The increases were very significant in week 1 with T5, T1 and T3 showing the highest emission in descending order which was significantly higher compared to T2 and T4 due to the N-rich substrate addition at the thermophilic stage; same trend was repeated in week 3 (Figure 4(c), Appendix A3). It can be confirmed that delaying the addition of N-rich substrate increases the accessibility of inorganic N (
and
) for nitrifying and denitrifying bacteria and accordingly increases N2O production [11] . In week 4, T3 had the highest N2O emissions followed by T2 and T4 which could be due to the thermophilic stage effect (Appendix A3). From week 7, the emission of T3 was generally high to the end of the composting period. A drastic decrease of N2O emissions was observed from week 6 to 7 which could be due to the maturing status of the compost. According to [11] , both nitrifying and denitrifying bacteria are mesophilic, and high temperatures effectively reduce N2O production.
The cumulative N2O emissions showed 50:50 ratio of N-rich substrate addition at mesophilic and thermophilic stage (T3) with the highest emissions (Figure 4(f)). However, there was a higher influence of thermophilic stage addition on the emission of N2O since T2 was the second highest (Figure 4(f)). These cumulative N2O emissions in this study were higher than those in previous studies on composting by [12] . High
and
concentrations in poultry manure may elucidate the high N2O emissions in this study.
3.10. Correlation between Temperature, Moisture and GHGs Emissions
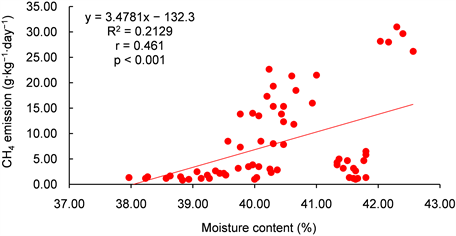
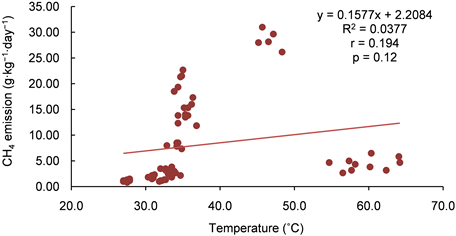
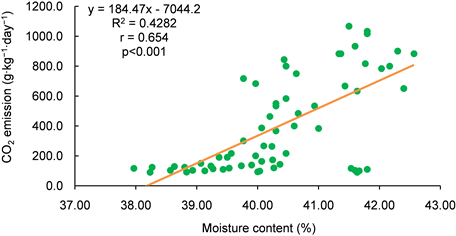
Table 6 present the relationship between temperature, moisture content (MC) and the GHGs (methane, carbon dioxide and nitrous oxide) emissions during the 12 weeks of composting. The correlation between CH4 and MC was less than the minimum acceptable correlation of 0.5. However, it was far higher compared to that of CH4 and temperature which was 0.19. The correlation of CH4 and MC was significant at p < 0.001 and that of CH4 and temperature not significant at p < 0.05 (see Appendix B1 and B2). Correlation between CO2 and temperature and MC were the highest (Table 6). This could be due to the effect of temperature of biodegradable substrate. The linear relationship between temperature, MC and CO2 was significant at p < 0.001 (Appendix B3 and B4). There was no significant association between MC, temperature and N2O (Appendix B5 and B6). However, the relationship between the GHGs shows that increase in any of the GHGs
![]()
Table 6. Pearson correlation between temperature, moisture content and assessed GHGs during composting.
could increase the others during composting (Table 6). The contribution of CH4 was higher than N2O in this study due to the high proportion of easily degradable C, which favours CH4 production.
Gaseous Nitrogen losses and GHG emissions have been reported from thermophilic composting [12] , and these emissions decrease the agronomic value of compost and contribute to climate change. Although CO2 emissions in this study were comparatively greater than N2O, the latter is about 300 times as potent as carbon dioxide at heating the atmosphere [62] . Table 6 indicates the Pearson correlation between temperature, moisture content and assessed GHGs during composting. The larger the absolute value of the coefficient, the stronger the relationship between the variables studied. Results show that there was a positive relationship between all the variables studied. Strong positive linear relationship was observed between CO2 and Temperature (r = 0.8441) indicating that as temperature increases, CO2 emission also increases. Furthermore, strong positive linear relationship was also observed between CH4 and N2O recording a Pearson coefficient value of 0.7586. On the other hand, moderate linear relationships were observed betweenCO2 and CH4, CO2 and N2O, CO2 and Moisture, Moisture and CH4, Temperature and Moisture of Pearson coefficient correlation value of 0.5022, 0.0.4383, 0.6913, 0.4614 and 0.6913 respectively (Table 6).Weak linear relationships were observed between Temperatureand CH4, Temperature and N2O, Moisture and N2O of Pearson coefficient correlation values of 0.1943, 0.0165 and 0.2193 respectively.
4. Conclusion
The study was to investigate the effects of split-addition of Nitrogen-rich substrate on the green-house gas emissions during composting and the quality of composts. Five treatments (T1 was full mesophilic, T2 was full thermophilic, T3 was half mesophilic and half thermophilic, T4 was 80% thermophilic, and T5 was 80% mesophilic (Table 1)) consisting of MSW, Pig Manure and Goat manure (feedstock-amendment ratios) were composted over a 12-weeks period at mesophilic (<50˚C) and thermophilic (>50˚C) stages. This study has shown that addition of more nitrogen rich substrate at the thermophilic stage increases the nutrient content better than when added in mesophilic temperature stage. Moreover, the emissions of greenhouse gas (GHG) during composting increases CO2 and CH4 emissions with increased addition of nitrogen-rich substrate at the thermophilic and mesophilic stages respectively All treatmentswere of good quality as their indicator parameters were within the recommended standards and thus, good for agricultural purposes. Split addition of the N-rich substrate to composting materials produced compost that was stable and minimized nutrient loss and GHG emissions. These findings therefore show that split addition of a nitrogen-rich substrate could be an option for increasing the fertilizer value of municipal waste compost. It is important that compost quality is tested for other crops under different agro-ecological conditions as direction for future research avenues.
Appendices
Appendix A: Mean Weekly Records of GHGs Emissions during Composting
Appendix A1: CO2 (g/kg/day) records for the composting period of 12 weeks
NB: T—treatments; W—Weeks.
Appendix A2: CH4 (g/kg/day) records for the composting period of 12 weeks
NB: T—treatments; W—Weeks.
Appendix A3: N2O records for the composting period of 12 weeks
NB: T—treatments; W—Weeks.
Appendix B: Correlations between Temperature, Moisture Content and GHGs Emissions during Composting
Appendix B1: Relationship between moisture content and CH4 emission
Appendix B2: Relationship between temperature and CH4 emission
Appendix B3: Relationship between moisture content and CO2 emission
Appendix B4: Relationship between temperature and CO2 emission
![]()
Appendix B5: Relationship between moisture content and N2O emission
![]()
Appendix B6: Relationship between temperature and N2O emission