Food and Nutrition Sciences
Vol. 3 No. 4 (2012) , Article ID: 18486 , 8 pages DOI:10.4236/fns.2012.34064
Soybean Seed Phenol, Lignin, and Isoflavones Partitioning as Affected by Seed Node Position and Genotype Differences
![]()
Crop Genetics Research Unit, USDA-ARS, Stoneville, USA.
Email: nacer.bellaloui@ars.usda.gov
Received January 5th, 2012; revised February 17th, 2012; accepted February 25th, 2012
Keywords: Boron nutrition; Mineral nutrition; Isoflavones; Lignin; Phenolics
ABSTRACT
Factors controlling the production and partitioning of seed phenolics within soybean are not understood. Understanding these factors may justify selection for higher levels of seed phenolics because of their beneficial impact on human health and soybean defense mechanism against diseases. The objective of this research was to investigate the partitioning of seed phenolics (phenol, lignin, and isoflavones) along the main stem of soybean genotypes. A repeated greenhouse experiment was conducted on different soybean genotypes of different maturity and different stem architecture (determinate and indeterminate). Genotypes were DT 97-4290, maturity group (MG) IV; Stressland, MG IV; Hutcheson, MG V; and Tracy-M, MG VI. Seed were harvested from top and bottom nodes at seed-fill stage (R6) and harvest maturity stage (R8). At R6, seed phenolic compounds (phenol, lignin, and isoflavones daidzein, genistein, and glycitein) were greater in the bottom seed than the top seed. This trend was observed in DT 97-4290, Tracy-M, and Hutcheson, but not in Stressland. Also, this trend was more obvious with daidzein and genistein isoflavones than glycitein. The maximum phenolic compounds were recorded at R8. The higher phenolic compounds concentration in bottom seed than in top seed was accompanied by higher cell wall boron (B) percentage and lower total B in bottom seed. The current research demonstrated that phenolic compounds partitioned differently between the top and bottom seed nodes. This trend cannot be generalized in soybean genotypes unless enough germplasm is tested. The partitioning of higher phenolic compounds concentration along the main stem would allow for single seed selection in the breeding program for higher levels of phenolic compounds and for accurate measurements of seed phenolics in breeding lines. The association of B trend with phenolic compound trend may suggest B involvement in phenolic metabolism, and support the structural role of B. Breeding for higher levels of phenolics, especially isoflavones, would benefit human health, provide higher nutritional value of soy meal, and increase plant disease resistance.
1. Introduction
Soybean seed is a source of food for humans and animals. Soybean seeds contain primary organic and inorganic metabolites such as protein, oil, carbohydrates, minerals [1-4] and secondary metabolites such as alkaloids and phenolics, including lignin and isoflavones [5-7]. Primary metabolites are essential for growth, development, and reproduction, but secondary metabolites such as phenolics are associated with plant defense and survival mechanisms under biotic and abiotic stress environment factors such drought, heat, and diseases [8,9]. Phenolics are natural biochemical compounds synthesized through the shikimate phenylpropanoids flavonoids pathways, producing monomeric and polymeric phenols and polyphenols [10,11]. Phenolics, including phenolic acid, lignin, and isoflavones, have been reported to have significant role in seed mechanical damage resistance and disease resistance [8,12]. For example, it was found that the occurrence and severity of disease depended on environmental factors, which indicates difficulties in selecting accessions for resistance [8]. It was reported that breeding progress is challenged by variable environmental conditions and plant avoidance mechanisms that confound the expression and detection of physiological resistance in field environments [8]. Therefore, the identification of an environmentally stable plant trait associated with resistance to diseases could be useful, facilitating rapid screening for resistant germplasm at the phenotypic and molecular levels [8]. So far, no lignin-degrading enzymes have been reported, which may make lignin a stable trait for defense mechanism. Working with six soybean accessions, it was found that lignin concentration differed among accessions, growth stages, and plant parts [8]. These researchers found that lignin at the internode between the fourth and fifth trifoliate leaves at R3 growth stage correlated best with disease severity in each year, indicating that resistance is related to lignin concentration and that soybean lignin concentration can be used as a biological marker to select for resistance to S. sclerotiorum.
Lignin concentration in soybean was affected by cultural practices, genetics, maturity, and plant part [8,9]. It was found that high plant populations increase lignin concentration in leaves, while wide row spacing increases lignin concentration in stems [13-15]. It was found that differences in stem lignin among soybean cultivars were due to differences in maturity groups [15,16]. High lignin concentration is thought to be associated with disease resistance; thus efforts to breed forage crops for reduced lignin concentration may reduce agronomic performance by weakening stem strength or resistance to pests and pathogens [17,18]. It was reported that lignin is thought to prevent fungal progress by shielding polysaccharide substrates from fungal enzymes, or altering wall components to form an incompatible substrate for fungal enzymes [19], or displaces water, limiting the action of microbes [20] and pathogen enzymes [8].
Soybean seed isoflavones include three aglycones (daidzein, genistein and glycitein), their glycosides, and their corresponding acetyl and malonyl derivatives [21]. Soybean isoflavones have a positive impact on human health, including prevention of chronic diseases, including cancer, heart disease, osteoporosis, and menopausal symptoms [22], and beneficial effects on diabetes and renal diseases [23]. Isoflavones were reported to be influenced by several abiotic and biotic factors such as soil moisture levels [24], pest pressure [25], temperature [26], mineral nutrition [27], light quality [28,29], and location [30,31]. Highest isoflavone concentrations were reported in seed of plants grown in locations with high latitudes (cooler temperatures) when compared to locations with low latitudes (warmer temperatures) [32]. Isoflavones partitioning was previously reported. It was found that isoflavones in plants vary among organs tissues [26,33], and isoflavones were lower in lower and older Aloe hereroensis leaves, containing significantly lower concentrations of the phenolic compounds than the terminal younger leaves [34]. In United States, a study was conducted to investigate the effects of pod position on soybean seed isoflavone concentration and found that isoflavone concentration was lower in seeds from the top nodes and higher in seeds from the bottom parts [35]. It was reported that isoflavone concentrations varied with growth stages of soybean, and showed that isoflavone concentrations were highest in mature bean seed [36].
Under the Early Soybean Production System (ESPS) conditions in the midsouth US, environmental growth conditions are favorable for two major diseases, charcoal rot and Phomopsis. Charcoal rot is associated with drought and high heat [37], and Phomopsis is associated with wet/humid and high temperature growing season [38]. In addition, late harvesting due to early rain in ESPS results in poor seed quality and seed mechanical damage. Since phenolics production and composition, including phenol, lignin, and isoflavones, could be associated with disease resistance and mechanical damage resistance, using phenolics trait for screening for resistant germplasm development could be useful for soybean breeders. Therefore, understanding the partitioning and distribution of phenolics along the main stem of soybean genotypes at different growing stages is crucial. The objective of this research was to investigate the partitioning of phenol, lignin, and isoflavones along the main stem (top and bottom seed) at seed-fill stage (R6) and at harvest maturity stage (R8).
2. Materials and Methods
2.1. Growth Conditions
Two greenhouse experiments were conducted in 2009 during the soybean growing season (March-August) at Delta States Research Center in Stoneville according to previous research [39] with modification. Each experiment was conducted in a separate greenhouse bay. Briefly, four uniform size seedlings at V1 stage were transplanted into each 9.45 L size pot filled with field soil (sandy loam, fine-loamy, mixed thermic Molic Hapludalfs) with pH 6.3, 1.1% organic matter, soil textural fractions of 26% sand, 56% silt, and 18% clay, and an abundant native population of B. japonicum. Soybean plants were irrigated as needed, and soil water potential was kept within field capacity (between −15 to −20 kPa) [3] every other day by monitoring, using Soil Moisture Meter (WaterMark Company, Inc., Wisconsin, USA). The plants were grown under the following conditions: temperature was about 32˚C ± 8˚C during the day and about 20˚C ± 5˚C at night with a photosynthetic photon flux density (PPFD) of about 500 - 2100 µmol·m−2·s−1 as measured by Quantum Meter (Spectrum Technology, Inc., Illinois, USA). The range of light intensity reflects a bright and sunny or cloudy day, respectively. The source of lighting in the greenhouse was a mixture of natural light, standard incandescent bulb light (60 W), and cool white fluorescent bulb light (250 W). Soybean genotypes grown were maturity group (MG) IV DT 97-4290, indeterminate; MG IV Stressland, indeterminate; MG V Hutcheson, determinate; and MG VI Tracy-M, determinate. Selection of genotypes was based on the maturity that soybean growers used in the Midsouth US (MG IV and V), different stem architecture (determinate and indeterminate), and different stress tolerance level (Stressland is adapted to harsh stress environment compared with others).
Total seed phenols, seed coat lignin, and seed isoflavones were measured in top and bottom nodes seed of the main stem. The total number of nodes would be divided into top and bottom. For example, if there were 14 nodes on the main stem, the top 7 nodes would be considered top and the bottom 7 nodes would be considered bottom. If there were 15 nodes, the first top 7 nodes would be considered top and the bottom 8 nodes would be considered bottom. Seed from each genotype were harvested at seed-fill stage (R6) and at harvest maturity stage (R8) and dried at room temperature. Seed were harvested, depending on each genotype R6 and R8 maturity times. Seed were considered mature when 95% of seed pods reached their harvest maturity [40].
2.2. Isoflavones Analysis
Isoflavones were measured in R6 and R8 seeds. Isoflavones were measured according to [41,42] using nearinfrared (NIR) reflectance diode array feed analyzer (Perten, Springfield, IL, USA). Initial calibrations were developed by Perten company and University of Minnesota using Thermo Galactic Grams PLS IQ. The analysis was performed on the basis of percent dry matter.
2.3. Lignin in Seed Coat
Concentration of seed coat lignin in R6 and R8 seed were measured according to [43,44]. Seed from R6 and R8 were immersed in water to soak and seed coat was removed from the cotyledon. The seed coat was dried in an oven for 16 h at 105˚C and placed in a desiccator at room temperature. Then, a weight of 250 mg of dry seed coat was homogenized in 7 mL 50 mM potassium phosphate buffer with a mortar and pestle. The mixture was transferred into a centrifuge tube and the homogenates were centrifuged at 1400 g for 10 minutes. The pellet was washed and centrifugated twice with 7 mL phosphate buffer at pH 7.0; 3X with 7 mL 1% (v/v) Triton X-100 in pH 7.0 buffer; 2X with 7 mL 1 M NaCl in pH 7.0 buffer; 2X with 7 mL distilled water; and 2X with 5mL acetone. The pellet was dried in an oven at 60˚C for 24 h and cooled in a vacuum desiccator. The dry matter was placed in a centrifuge tube containing a reaction mixture of 1.2 mL thioglycolic acid with 6 mL of 2 M HCl. The mixture was heated on hot plate and after the mixture cooled at room temperature, the samples were centrifuged at 1400 g for 5 minutes and the supernatant was discarded. The pellet, containing the complex lignin-thioglycolic acid (LTGA), was washed 3X with 7 mL distilled water and the LTGA extracted by shaking at 30˚C for 18 h in 6 mL of 0.5 M NaOH. After centrifugation at 1400 g for 5 minutes, the supernatant was stored. The pellet was washed again with 3 mL of 0.5 M NaOH and mixed with the supernatant obtained earlier. The combined alkali extracts were acidified with 1.8 mL concentrated HCl. After precipitation obtained at 0˚C for 4 h, LTGA was recovered by centrifugating the mixture at 1400 g for 5 minutes and washing 2X with 7 mL distilled water. The pellet was dried at 60˚C and dissolved in 10 ml 0.5 M NaOH, and the insoluble material was removed by centrifugation. The absorbance of the supernatant was measured at 280 nm with a Beckman Coulter DU 800 spectrophotometer (Fullerton, California). Lignin concentration was expressed as mg LTGA/g dry weight.
2.4. Determination of Total Phenolic Concentration
Total phenolic concentration was measured based on the method of [45] with modification [46] using a FolinCiocalteu assay and gallic acid standard. Briefly, soybean seed at R6 and R8 were ground to powder and 0.5 g were extracted twice with 10 mL acetone/water (50:50, v/v). Then, 200 µL of seed extract and 1 mL of Folin_Ciocalteu reagent were mixed. Then, 1.0 mL 20% Na2CO3 aqueous solution was added, and the final volume was made to 5 ml with distilled water. The mixture was incubated for 90 minutes at room temperature for color development. The concentration of phenol was measured by reading the samples absorbance at 765 nm using a Beckman Coulter DU 800 spectrophotometer (Fullerton, California). The results were expressed as mg GAE per 100 g of sample (mg GAE/100g).
2.5. Boron Determination
Total boron concentration was measured in seed at R6 and R8 according to previous research [47], using the Azomethine-H method [48], and detailed as previously described [3]. Cell wall boron concentration was also measured in R6 and R8 seed according to [49] and detailed as previously described [3].
2.6. Statistical Analysis
Treatments in each experiment were arranged in a split plot design with four replications. Genotype was a main plot, plant growth stage (R6 or R8) was a sub-plot, and position (top or bottom) was a sub-sub-plot. Analysis of variance was performed using Proc GLM of SAS [50]. Means were separated using Fisher’s Least Significant Difference test using 5% as level of significance. Since the two experiments were significantly different in a preliminary analysis (data not shown), as expected, each experiment was analyzed separately.
3. Results and Discussion
At R6, the concentration of seed phenol, lignin, cell wall B, and total isoflavones were higher in bottom seed than top seed (Table 1). The distribution of glycitein did not follow a consistent trend between the top and bottom seed in the genotypes. Total B concentration had the opposite trend to that of the cell wall B. The trend of phenol, lignin, and total B and cell wall B was similar in all genotypes except in Stressland. Similar general trend was also observed in experiment 1 and experiment 2 (Table 1 and Table 2). The concentration of genistein in DT 97-4290 and Tracy-M was higher than daidzein and gly-

Table 1. Experiment 1, the effect of node position (top, T, and bottom, B) on the partitioning of total phenol, lignin, total boron (B), cell wall B, and composition and total isoflavones in seed of soybean genotypes differ in stem architecture and maturities. Seeds were harvested at R6 (seed-fill stage)a.
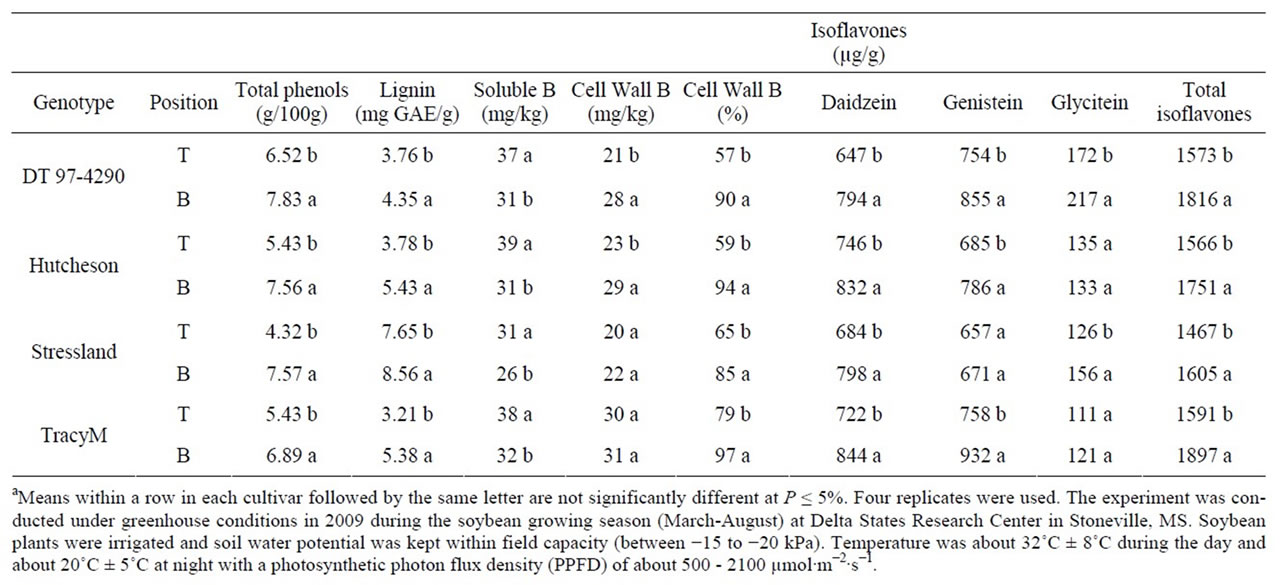
Table 2. Experiment 2, the effect of node position (top, T, and bottom, B) on the partitioning of total phenols, lignin, soluble boron (B), cell wall B, and composition and total isoflavones in seed of soybean genotypes differ in stem architecture and maturities. Seeds were harvested at R6 (seed-fill stage)a.
citein, but this trend was not observed in Hutcheson and Stressland.
At R8, the concentration of phenol, lignin, cell wall B, and isoflavones were higher in bottom than top seed (Table 3 and Table 4). Total B concentration had the opposite trend to that of cell wall B, similar to that at R6. Isoflavone genistein was higher than daidzein and glycitein in DT 97-4290 compared with the other genotypes (Table 3 and Table 4). Genotype DT 97-4290 and Tracy-M had higher concentration of isoflavones than Hutcheson and Stressland. Isoflavone daidzein and genistein were consistently higher in bottom seed than top seed, but isoflavone glycitein was the lowest compared to daidzein and genistein concentrations, and its trend between top and bottom seed was not consistent. Compared with R6, seed from R8 had higher lignin, total B, cell
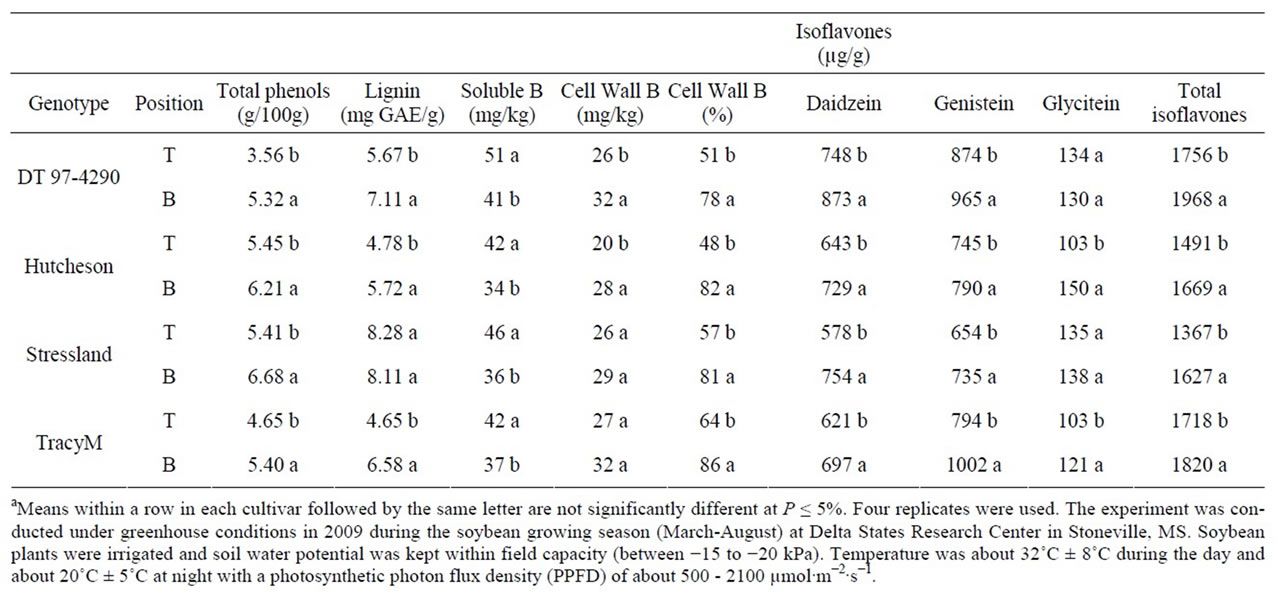
Table 3. Experiment 1, the effect of node position (top, T, and bottom, B) on the partitioning of total phenols, lignin, soluble boron (B), cell wall B, and composition and total isoflavones in seed of soybean genotypes differ in stem architecture and maturities. Seeds were harvested at R8 (harvest maturity)a.

Table 4. Experiment 2, the effect of node position (top, T, and bottom, B) on the partitioning of total phenols, lignin, soluble boron (B), cell wall B, and composition and total isoflavones in seed of soybean genotypes differ in stem architecture and maturities. Seeds were harvested at R8 (harvest maturity)a.
wall B, and total isoflavones concentrations (Tables 1-4). Genotypes accumulated different concentrations of phenolics, total B, and cell wall B at each stage (Tables 1-4).
The greater phenol, lignin, and cell wall B concentrations in bottom seed than in top seed indicated that these seed components partitioned differently between top and bottom pods position on the main stem. The mechanisms behind this trend are not understood but could be associated with shade effects and temperature. Bottom pods are exposed to shade and cooler temperatures compared to top pods. Previous research on protein, oil, and fatty acids partitioning in soybean seed between top, middle, and bottom seed showed that higher protein and oleic acid in the top seed were accompanied by higher nitrogen, boron, and nitrate assimilation in the top canopy compared with the bottom canopy [4,42]. Other researcher studied the effects of pod position on soybean seed isoflavone concentrations and found that isoflavone concentrations were lower in seed from the top nodes than in seed from the bottom nodes [38].
The temperature effects on isoflavones were also indicated by previous research in that the highest isoflavone concentrations were found in seed of plants grown in locations with cooler temperatures when compared to locations with warmer temperatures, and high temperature during soybean seed-fill resulted in a decrease in total isoflavone concentrations by 5% - 50% [32]. Since the trend that lignin and isoflavones were higher in the bottom seed than in top seed was not followed by Stressland genotype, this trend may not be generalized in soybean genotypes unless enough soybean germplasm is tested. Also, this trend may not be generalized for other species where isoflavones were found lower in lower Aloe hereroensis leaves containing lower concentrations of the phenolic compounds [34].
The increase of lignin, total and cell wall B, and isoflavones at R8 than at R6 is supported by previous research in that the maximum total isoflavone concentration was observed at R8 than earlier stages (R6, full-seed pod or R7, yellow pod [26,36]. Therefore, isoflavones in plants may vary among organs tissues [26,33], seed position [35], and growth stages [26,36]. In addition to these previous mentioned factors influencing phenolics, phenolics were found to be influenced by several abiotic and biotic factors such as soil moisture levels [24], pest pressure [25], temperature [26], mineral nutrition [27], and location [30,31]. Understanding the partitioning and distribution of phenolics along the main stem of soybean genotypes under wider array of environments would allow soybean breeders to use single seed selection to create germplasm with higher levels of soybean seed phenolics, desirable seed trait for human nutrition and plant disease resistance.
The opposite trend between total B and cell wall B, and the higher cell wall B in the bottom seed than the top seed supports the suggestion that the more available boron is, the lower cell wall boron percentage would be. This explanation is supported by previous research [49, 51] in that B has mainly structural role by forming Bcomplexes with phenolics and sugars of cis configuration for membrane integrity [52] and cell wall structural support [49].
4. Conclusion
The concentrations of phenolic compounds (lignin and isoflavones) and cell wall boron were higher in bottom seed than in top seed along the main stem of soybean. However, this trend cannot be generalized across all soybean genotypes unless enough germplasm is tested. The maximum concentrations of lignin and isoflavones were found to be at R8 seed and not R6 seed. The higher cell wall concentration of total boron supports that B mainly plays a structural role. Whether boron has a structural and/or metabolic role, remains to be investigated. Understanding the partitioning and distribution of phenolics along the main stem of soybean genotypes under wider array of environments would allow soybean breeders to use single seed selection to create germplasm with higher levels of soybean seed phenolics, desirable seed trait for plant disease resistance and human nutrition.
5. Acknowledgements
The authors are thankful to Sandra Mosley for seed composition analysis. We are also thankful to Debbie Boykin for statistical assistance. This research was funded by United States Department of Agriculture, Agricultural Research Service, project number 6402-21000-034-000.
REFERENCES
- A. Hou, P. Chen, J. Alloatti, D. Li, L. Mozzoni, B. Zhang and A. Shi, “Genetic Variability of Seed Sugar Content in Worldwide Soybean Germplasm Collection,” Crop Science, Vol. 49, No. 3, 2009, pp. 903-912. doi:10.2135/cropsci2008.05.0256
- N. Bellaloui, J. R. Smith, J. D. Ray and A. M. Gillen, “Effect of Maturity on Seed Composition in the Early Soybean Production System as Measured on Near-Isogenic Soybean Lines,” Crop Science, Vol. 49, No. 2, 2009, pp. 608-620. doi:10.2135/cropsci2008.04.0192
- N. Bellaloui, J. R. Smith, A. M. Gillen and J. D. Ray, “Effect of Maturity on Seed Sugars as Measured on NearIsogenic Soybean (Glycine max) Lines,” Crop Science, Vol. 50, No. 5, 2010, pp. 1978-1987. doi:10.2135/cropsci2009.10.0596
- N. Bellaloui, J. R. Smith, A. M. Gillen and J. D. Ray, “Effects of Maturity, Genotypic Background, and Temperature on Seed Mineral Composition in Near-Isogenic Soybean Lines in the Early Soybean Production System,” Crop Science, Vol. 51, No. 3, 2011, pp. 1161-1171. doi:10.2135/cropsci2010.04.0187
- G. Sakthivelu, M. K. A. Devi, P. Giridhar, T. Rajasekaran, G. A. Ravishankar, M. T. Nikolova, G. B. Angelov, R. M. Todorova and G. P. Kosturkova, “Isoflavone Composition, Phenol Content, and Antioxidant Activity of Soybean Seeds from India and Bulgaria,” Journal of Agricultural and Food Chemistry, Vol. 56, No. 6, 2008, pp. 2090-2095. doi:10.1021/jf072939a
- S. M. Potter, J. A. Baum, H. Y. Teng, R. J. Stillman, N. F. Shay and J. W. Erdman, “Soy Protein and Isoflavones: Their Effects on Blood Lipids and Bone Density in Postmenopausal Women,” American Journal of Clinical Nutrition, Vol. 68, 1998, pp.1375s-1379s.
- Wikipedia, Natural Phenol. http://en.wikipedia.org/wiki/Natural_phenol_verified_11-17-2011.
- A. J. Peltier, R. D. Hatfield and C. R. Grau, “Soybean Stem Lignin Concentration Relates to Resistance to Sclerotinia Sclerotiorum,” Plant Diseases, Vol. 93, No. 2, 2009, pp. 149-154. doi:10.1094/PDIS-93-2-0149
- L. A. Rogers and M. M. Campbel, “The Genetic Control of Lignin Deposition during Plant Growth and Development,” New Phytologist, Vol. 164, No. 1, 2004, pp. 17-30. doi:10.1111/j.1469-8137.2004.01143.x
- V. Lattanzio, M. Veronica, T. Lattanzio and A. Cardinali, “Role of Phenolics in the Resistance Mechanisms of Plants against Fungal Pathogens and Insects. Phytochemistry: Advances in Research,” Research Signpost, Kerala, 2006, pp. 23-67.
- A. R. Knaggs, “The Biosynthesis of Shikimate Metabolites,” Natural Product Reports, Vol. 18, No. 3, 2001, pp. 334-355. doi:10.1039/b001717p
- R. A. Dixon, “Isoflavonoids: Biochemistry, Molecular Biology and Biological Functions,” In: U. Sankawa, Ed., Comprehensive Natural Products Chemistry, Elsevier, Amsterdam, 1993, pp. 773-823.
- C. C. Sheaffer, J. H. Orf, T. E. Devine and J. G. Jewell, “Yield and Quality of Forage Soybean,” Agronomy Journal, Vol. 93, No. 1, 2001, pp. 99-106. doi:10.2134/agronj2001.93199x
- S. Seiter, C. E. Altemose and M. H. Davis, “Forage Soybean Yield and Quality Responses to Plant Density and Row Distance,” Agronomy Journal, Vol. 96, No. 4, 2004, pp. 966-970. doi:10.2134/agronj2004.0966
- R. W. Hintz and K. A. Albrecht, “Dry Matter Partitioning and Forage Nutritive Value of Soybean Plant Components,” Agronomy Journal, Vol. 86, No. 1, 1994, pp. 59-62. doi:10.2134/agronj1994.00021962008600010011x
- R. W. Hintz, K. A. Albrecht and E. S. Oplinger, “Yield and Quality of Soybean Forage as Affected by Cultivar and Management Practices,” Agronomy Journal, Vol. 84, No. 5, 1992, pp. 795-798. doi:10.2134/agronj1992.00021962008400050007x
- M. D. Casler, “Breeding Forage Crops for Increased Nutritional Value,” In: D. L. Sparks, Ed., Advances in Agronomy, Academic Press, San Diego, 2001.
- J. R. Wilson, “Review: Cell Wall Characteristics in Relation to Forage Gigestion by Ruminants,” Journal of Agriculture Science, Vol. 122, 1994, pp. 173-182.
- J. P. Ride, “Biochemical Plant Pathology,” John Wiley & Sons, Ltd., Hoboken, 1983, pp. 215-235.
- H. J. G. Jung and D. A. Deetz, “Forage Cell Wall Structure and Digestibility,” ASA, Madison, 1993, pp. 315- 346.
- A. R. M. Al-Tawaha, “Effect of Growth Stage and Pod Position on Soybean Seed Isoflavone Concentration,” Notulae Botanicae Horti Agrobotanici Cluj-Napoca, Vol. 38, 2010, pp. 92-99.
- M. Messina, “Modern Applications for an Ancient Bean: Soybeans and the Prevention and Treatment of Chronic Disease,” Journal of Nutrition, Vol. 125, 1995, pp. 567- 569.
- T. Ranich, S. J. Bhathena and M. T. Velasquez, “Protective Effects of Dietary Phytoestrogens in Chronic Renal Disease,” Journal of Renal Nutrition, Vol. 11, No. 4, 2001, pp. 183-193. doi:10.1016/S1051-2276(01)70036-2
- N. Chaves, J. C. Escudero and C. Gutierrez-Merino, “Role of Ecological Variables in the Seasonal Variation of Flavonoid Content of Cistus ladanifer Exudate,” Journal of Chemical Ecology, Vol. 23, No. 3, 2001, pp. 579-603. doi:10.1023/B:JOEC.0000006398.79306.09
- J. Parr and M. J. C. Rhodes, “Natural Plant Defense Mechanisms,” In: L. G. Copping, Ed., Protection Agents from Nature, Royal Society of Chemistry Education, London, 1996.
- C. Tsukamoto, S. Shimada, K. Igita, S. Kudou, M. Kokubun, K. Okubo and K. Kitamura, “Factors Affecting Isoflavones Content in Soybean Seeds: Changes in Isoflavones, Saponins, and Composition of Fatty Acids at Different Temperatures during Seed Development,” Journal of Agriculture Food Chemistry, Vol. 43, No. 5, 1995, pp. 1184-1192. doi:10.1021/jf00053a012
- S. A. Tiller and A. D. Parry, “Isoflavonoid Conjugates and Their Response to Developmental Change and Abiotic Stress in Alfalfa (Medicago sativa L.),” Acta Horticulture, Vol. 381, 1994, pp. 227-234.
- W. L. Kubasek, B. W. Shirley, A. McKillop, H. M. Goodman, W. Briggs and F. M. Ausubel, “Regulation of Flavonoid Biosynthesis Genes in Germinating Arabidopsis Seedlings,” Plant Cell, Vol. 4, 1992, pp. 1229-1236.
- E. Stapleton, “Ultraviolet Radiation and Plants: Burning Questions,” Plant Cell, Vol. 4, 1992, pp. 1353-1358.
- J. A. Hoeck, W. R. Fehr, P. A. Murphy and G. A. Welke, “Influence of Genotype and Environment on Isoflavone Contents of Soybean,” Crop Science, Vol. 40, No. 1, 2000, pp. 48-51. doi:10.2135/cropsci2000.40148x
- H. Wang and P. A. Murphy, “Isoflavone Composition of American and Japanese Soybeans in Iowa: Effects of Variety, Crop Year, and Location,” Journal of Agriculture and Food Chemistry, Vol. 42, No. 8, 1994, pp. 1674-1677. doi:10.1021/jf00044a017
- M. C. Carrao-Panizzi, A. D. Beleia, K. Kitamura and M. C. N. Oliveira, “Effects of Genetics and Environment on Isoflavone Content of Soybean from Different Regions of Brazil,” Pesquisa Agropecuaria Brasileira, Vol. 34, No. 10, 1999, pp. 1787-1795. doi:10.1590/S0100-204X1999001000004
- U. A. Hartwig, C. A. Maxwell, C. M. Joseph and D. A. Phillips, “Chrysoeriol and Luteolin Released from Alfalfa Seeds Induce Nod Genes in Rhizobium meliloti,” Plant Physiology, Vol. 92, No. 1, 1990, pp. 116-122. doi:10.1104/pp.92.1.116
- E. Chauser-Volfson and Y. Gutterman, “Content and Distribution of the Secondary Phenolic Compound Homonataloin in Aloe hereroensis Leaves According to Leaf Part, Position and Monthly Changes,” Journal of Arid Environments, Vol. 37, No. 1, 1997, pp. 115-122. doi:10.1006/jare.1997.0262
- J. R. Bordignon, S. P. Long and N. J. Engeseth, “Isoflavone Content in Soybean Seeds from Different Parts of Plants Grown Under Elevated Atmospheric CO2 or O3. Nutraceuticals and Functional Foods: Antioxidants and Phytochemical Analysis,” International Food Safety and Quality Conference, Las Vegas, 12-16 July 2004.
- Y. Nakamura, A. Kaihara, K. Yoshii, Y. Tsumura, S. Ishimitsu and Y. Tonogai, “Content and Composition of Isoflavonoids in Mature or Immature Beans and Bean Sprouts Consumed in Japan,” Journal of Health Science, Vol. 47, No. 4, 2001, pp. 394-406. doi:10.1248/jhs.47.394
- G. S. Smith and T. D. Wyllie, “Charcoal Rot,” In: G. L. Hartmann, J. B. Sinclair and J. C. Rupe, Eds., Compendium of Soybean Diseases, The American Phytopathological Society, St. Paul, 1999, pp. 29-31.
- J. R. Smith, A. Mengistu, R. T. Nelson and R. L. Paris, “Identification of Soybean Accessions with High Germinability in High-temperature Environments,” Crop Science, Vol. 48, No. 6, 2008, pp. 2279-2288. doi:10.2135/cropsci2008.01.0026
- N. Bellaloui and A. M. Gillen, “Soybean Seed Protein, Oil, Fatty Acids, N, and S Partitioning as Affected by Node Position and Cultivar Differences,” Agricultural Sciences, Vol. 1, 2010, pp. 110-118. doi:10.4236/as.2010.13014
- W. R. Fehr, C. E. Caviness, D. T. Burmood and J. S. Pennington, “Stage of Development Descriptions for Soybeans, Glycine max (L.) Merrill,” Crop Science, Vol. 11, No. 6, 1971, pp. 929-931. doi:10.2135/cropsci1971.0011183X001100060051x
- M. J. Morrison, E. R. Cober, M. F. Saleem, N. B. McLaughlin, J. Fregeau-Reid, B. L. Ma, W. Yan and L. Woodrow, “Changes in Isoflavone Concentration with 58 Years of Genetic Improvement of Short-Season Soybean Cultivars in Canada,” Crop Science, Vol. 48, No. 6, 2008, pp. 2201-2208. doi:10.2135/cropsci2008.01.0023
- T. Sato, K. Eguchi, T. Hatano and Y. Nishiba, “Use of Near-Infra Red Reflectance Spectroscopy for the Estimation of Isoflavone Contents of Soybean Seeds,” Plant Production Science, Vol. 11, No. 4, 2008, pp. 481-486. doi:10.1626/pps.11.481
- P. J. C. Alvarez, F. C. Krzyzanowski, J. M. G. Mandarino and J. B. Franca-Neto, “Relationship between Soybean Seed Coat Lignin Content and Resistance to Mechanical Damage,” Seed Science and Technology, Vol. 25, 1997, pp. 209-214.
- F. C. Krzyzanowski, J. B. Franca-Neto, J. M. G. Mandarino and M. Kaster, “Comparison between Two Gravimetric Methods to Determine the Lignin Content in Soybean Seed Coat,” Seed Science and Technology, Vol. 29, No. 3, 2001, pp. 619-624.
- V. L. Singleton and J. A. Rossi, “Colorimetry of Total Phenolic with Phosphomolybdic-Phosphotungstic Acid Reagents,” American Journal of Enology and Viticulture, Vol. 16, 1965, pp. 144-158.
- B. J. Xu and S. K. C. Chang, “A Comparative Study on Phenolic Profiles and Antioxidant Activities of Legumes as Affected by Extraction Solvents,” Journal of Food Science, Vol. 72, No. 2, 2007, pp. 159-166. doi:10.1111/j.1750-3841.2006.00260.x
- C. Dordas, G. E. Apostolides and O. Goundra, “Boron Application Affects Seed Yield and Seed Quality of Sugar Beets,” Journal of Agricultural Sciences, Vol. 145, No. 4, 2007, pp. 377-384. doi:10.1017/S0021859607006879
- G. Lohse, “Microanalytical Azomethine-H Method for Boron Determination in Plant Tissue,” Communications in Soil Science and Plant Analysis, Vol. 13, No. 2, 1982, pp. 127-134. doi:10.1080/00103628209367251
- H. Hu and P. H. Brown, “Localization of Boron in Cell Walls of Squash and Tobacco and Its Association with Pectin. Evidence for a Structural Role of Boron in the Cell Wall,” Plant Physiology, Vol. 105, 1994, pp. 681- 689.
- SAS, “SAS 9.1 TS Level 1M3, Windows Version 5.1.2600,” SAS Institute, Cary, 2001.
- N. Bellaloui and P. H. Brown, “Cultivar Differences in Boron Uptake and Distribution in Celery (Apium graveolens), Tomato (Lycopersicon esculentum) and Wheat (Triticum aestivum),” Plant and Soil, Vol. 198, No. 2, 1998, pp. 153-158. doi:10.1023/A:1004343031242
- A. S. Malik, O. Boyko, N. Atkar and W. F. Young, “A Comparative Study of MR Imaging Profile of Titanium Pedicle Screws,” Acta Radiologica, Vol. 42, No. 3, 2001, pp. 291-293. doi:10.1080/028418501127346846