The Influence of Apple- or Red-Grape Pomace Enriched Piglet Diet on Blood Parameters, Bacterial Colonisation, and Marker Gene Expression in Piglet White Blood Cells ()
1. Introduction
Grapes and apples contain a large amount of different phenolic ingredients in skins, pulp and seeds, that are only partially extracted, e.g. during wine making process [1]. Therefore high polyphenol content (up to 80%) remains in the pomaces [2-4] and these feeds may therefore be of value in human and animal nutrition. The main phenolic compounds in grape seed [5] are catechin and epicatechin. The monomeric flavan-3-ols epicatechin and catechin and their oligomeric proanthocyandins B1, B2 and C1 are concentrated in several fruits and berries. They as well present the major flavonoids in grape skins in addition to various anthocyanins [6]. Polyphenols have been shown to reduce certain types of cancer and the incidence of cardiovascular diseases. They increase the plasma antioxidant capacity and are thought to inhibit oxidation of LDL [7]. Polyphenols can reduce the systolic pressure and the level of plasma cholesterol in humans and animals. Further they inhibit platelet aggregation both in-vitro and in animal experiments and may thereby prevent thrombosis [8].
Since January 2006 the European Union laws against prophylactic use of antibiotics in animal feed have come into effect (Regulation 1831/2003/EC). It is generally accepted that the use of antibiotics may potentially result in antibiotic residues in the tissue of treated animals, but in recent years, the greatest concern has been the use of antibiotics to support growth. Long-term use of antibiotics in animal diets may select for resistant bacteria which in turn may transfer resistance to other bacterial species [9,10]. Four mechanisms have been suggested to underlie the effects of antibiotics on animal growth: [1] inhibition of subclinical infections, [2] reduction of growthdepressing microbial metabolites, [3] reduction of microbial use of nutrients, and [4] enhanced uptake of nutrients through a thinner intestinal wall [11-13].
The goal of this approach was to test the influence of two different polyphenol rich feeding regimens (freeze dried appleand red-grape pomace) in young growing piglets. Effects on fecal flora, various blood parameters and mRNA marker gene expression in white blood cells (WBC) were determined after weaning.
2. Material and Methods
2.1. Experiment Setup and Tissue Sampling
Three groups of 12 cross breed piglets [Pietráin x (Deutsche Landrasse x Deutsches Edelschwein)] were fed three different diets. The animals were housed at the experimental station Osterseeon (Bayerische Landesanstalt für Landwirtschaft, Institut für Tierernährung und Futterwirtschaft). Twelve animals were fed a standard weaning diet (CD) (50% wheat, 23% barley, 22% soy, 1% soy oil, 4% vitamins and minerals), whereas the experimental diets contained in addition 3.5% apple pomace (APD) and red-grape pomace (RGPD) respectively on a dry matter basis (Table 1). Energy, protein, fat and starch content were balanced in all three feeding groups. At weaning, piglets were assigned to the three treatments on the basis of age (31 ± 1.8 days), weight (7.5 ± 1.1 kg) and sex (50% male, 50% female). Piglets were weighed at the age of 31 days and at day 50. On the day of weaning (at the age of 31 days) and 19 days later (at the age of 50 days) six piglets per treatment were slaughtered.
Piglets were killed by an electric gripper and exsanguinated. Blood was sampled in tubes containing EDTA during exsanguination. A horizontal incision along the midline was made to open the abdominal cavity, and all the internal organs were excised. Samples of three piglets having received the RGPD diet for 19 days were sampled stomach content, colon content, liver, kidney and ileum for later polyphenol analysis. Samples were frozen at –20˚C until polyphenol extraction. Additional, pure redgrape pomace and piglet starter with red-grape pomace were sampled.
2.2. Sample Preparation
Polyphenol containing samples were lyophilized for four days. One gram dry sample was mixed with 10 ml 100% MetOH and crushed with an Ultra Turrax (Jahnke and Kunkel, IKA, Staufen, Germany). Additionally the piglet starter with red-grape pomace was extracted with water and with HCl (pH 2). The mixture was treated for 30 minutes in an ultrasonic waterbath at 4˚C and centrifugeg for 10 minutes. The supernatant was poured into another cup and frozen at –20˚C until HPLC analyses.
2.3. HPLC Analyses
The HPLC equipment used consists of an autosampler (Gilson-Abimed Modell 231, Langenfeld, Germany), of two pumps (Kontron Modell 422, Eching, Germany), and a diode array detector (Bio Tek Kontron 540 m Eching, Germany). For post column derivatisation a further analytical HPLC pump (Gynkotek Modell 300 C, Germering, Germany) and a VIS-detector (640 nm, Kontron Detektor 432, Eching, Germany) were used. The column (250 × 4 mm I.D., Macherey-Nagel, Düren, Germany) was prepacked with Shandon Hypersil ODS 3 µm. The solvents were 5% acetic acid (A) and methanol (B). Gradient range: 0 - 5 min, isocratic, 5% B in A; 5 - 10 min, 5 - 10% B in A; 10 - 15 min, isocratic, 10% B in A; 15 - 35 min, 10% - 15% B in A; 35 - 55 min, isocratic, 15% B in A; 55 - 70 min, 15% - 20% B in A; 70 - 80 min, isocratic, 20% B in A; 80 - 95 min, 20% - 25% B in A; 95 - 125 min, 25% - 30% B in A; 125 - 145 min, 30% - 40% B in A; 145 - 160 min, 40% - 50% B in A; 160 - 175 min, 50% - 90% B in A, 175 - 195, isocratic, 90% B in A, 195 - 210, 90% - 5% B in A; 210 - 235 min, isocratic, 5% B in A [14]. Phenolic acids and flavonols were detected at 280 nm whereas the flavan 3-ols were measured at 640 nm after post column derivatisation with p-dimethyl-amino- -cinnamic aldehyde (DMACA) [15]. 6-methoxyflavone was used as internal standard for quantitative analyses.
The single compounds were identified in triplicates by retention times and their UV-absorbance spectra via diode array detection and by comparison with standards. These standards were either commercially available from Roth and Sigma (catechin, epicatechin, chlorogenic acid, phloridzin, rutin) or previously isolated from apple and service tree: procyanidins B1, B2, B5, C1, phloretin derivatives, hydroxycinnamic acids, quercetin glycosides

Table 1. Dry matter, protein, fat, fiber, Nfe (N-free extract), ME (metabolisable energy) of three diets in g per kg dry matter. The feeding was according to GFE and “Gruber Futterwerttabelle” (www.lfl.bayern.de/-Tierernährung/schwein).
[14,16,17].
2.4. mRNA Extraction
Blood probes were collected with EDTA (0.2 ml EDTA per 10 ml total blood) for blood cell extraction. For white blood cell separation, 10 ml blood was mixed with 10 ml lysis buffer (0.83 g NH4Cl, 3.7 mg Na-EDTA, 1 g KCl in 100 ml, pH 7.4) and centrifuged for 10 min at 220 g. The cell pellet was suspended in 10 ml lyses puffer and centrifuged again. The white blood cell pellet of the 10 ml blood was then suspended in 100 µl TriFast. Total RNA of these white blood cells was isolated using TriFast (Peqlab, Erlangen, Germany) according to the manufacturer’s instructions. To quantify the extracted RNA concentration, the optical density was determined in triplicates at three different dilutions of the final total RNA preparations at 260 nm. RNA integrity was verified by optical density OD260 nm/OD280 nm absorption ratio > 1.80.
2.5. Real-Time One-Step Quantitative RT-PCR
Relative quantification of mRNA concentration was carried out using a one-step quantitative RT-PCR (qRTPCR) in the ep realplex Cycler (Eppendorf, Hamburg, Germany). To minimize pipetting errors an eight-channel pipetting robot epMotion 5075 (Eppendorf) was used. 25 ng mRNA in 1 µl volume was inserted as RT-PCR template. Further the master-mix components for the qPCR reactions [0.3 µl iScript (Bio-Rad, Munich, Germany), 0.225 µL (20 pmol) of forward and reverse primer (Table 2) synthesized by MWG Biotech (Ebersberg, Germany), 7.5 µl 2x SYBR Green (Bio-Rad) and up to 14 µl water] was assembled by the robot. One–step qRT-PCR was performed with 40 cycles and product-specific annealing temperature, according to the kit manufactures cycle settings. The crossing points (Ct) were acquired with the automatic Ct-method present in the ep realplex analysis software (Eppendorf). Amplification PCR products underwent a melting curve analysis after the last cycle to specify the integrity of amplification. Finally a cooling step was performed.
2.6. Relative mRNA Quantification
A relative quantification was applied, using a panel of physiological and immunological marker genes and Histone H3 as reference gene (Table 2). Single marker gene mRNA expression were normalized by the constant Histon H3 mRNA gene expression over the investigated feeding groups and time points, according to the DDCP method [18,19], described by the following equations:

First the target gene expression Ct was normalized by the reference gene expression Ct (=>DCP). In the second step, the DCP value at day 50 was compared with the DCP value of the control diet treatment at day 31 (CD day 31), which results in the DDCP value. Positive DDCP values represent an mRNA up-regulation and negative DDCP values represent a mRNA down-regulation of the described expressed marker gene at day 50, compared to day 31.
2.7. Hemogramm
A blood cell count including leukocyte differentiation was made at a veterinary laboratory (Vetmed Labor, Ludwigsburg, Germany). Erythrocyte, hematocrit, hemoglobin concentration, hemoglobin concentration per erythrocyte (MCHC), thrombocyte and differential white cell count were determined using the CELL-DYN 3700SL System (Abbott Diagnostika GmbH, Wiesbaden, Germany). Leukocytes were differentiated on blood smears stained with May Grünwald-Giemsa. The percentage of basophilic granulocytes, eosinophilic granulocytes, segmented and non-segmented neutrophilic granulocytes, lymphocytes and monocytes were calculated.
2.8. Bacterial Examination of GIT Flora
Chymus samples were taken from the colon immediately after slaughtering and stored on ice from the first and the last slaughtering group. Total aerobic and anaerobic bacteria were determined and Streptococcus, Lactobaccillus, E. coli and C. perfringens were cultured using selective culture media performed at the Tiergesundheitsdienst Bayern e.V. (Grub, Germany). One gram chymus was mixed with 9 ml PBS (Table 3). This mixture was diluted by the factor 101 to 1010. Of each dilution 0.1 ml was pipetted on an agar plate. Agar plates with 3 to 300 bacteria were counted and the mean was calculated, according to Bollmann [20].
2.9. Statistical Evaluations
For the statistical evaluation of the data Sigma Stat 2.03 [21] was used. Data were compared with two way ANOVA (“diet group” and “time point”). P values less than 0.05 were considered significant (P < 0.05).
3. Results
3.1. Daily Gain and Body Weight
All animals remained healthy during the feeding experiment and no animal losses were registered. Some of the piglets excreted pasty faeces, but none of the pigs got ill or were treated with veterinary drugs. Energy and feed intake and average daily gain did not differ between dietary treatments. At the different slaughter dates the piglets weighed 7.5 ± 1.1 kg (day 31) and 13.2 ± 1.6 kg (day 50). The empty body weight was not affected by the applied diets [22,23].
3.2. Polyphenol Analysis
Figure 1 shows the results from the polyphenol quantification, in the pure red-grape pomace, the RGPD feed, stomach and gut contents, as well as in three selected tissues (ileum, liver, and kidney). The content of the five major and dominant flavanoids are shown in the Figure 1, the monomers catechin and epicatechin, and the procyanidins B1, B2 and C1. All five compounds were recovered and could be quantified in the feed, in stomach and colon content. In ileum, liver and kidney only traces of catechin, B1 and B2 could be detected. The observed polyphenols are more highly concentrated in stomach and gut content, compared to the 3.5% RGPD mixed diet. The extraction with water and with HCl (pH 2), respectively, yielded comparable proportions of the flavonoids, but the total concentrations differ with the applied extraction methods.
3.3. Total RNA and mRNA Expression
Total leukocyte RNA contents showed no significant variations in RNA integrity and quantity between analysed feeding groups. All tested genes were abundant in leukocytes, showed single peaks in melting curve analysis (ep realplex software) and a single band in high-resolution 4% agarose gel electrophoresis (gels not shown). The reference gene Histon H3 mRNA expression remained constant during the entire study and was affected neither by the time (p = 0.770) nor by the diet treatments (p = 0.615). Beside the reference gene, five different marker genes were determined in one-step qRT-PCR: a pro-inflammatory marker (TNFa), a transcription factor (NFkB), an anti-inflammatory marker (IL10), an apop-

Table 2. Sequence of the forward and reverse primers used for one-step qRT-PCR.

Table 3. The media and culture methods for comprehensive investigation of intestinal flora.
totic marker (caspase 3), and a proliferation and cellcycle marker (cyclin D1). Trends of mRNA expression changes (0.05 < p < 0.10) were found in white blood cell (WBC) between different feeding regimens, since the expression variability in the groups was very high (Table 4). Between the different time points there were significant differences within the APD, where TNFa (p = 0.033), NFkB (p = 0.024), and Caspase 3 (p = 0.019) mRNA expression increased significantly over treatment time (Figure 2).
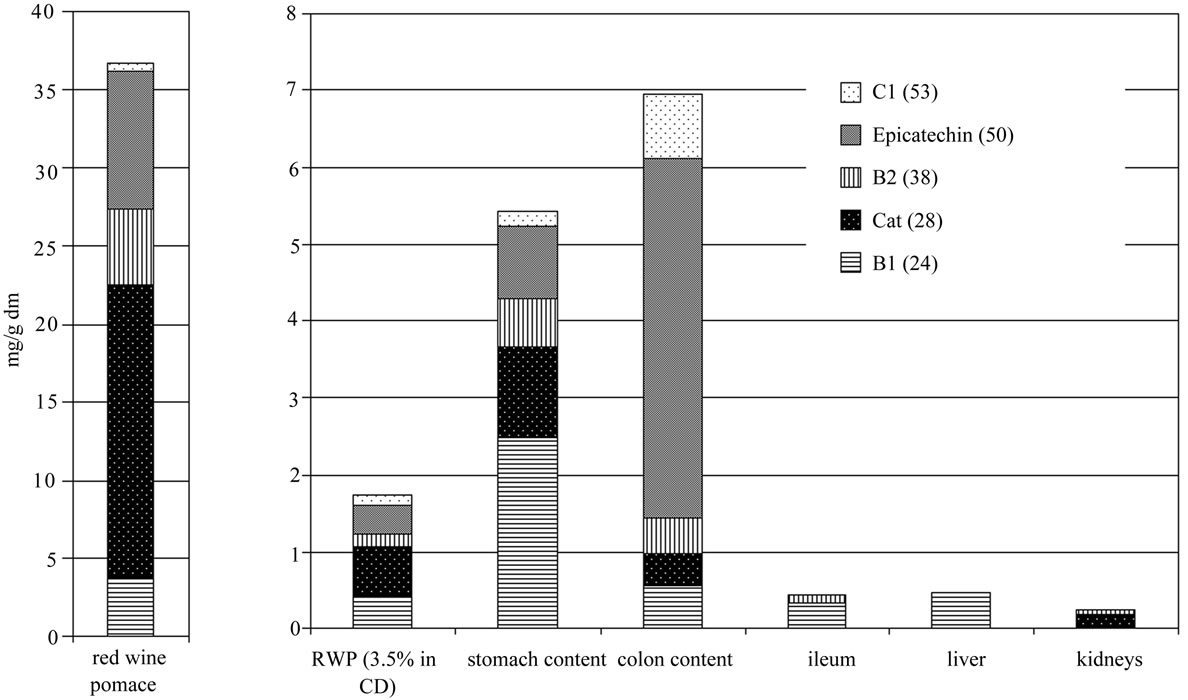
Figure 1. Content of the main Flavan-3-ols (epicatechin and catechin) and proanthocyanidins (B1, B2 and C1) in red-grape pomace, the RGPD feed, stomach and colon content and in ileum, liver and kidneys in mg/g dry matter (dm). The procyanidins C1, B2 and B1 and the monomer epicatechin were calculated as epicatechin, catechin as catechin.

Table 4. Marker gene mRNA expression in white blood cells (WBC) was quantified by quantitative RT-PCR. Data are shown as DDCP values from day 31 and 50 (n = 6; mean ± SD). All gene expression data were normalized to the mean control diet (CD at day 31) gene expression of the respective gene.

Figure 2. Marker gene mRNA expression in white blood cells (WBC) in apple pomace diet (APD) and red-wine pomace diet (RGPD) treatment was quantified by quantitative RT-PCR. Data are shown as DDCP values from day 31 and 50 (n = 6; mean ± SD). All gene expression data were normalized to the mean control diet (CD at day 31) gene expression of the respective gene.
3.4. Blood Parameters
Results from the haematological examination are summarized in Table 5. The sex of the piglets had no significant influence on the different blood parameters. Only very few non-segmented neutrophilic granulocytes (0.00 ± 0.00), basophilic (0.32 ± 0.78) and eosinophilic granulocytes (0.48 ± 1.05) were counted, therefore no statistical calculation was made with these parameters (n. d.). The number of erythrocytes was higher in the CD compared to APD at the end of the feeding trial (p = 0.049). The hemoglobin concentration decreased significantly over time in CD (p = 0.015), APD (p < 0.001) and RGPD group (p = 0.005), as did the haematocrit (CD p = 0.001, APD p < 0.001, RGPD p < 0.001). At the first time point we found more thrombocytes in RGPD than in CD (p = 0.019), at the second time point more thrombocytes in APD (p = 0.042) and RGPD (p = 0.029) than in CD. The number of thrombocytes decreased over time in CD (p = 0.031) and RGPD (p < 0.001), in APD it was only a trend of decrease.
3.5. Bacterial Flora
Table 6 summarizes the results of the bacterial examination in faeces samples. Steptococci/Ente-rococci increased in the CD (p = 0.002) and in the RGPD (p = 0.024), whereas the APD (p = 0.292) showed no significant change. C. perfringens was not detectable at the second time point. The number of lactobacilli increased in APD (p < 0.001) and RGPD (p = 0.033). On day 50, the numbers of lactobacillus in the APD and RGPD groups were higher (p < 0.001) than in CD.