Physical-Properties of Oxygen-Deficient Co-Based Perovskites: Co(Sr1-xYx)O3–δ (0.05 ≤ x ≤ 0.4) ()
1. Introduction
For a quite longer time the Y-doped perovskite cobalt oxide, Co(Sr1–xYx)O3-d has been studied intensively for its interesting structural, magnetic and transport properties [1-11]. In Co(Sr1–xYx)O3–d series the “x” can be extended to maximum level of ~0.4 under ambient conditions [7]. However under high pressure and high temperature (HPHT) synthesis conditions the “x” could be extended to the end member x = 1.0 (YCoO3) [12]. Interestingly both ambient and HPHT synthesised samples showed different results on structural and physical properties. For example, in the ambient synthesis method oxygen deficiency is expected in the final product, Co(Sr1–xYx)O3-d and thus it leads to unusual above room temperature ferromagnetism at ~335 K for x = 0.225 composition [7]. On the other hand HPHT method is a closed system in which we expect no oxygen vacancies in the final product and the observed ferromagnetism (Tc ~ 250 K) seems to be dominated by the double exchange interaction between Co4+ and Co3+ ions for x ~ 0.225. Furthermore, the observed ferromagnetic state of HPHT sample is different from oxygen-deficient samples [7,12]. The laboratory source X-ray powder diffraction patterns of our previously synthesised HPHT Co(Sr1–xYx)O3; 0 ≤ x ≤ 1.0 system indicated cubic perovskite structure for x = 0, 0.1, 0.2, 0.3, 0.4, 0.5 samples, and orthorhombic perovskite structure for x = 0.8 and 1.0, while coexisting of the two phases for x = 0.6 at room temperature conditions. With the Y3+ ion substitution, the transition temperature increased slightly to Tc ~ 275 K at x = 0.1, then decreased rapidly to Tc ~ 60 K for x = 0.6. The end member, x = 1 (YCoO3) showed non-magnetic behaviour. The cubic structure samples had metallic electric resistivities while the orthorhombic ones with semiconducting/insulating nature.
Kobayashi et al. [7] have reported a research work on the magnetic susceptibility and transport properties of oxygen deficient Co(Sr1–xYx)O3-d with x = 0.1, 0.15, 0.2, 0.215, 0.225, 0.25, 0.3, and 0.4 and found that the perovskite Co(Sr1–xYx)O3–d is a ferromagnet with a Curie temperature of ~335 K in a narrow compositional range of 0.2 ≤ x ≤ 0.25. They suggested that the observed ferromagnetism is driven by oxygen vacancy and Sr/Y orderings than double exchange interaction. Fukushima et al. [10] have succeeded in synthesising A-site ordered and disordered Y0.25Sr0.75CoO3–d materials with various oxygen deficiencies (d) and compared their structural and physical properties. No oxygen-vacancy ordering was observed in the A-site disordered structure sample (d = 0.16) and it showed a ferromagnetic transition around ~150 K. On the other hand in the ordered structure sample (d = 0.34) they observed oxygen vacancy ordering with a (weak) ferromagnetic transition above 300 K. The high field magnetization (up to 57 Tesla) as well as highfrequency electron spin resonance measurements have been carried out by Kimura et al. [11] for the Co(Sr1–xYx) O3-d series with x = 0.22 and 0.25. They noticed that for x = 0.25 a spin-state transition can be induced by the external magnetic fields and this transition (spin-state) is assisted by an internal field originating from ferromagnetic exchange interaction between Co3+ ions. Further they discussed the difference of magnetic behaviour between the samples with x = 0.22 and 0.25.
In this study, though a quite systematic study was done by Kobayashi et al. [7] for the Co(Sr1–xYx)O3–d system, we report additional results on the magneto-transport properties of the present series of samples prepared under ambient pressure conditions. In order to strengthen our research findings various experimental works have been performed in the present investigations. To the best of my knowledge the MR (magnetoresistance) of Co(Sr1–xYx) O3–d series with different “x” has not been reported in detail. In this work some interesting features of the MR of the present series are reported.
2. Experimental Details
2.1. Materials Synthesis
A series of oxygen deficient perovskite cobalt oxides with different “x” (x = 0.05, 0.1, 0.15, 0.2, 0.225, 0.25, 0.3, 0.35, and 0.4) in the Co(Sr1–xYx)O3–d series were prepared by solid-state reaction route under ambient pressure and high-temperature quite similar to our previous study of Ho-doped Co(Sr1–xHox)O3–d system [15]. Raw materials used for the syntheses of Co(Sr1–xYx)O3–d series were high purity powders of Co3O4 (Rare Metallic, 99.9%), SrO2 (laboratory prepared) and Y2O3 (High Purity Chemicals, 99.9%). These above raw chemicals were thoroughly mixed in an agate mortar with pestle. Each fine mixed powder was pressed into a pellet (Ø = 10 mm), followed by heating at 1070˚C for 48 hrs in a high purity aluminum boat. The heat treated pellets were cooled (100˚C∙h–1) to room temperature and the cooled pellets were crushed in to powder in an agate mortar for homogenizing of the components. Each powder was again pressed in to small pellets (10 mm diameter) at 2 ton applied pressure and annealed at 1070˚C for 16 hrs in ambient conditions. After that the furnace was cooled to room temperature in 10 hrs span. The cooled pellets/ samples were divided in to several portions for further processing and characterizations.
2.2. Materials Characterization
All the as-prepared (ground powder) samples were analyzed by a powder X-ray diffraction method in a commercial instrument RIGAKU, RINT-2200 using Cu K radiation (λ = 1.5406Å). The data were analyzed with the JANA2006 software, from which the cell parameters were calculated by least-square method [13].
The dc-magnetic properties of the small pellets were recorded in a commercial magnetometer with the superconducting quantum interference device (Quantum Design/MPMS-XL) in the temperature range from 400 to 2 K. The various isothermal magnetization curves were collected at different temperatures in applied fields up to Ha = ±70 kOe. The dc-electric resistivity and magnetoresistance (MR) up to ±70 kOe were measured by the standard four-probe technique using the commercial physical property measurement system (PPMS-6600/Quantum Design) in the temperature range from 400 to 2 K.
3. Results and Discussion
3.1. Laboratory Source X-Ray Diffraction Patterns
Figure 1 shows the room temperature X-ray (powder)

Figure 1. X-ray powder (Cu Kα radiation; λ = 1.5406 Å) diffraction patterns of various polycrystalline samples of Co(Sr1–xYx)O3–δ; 0.05 ≤ x ≤ 0.4. The symbol “¨” indicates impurity peak of Y2O3.
diffraction patterns of Co(Sr1–xYx)O3–d series with x = 0.05, 0.1, 0.15, 0.2, 0.225, 0.25, 0.3, 0.35, 0.4. All the as-prepared samples are in single phase. To perfectly match the crystal symmetry, the Pm3m space group was used for x = 0.05, 0.1 and 0.15 samples and I4/mmm for 0.2 ≤ x ≤ 0.4 compositions. The cubic lattice parameter decreases with increase of “x” and confirming the substitution of Sr2+ (1.26 Å) by Y3+ (1.019 Å) ions. For x = 0.2 the calculated tetragonal lattice parameters are a = 7.658(8) Å and c = 15.35(3) Å which decrease monotonically with increase of “x”, as shown in Table 1. For x = 0.4, a slight increase in “a” and “c” is noted. Such an increase of lattice parameters is also reported by Kobayashi et al. [7] in their work. Further such a change in tendency was seen in the Ho-doped system [15]. For higher Y-concentration (x = 0.35 and 0.4) couple of unreacted non-magnetic impurity (Y2O3) peaks are seen around 2θ = 29.34˚ and 57.74˚. The calculated lattice parameters of present series of samples are slightly smaller than Kobayashi et al. Co(Sr1–xYx)O3–d samples report [7]. The only difference was instead of SrCO3 we used SrO2 as a starting material in the materials synthesis. The slight difference in lattice parameters could be due to the synthesis process and the net composition of the as-prepared samples.
3.2. Magnetic Properties
3.2.1. Magnetic Susceptibility, χ = M/H
For better understanding the magnetic properties of the present system, in Figure 2 various temperature dependence of magnetic susceptibility, χ(T) plots are displayed for the Co(Sr1–xYx)O3–d series with x = 0.05, 0.1, 0.15, 0.2, 0.225, 0.25, 0.3, 0.35, 0.4. Like Ho-substituted system, the present (Y-doped) χ(T) data clearly show the appearance of a ferromagnetic component around 350 K in a relatively narrow composition range 0.15 ≤ x ≤ 0.225. The former one showed maximum Tc around ~335 K [15] which is slightly lower than the present Y-series. A little difference in “x” is noticeably affected the magnetic properties of the system. Now we will analysis the magnetic nature of the samples one by one. The x = 0.05 sample exhibits weak antiferromagnetic-like transition at TN ~ 76 K. The magnetization (susceptibility) increases with decrease of temperature from 400 K and reaches a maximum at TN ~ 76 K. Two type of (broad) antiferromagnetic-like transitions are seen at TN ~ 296 and 92 K, respectively for x = 0.1. For x = 0.15 a ferromagnetic like transition is noticed at ~350 K. Around ~350 K a rise in magnetization is observed with decrease of temperature and below 292 K (a further decrease of temperature) a ferromagnetic saturation tendency is noted. Like x = 0.15, the x = 0.2 and 0.225 samples also exhibit ferromagnetic transition at ~350 K with enhanced ferromagnetic component. On the other hand the x = 0.25 sample reveals sharp rise in magnetization (χ = M/H) at ~350 K and a maximum around Tm ~ 275 K and decreases with decrease of temperature up to 125 K then takes an almost constant value with decreasing temperature until 2 K. The onset of the magnetic susceptibility indicates to the ferromagnetic transition. Similarly, the samples with x = 0.3, 0.35 and 0.4 exhibit TN at ~284, 268 and 264 K, respectively with enhanced antiferromagnetic component. The onsets of the weak ferromagnetic transition are rather broad in the χ(T)measurements for x = 0.3, 0.35 and 0.4 samples. In accordance with the literature survey [2-8,14,15] as well as from our experimental findings it

Table 1. Composition (x), lattice parameters (a, c), unit cell volume (V) and effective moment (M) of (Sr1−xYx)CoO3−δ polycrystalline various oxygen deficient samples.

Figure 2. Magnetic susceptibility of CoSr1–xYxO3–d (0.05 ≤ x ≤ 0.4) series samples measured in an applied field of 1 kOe on cooling mode.
is obvious that the unusual ferromagnetism seen in the Co(Sr1–xYx)O3–d series is due to oxygen vacancy as well as Sr/Y orderings. The formation of multiple superstructures in relation to the oxygen vacancy and Sr/Ho orderings has been reported in our recent work on the oxygen deficient Co(Sr1–xHox)O3–d series; x = 0.225 [15] which showed quite similar results on structural and physical properties. The electron diffraction data suggested that the formation of the multiple superstructures plays a vital role to establish the atypical ferromagnetism [2-8,14,15]. The variation of inverse magnetic susceptibility with temperature, χ–1(T) curves for the present Co(Sr1–xYx)O3–d series with 0.05 £ x £ 0.4 samples are illustrated in Figure 3 and these χ–1(T) curves are further supporting the magnetic properties of the samples.
3.2.2. Magnetization Isotherms, M(H)
The magnetic field dependence of magnetization, M(H) isotherm results for the Co(Sr1–xYx)O3–d series are presented in Figure 4. The M(H) curves generated at T = 10 K for x = 0.15, 0.2, 0.225 and 0.25 samples exhibit nonlinear behaviour with increase of field strength from 0 to ±70 kOe. These narrow compositions show hysteresis loop opening with quite high coercive field which assign the existence of ferromagnetic component in the magnetization. The coercive field, Hc = 11.02, 12.25 and 14.0 kOe are noted for x = 0.15, 0.2 and 0.225 compositions, respectively. The slight non-saturating tendency seen in these samples is mainly due to the presence of (weak) antiferromagnetic components. For x = 0.3, 0.35 and 0.4 compositions the magnetization increases (linearly) with

Figure 3. Variation of inverse magnetic susceptibility with temperature for the Co(Sr1–xYx)O3–d series with 0.05 ≤ x ≤ 0.4.
increase of field strength. Hover they show slight hysteresis in the entire range of applied field, ±70 kOe; –70 ≤ H ≤ 70 kOe signifying the antiferromagnetic components present in the magnetization. The magnetization curves of the samples with x = 0.05 and 0.1 show considerable differences in M(H) curves. The x = 0.05 and 0.1 samples magnetization increase with linear increase of field strength. The latter sample, x = 0.1 shows slight loop opening which confirms the antiferromagnetic components of the sample. Further χ(T) measurement supports the M(H) result.

Figure 4. Magnetic field dependence of (isothermal) magnetization curves performed at T = 10 K (–70 ≤ H ≤ 70 kOe) for different “x” in Co(Sr1–xYx)O3–d (0.05 ≤ x ≤ 0.4) series.
Under the extreme field strength (H = 70 kOe) all samples reaches maximum effective moment (magnetization). The effective moment enhances with increase of “x” until x = 0.2 then reduces with further increase of “x” (see Figure 5(a)). For the optimal composition, x = 0.225 the magnetic field dependence of magnetization, M(H) isotherms data were also measured at different temperatures, T = 5, 50, 100, 150, 200, 250, 300, 325 and 350 K in the applied field range ±70 kOe in full cycle measurements (Figure not shown here). The magnetization (effective moment) increases with increase of applied field strength with out saturating the magnetic moment even at the maximum applied field Ha = 70 kOe. At the maximum applied field Ha = 70 kOe a maximum effective moment is attained in all the M(H) measurements. The variation of effective moment versus temperature is shown in Figure 5(b); left) for x = 0.225 composition. Except T = 350 K isotherm, all the isotherm curves exhibit hysteresis loop opening with high coercive field and the coercive field decreases with increasing the temperature (see Figure 5(b); right). The T = 350 K isotherm measurement shows the absence of both coercive field and hysteresis loop opening.
3.3. Transport Properties
3.3.1. Electrical Resistivity, ρ vs T
The temperature dependence of electrical resistivity (ρ versus T) for the Co(Sr1–xYx)O3–d series is depicted in
 (a)
(a)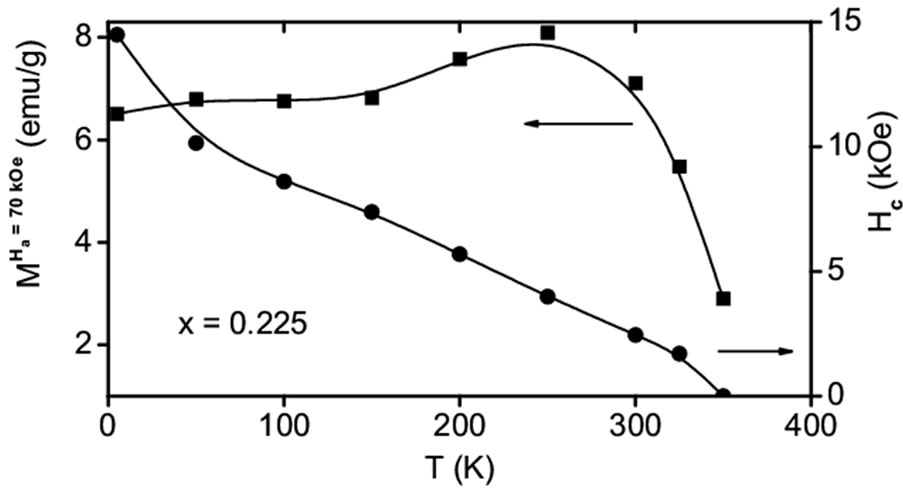 (b)
(b)
Figure 5. (a) Variation of effective moment obtained at T = 10 K with “x” in Co(Sr1–xYx)O3–d (0.05 ≤ x ≤ 0.4) series, (b) Change of effective moment with temperature (left) and variation of coercive field with respect to temperature (right) for x = 0.225 in Co(Sr1–xYx)O3–d series.
Figure 6. The ρ versus T measurements were performed on all compositions, x = 0.05, 0.1, 0.15, 0.2, 0.225, 0.25, 0.3, 0.35 and 0.4. These compositions (x = 0.05 - 0.4) show typical semiconducting behaviour over the measuring temperature range. The semiconducting behaviour increases with higher compositions “x”. For all compositions the electrical resistivitiy increases with decrease of temperature. The ρ versus T plot of x = 0.1 exhibits low resistivity between 400 K and ~120 K than 0.05 sample. Below 120 K the resistivity shoots up and show higher resistivity than 0.05 at low temperature. The room temperature (300 K) resistivity increases with increase of x except x = 0.1 and 0.25. For these a slight deviation (decrease in resistivty) is noticed from the trend. The lightly doped composition (x = 0.05) shows the lowest semiconducting electrical resistivitiy (ρ = 0.865 Ω cm at 5 K) whereas the highly doped composition (x = 0.4) reveals the highest electrical resistivitiy with semiconducting/ insulating behaviour (ρ = 8.58 × 10⁴ Ω cm at 95 K). Quite similar ρ(T) tendency has been reported for the Co(Sr1–xYx)O3–d series by Kobayashi et al. [7].

Figure 6. Temperature dependence of the electrical resistivity for Co(Sr1–xYx)O3–d; 0.05 ≤ x ≤ 0.4.
3.3.2. Variable Range Hopping, VRH Model
Based on a linear dependence of ln ρ versus T–1/4, the three dimensional variable range hopping (VRH) conduction model can be suggested at 80 K £ x £ 300 K for the present Co(Sr1–xYx)O3–d series of samples. In the three-dimensional VRH model, the electrical resistivity can be described by ρ = ρ0 × exp(T0/T)–1/4, where ρ0 is constant and T0 is the VRH parameter. Figure 7 represents the VRH conduction model for different compositions, x = 0.05, 0.1, 0.15, 0.2, 0.225, 0.25, 0.3, 0.35 and 0.4 within the temperature range 80 K ≤ T ≤ 300 K. The (nearly) linear dependence suggests that hopping conduction is dominant in the certain temperature range for almost all samples. However the x = 0.225, 0.25 and 0.3 compositions show slight non-linearity in some temperature range.
3.3.3. Magnetoresistance, MR
Figure 8 demonstrates the magnetoresistance (MR) measured at the field strength difference ΔH = 70 kOe for the Co(Sr1–xYx)O3–d series with different “x”. The absolute values of MR were calculated using the relation, MR = (ρH – ρ0)/ρ0 × 100%, where ρ0 stands for the zerofield ρ and where ρH stands for the field dependent ρ. The temperature dependence of MR for the x = 0.05 sample shows negative MR in the entire temperature range between 400 and 2 K. The observed –MR increases monotonically with decrease of temperature from 400 K to ~230 K. Below ~230 the –MR increases steeply with further decrease of temperature and exhibits maximum –MR of ~16% at low temperature, T = 10 K. For x = 0.1, +MR is seen at the high temperature region between 400 and ~200 K. The maximum +MR (~12% around 400 K) decreases with decrease of temperature to ~200 K. Below 200 K it exhibits –MR and increases with decrease

Figure 7. ln (ρ) versus T−1/4 plots for the Co(Sr1–xYx)O3–δ; 0.05 ≤ x ≤ 0.4 series.

Figure 8. The temperature dependence of magnetoresistance of the polycrystalline samples of Co(Sr1–xYx)O3–d series with different x.
of temperature and reaches maximum –MR of ~21% at 5 K. This is quite interesting and need more studies. The cubic phase terminated at x = 0.15 composition which exhibits maximum +MR of 4% ~ 5% at 280 and 365 K. The x = 0.2 sample shows maximum +MR (8% ~ 10%) at two regions. By decreasing temperature from 400 K the +MR grows to about 7.6% at 345 K then decreases to ~0% with further decrease of temperature to 245 K. Then the MR increases with further decrease of temperature and exhibits maximum +MR ~10% at 155 K. Then decreases with further decrease of temperature and shows –MR (~2%) below 100 K. Overall the temperature dependence of MR curve looks like “M” shaped (mountain) curve for x = 0.2 sample. The composition x = 0.225 exhibits maximum +MR (9 %) at the transition temperature, T ~ 350 K. For x = 0.225, the MR grows from 0 to 9% by decreasing the temperature from 400 K to transition temperature 350 K. At 350 K it shows maximum +MR of 9%. This value decreases with decrease of temperature and reaches about 0% at 290 K. Below 290 K (i.e., 290 - 35 K) it reveals –MR values (1% ~ 3%). The positive MR feature suggests that the applied magnetic field disturbs charge transport over the magnetic ordering evolution. The Ho-doped optimum composition, x = 0.225 exhibits quite similar tendency in the temperature dependence of MR curve, which reveals relatively large maximum +MR (16.5%) at 330 K [Ref. 15] than the present system. Like x = 0.2, the x = 0.25 sample also shows maximum +MR (8% ~ 12%) almost at two regions. The latter one exhibits first maximum +MR at 325 K (12%) and the second one at 185 K (8%). Below 180 K it shows –MR values in scattered manner. For x = 0.3 composition maximum +MR (~25%) is noted around 300 K. Interestingly, the x = 0.35 sample shows highest maximum –MR (35%) value at 90 K. At high temperature it shows +MR and increases to 18% with decrease of temperature to 155 K. Below the temperature the MR changes abruptly and reaches highest –MR (35%) value at 90 K. This value is amazing and need more studies on the temperature as well as field dependence of magnetoresistance, MR(T) and MR(H) at low temperature region. A slight increase in +MR is seen for x = 0.4 while decreasing the temperature from 400 K to 300 K. At 300 K it reveals maximum +MR of about 5% and then starts to decrease by decreasing the temperature.
To collect more MR data for the optimal composition, x = 0.225, the field dependence of MR(H) was also measured at T = 100, 200 and 300 K in the applied field range ±70 kOe (figure not shown here). The MR(H) measured at T = 300 K condition reveals +MR ~ 3% in the entire range of fields –70 ≤ H ≤ 70 kOe with out any major changes. On the other hand, a small negative MR features were also observed for x = 0.225 composition in addition to the positive MR at T = 100 and 200 K in the MR versus H measurements. They demonstrate both +MR (~5%) and –MR (~2%) in the applied fields –70 ≤ H ≤ 70 kOe. For x = 0.225, Kobayashi et al. [Ref. 7] have reported –MR of ~0.5% at 300 K and 70 kOe conditions unlike our present findings. Further efforts are needed to establish responsible scattering mechanisms of the charge transport of the Y-substituted system.
4. Conclusions
Like Ho-substituted system [15], the present Y-doped magnetization data showed ferromagnetism around ~350 K in a narrow composition range 0.15 ≤ x ≤ 0.225. The unusual ferromagnetism seen in the Co(Sr1–xYx)O3–d series is mainly due to oxygen vacancy and Sr/Y orderings. The entire (x = 0.05 ≤ x ≤ 0.4) compositions showed semiconducting behaviour over the whole measuring temperature range and increased with “x”. Some interesting features of MR were observed for the present series of samples and need more studies. The electrical resistivity data of Co(Sr1–xYx)O3–d; 0.05 ≤ x ≤ 0.4 series samples were elucidated based on VRH model at the temperature range 80 K ≤ T ≤ 300 K. The narrow compositions, 0.15 ≤ x ≤ 0.225 are hard ferromagnet (T = 10 K) with quite high coercive field, Hc = 11.02, 12.25 and 14.0 kOe for x = 0.15, 0.2 and 0.225 compositions, respectively.
5. Acknowledgements
This work was carried out at the Advanced Nano Materials Laboratory, National Institute for Materials Science (NIMS), 1-1 Namiki, Tsukuba, Ibaraki 305-0044, Japan. The author is indebted to NIMS for the research support and the use of world class laboratory research facilities for the present work. Further, the author is thankful to Noorul Islam Centre for Higher Education for the encouragement.