Image Processing Tool Promoting Decision-Making in Liver Surgery of Patients with Chronic Kidney Disease ()
A wide literature review showed that the main problem in solving this need is the choice of algorithm for liver segmentation. One approach is the manual liver segmentation comprised of manually tracing of the liver boundaries. This approach however is time-consuming and segmentation results may not be as accurate as needed [4]. To save time, fully [5-11] or semi-automatic methods [12-22] have been investigated to segment the liver volume from abdomen CT images. From these two major types of algorithms, the automatic liver segmentation still possesses weaknesses and drawbacks. A comparison study between ten automatic and six interactive methods for liver segmentation from contrast-enhanced CT images showed that in general, the interactive methods reached higher average scores than the automatic approaches and featured a better consistency of segmentation quality [23]. Algorithms used for liver segmentation include grey level evaluation [6,11,24-27], clustering [17, 28-30], region-based method [31,32], Snakesbased method [33], grow-cut [34], graph cuts [15,35-37], level set [16,38-41], combinations of different approaches as for example Snakes and grow-cut [33], or graph cut and gradient flow active contour [5], or morphological operations and graph cuts [9,42], grey level and a priori knowledge like CT numbers and location [25], hidden Markov measure field model [18], multi-class smoothed Bayesian classification [20,21], and edge based methods [43]. The use of segmentation algorithm based on priority knowledge about appearance, shape and size of the liver [10,23,44-52] and methods based on neural networks [53,54] have been also proposed.
Amongst all these methods, much popularity has received those ones based on grey level evaluation. From the bulk of the available algorithms, the featured once are based on segmentation of liver from CT images by a supervised thresholding followed by k-mean clustering [17,24,25,55]. Lots of iterative morphological filtering operations and k-means clustering are performed in order to preserve the liver structure and remove the fragments of other organs using pre-knowledge for the shape, size and the location of liver. Basic weakness of these methods is that the liver grey level estimation does not take into account the high variability of this estimated value observed both in the same and in other CT volumes. The use of texture features extracted from different areas of the CT image like fractal dimensions and entropy may be useful for further liver volume refining. Another technique that demonstrated good segmentation results and performs well with respect to the noise in the images is the region growing algorithm. The approach is based on the concept of neighborhood connected pixels and has been applied in twoand three-dimensions [56].
Nevertheless, most of the proposed algorithms are however based and tested on contrast enhanced CT images. The application of contrast agent in patients with chronic renal insufficiency, however, is hindered because of the need of post procedural hemodialysis. CT without contrast has lower diagnostic accuracy for liver masses and may only set indications for emergency laparotomy. The reason for this low detection is that the X-ray absorption characteristics of the liver are very close to these of the neighbor organs like the kidneys, the spleen, the pancreas etc. This results in X-ray images with unclear liver boundaries in respect to the neighboring structures and therefore low contrast and blurry edges. This fact makes difficult the design of a robust segmentation procedure. Another difficulty is related to the huge variability of livers’ shape and size among the patients. This causes difficulties in setting the parameters of segmentation algorithms, which are based on priority knowledge about shape and size of the liver and therefore fail to produce correct results when non standard shapes are present [23, 44]. Thus, main efforts are nowadays directed towards the development of robust semior fully-automatic liver segmentation in case of patients that undergo non-contrast CT scans.
Currently, estimation of the liver volume at the Department of Surgery at the University Hospital of Varna is accomplished by an expert radiologist. The procedure requires the radiologists to manually segment the liver areas on each slice from the acquired CT scan and then to calculate the liver volume. In many cases, however, the surgeon needs to perform evaluation of the residual volume himself and therefore to make a prognosis for the liver function after the surgery. Presently, the surgeons assess both the volume and the residual liver function subjectively that may result in inaccuracies and misleading decisions. This is very important in cases of patients with chronic kidney disease, patients that undergo noncontrast CT where inaccuracy from liver selection may arise. A dedicated software tool that offers liver volume extraction combined with a virtual interactive surgery and concrete prognosis in terms of residual liver volume, thus providing objective evaluation, would be of great assistance to the surgeons.
The aim of this work is to facilitate the work of surgeons, specifically experienced in liver surgery and radiotherapy specialists in our University Hospital. For this purpose, we developed, tested and installed a complete software platform with three basic modules: liver volume segmentation, virtual volume resection and 3D liver rendering. The first module integrates a new methodology for evaluation of a liver volume from non-contrast abdominal CT images. The second module provides possibility for tracing of the tumor, while the third one allows 3D liver visualization followed by evaluation of the remaining liver volume and estimation of the liver function. Accurate liver segmentation is obtained with a multiple seeded regional growing algorithm. Due to the large amount of CT slices, a prerequisite from the surgeons was the automatic calculation of the liver volume. Therefore, the user involvement is minimal and limited to the selection of the CT slice where the liver first appears. The segmented images are stacked in a volume that is further rendered in three dimensions. This work has mainly two contributions: 1) an improved region growing algorithm dedicated for liver segmentation in case of non-contrast CT images and 2) a software application to facilitate the work of surgeons and used for educational purposes.
2. Methods
2.1. Liver Anatomical and Clinical Considerations
The liver is located in the upper right quadrant of the abdominal cavity and is the largest parenchymal organ in the human body. The most common classification was introduced by Couinaud, who divided the liver in eight functionally independent segments. Each of these segments contains branches of the portal vein, hepatic artery, and the bile duct. The vascular outflow of the peripheral segments is provided by the hepatic veins. The main role of the liver is to filter the blood coming from the gastro-intestinal system.
The most accurate imaging modality for diagnostics of the liver is the computed tomography. Improved CT images are achieved by the application of intravenous contrast allowing for better differentiation of the liver vessels and eventually tumors. In case of patients with kidney failure or diabetes, the use of contrast material would provoke complications. Although new contrast agents are developed, the most safety liver inspection for these patients is by use of CT without contrast. Figure 1 depicts a typical appearance of the liver on a CT slice.
As seen from Figure 1, the image of the liver and the gallbladder are merged in the case of non-contrast use. There is no boundary that discriminates the two organs due to their similar X-ray absorption characteristics. Quantitatively, the Table 1 compares the elemental composition and densities of the liver and organs in the abdomen that are close and interact with it [57]. The comparison shows how close in terms of chemical composition and density are the liver and the organs in the abdomen. The liver weight ranges from 1200 to 1400 g in the adult woman and from 1400 to 1500 g in the adult man [58].
2.2. Evaluation of the Residual Volume and Functionality after Liver Resection
The proposed methodology for evaluation of the residual volume and estimation of the functionality of the liver after resection consists of three major steps: 1) total liver volume extraction, 2) virtual tumor resection and evaluation of the residual volume and functionality and 3) volume rendering of the results.
Liver volume extraction. The main stages in the proposed algorithm for extraction and estimation of the liver volume are depicted in Figure 2 with a demonstration of the corresponding process. There was no pre-processing on the initial CT set before starting the liver segmentation, since the 2D regional growing algorithm is not sensitive to the image noise in the original images. The input data for the algorithm is the axial tomographic image where the liver first appears. At this slice, the only action required by the surgeon is to click inside the liver area. This point is taken as a seed point that is used to determine the liver area in this initial CT image. Further, several seed points are initially determined within the liver area already segmented in the current slice. The locations of the seed points are sampled randomly using Monte Carlo technique and only points that are located within the area are accepted as seed points for the region grow-
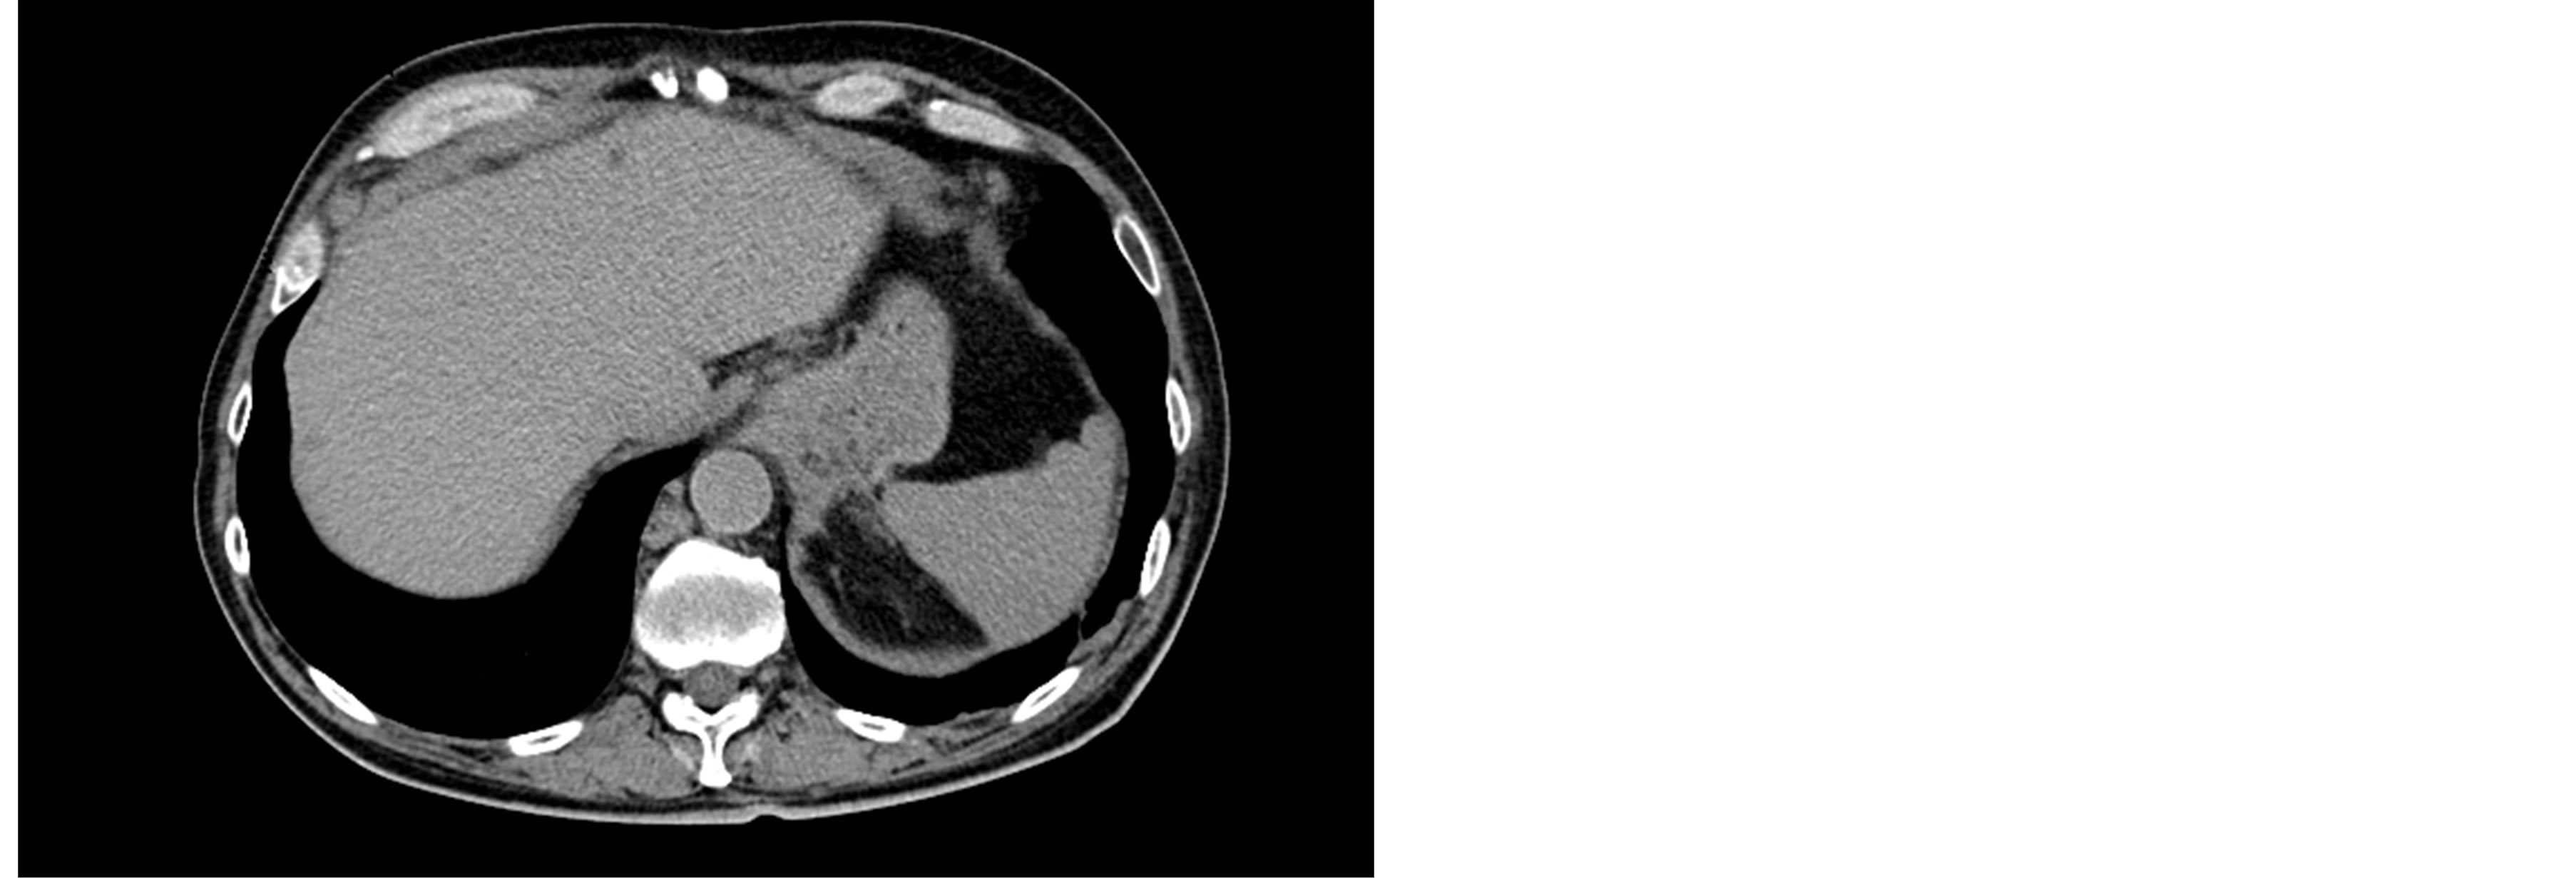
Figure 1. Typical liver radiological appearance in a noncontrast CT.
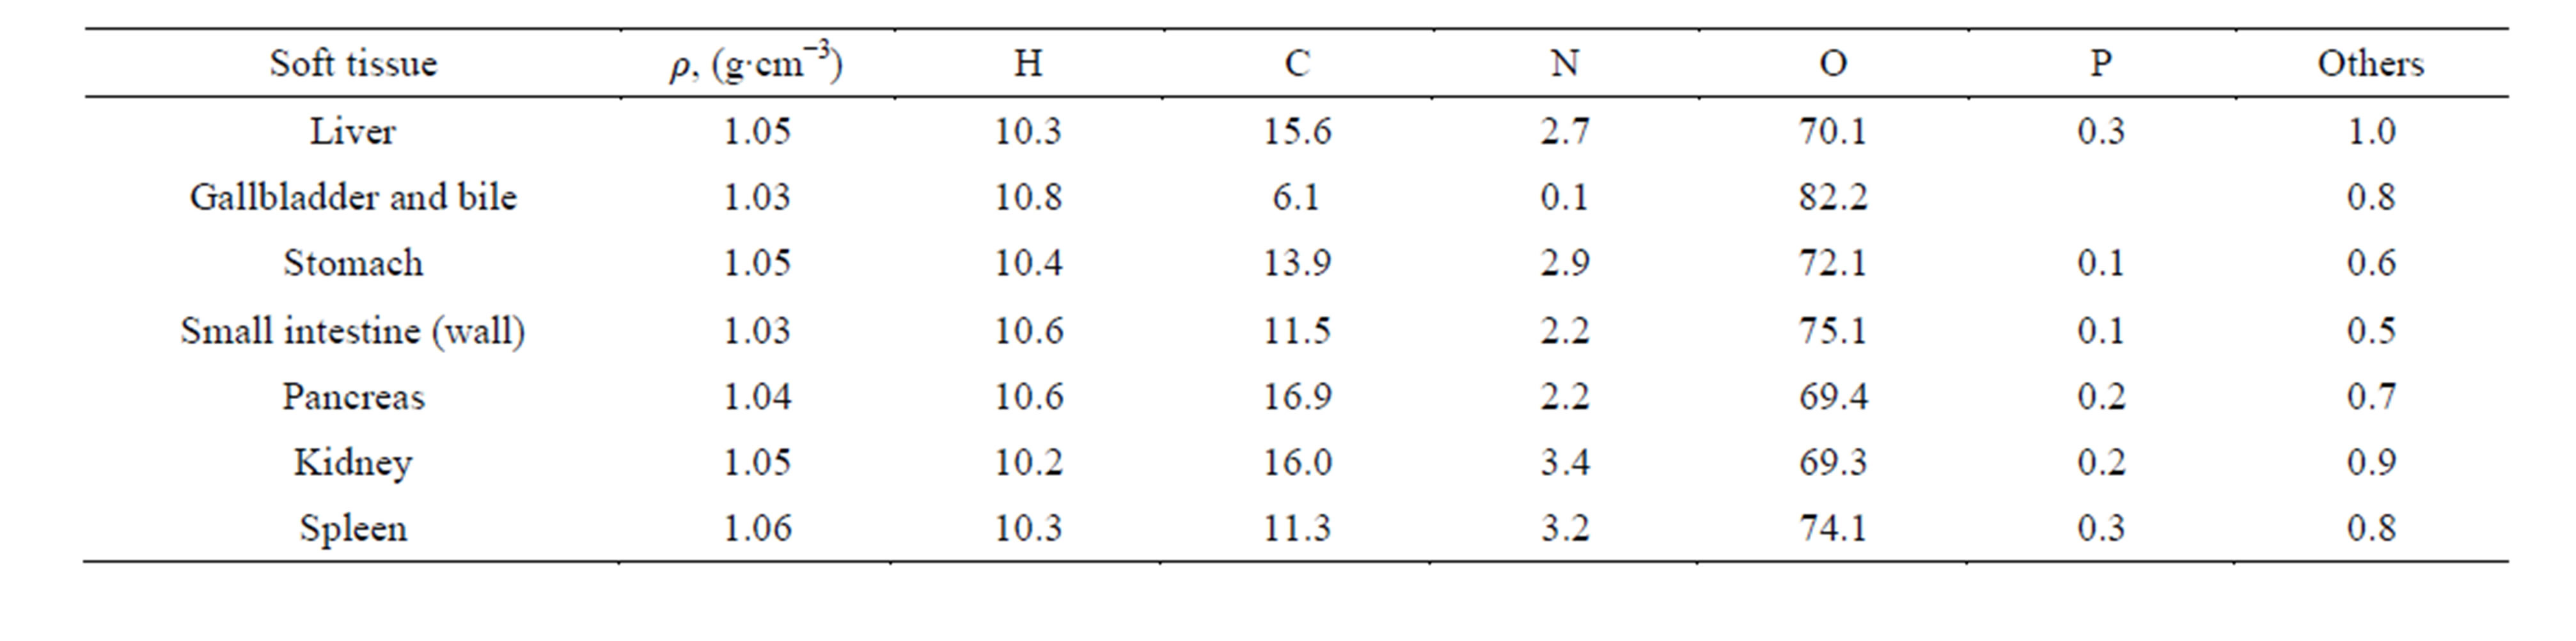
Table 1. Elemental composition and density of some organs which are located in the abdomen.
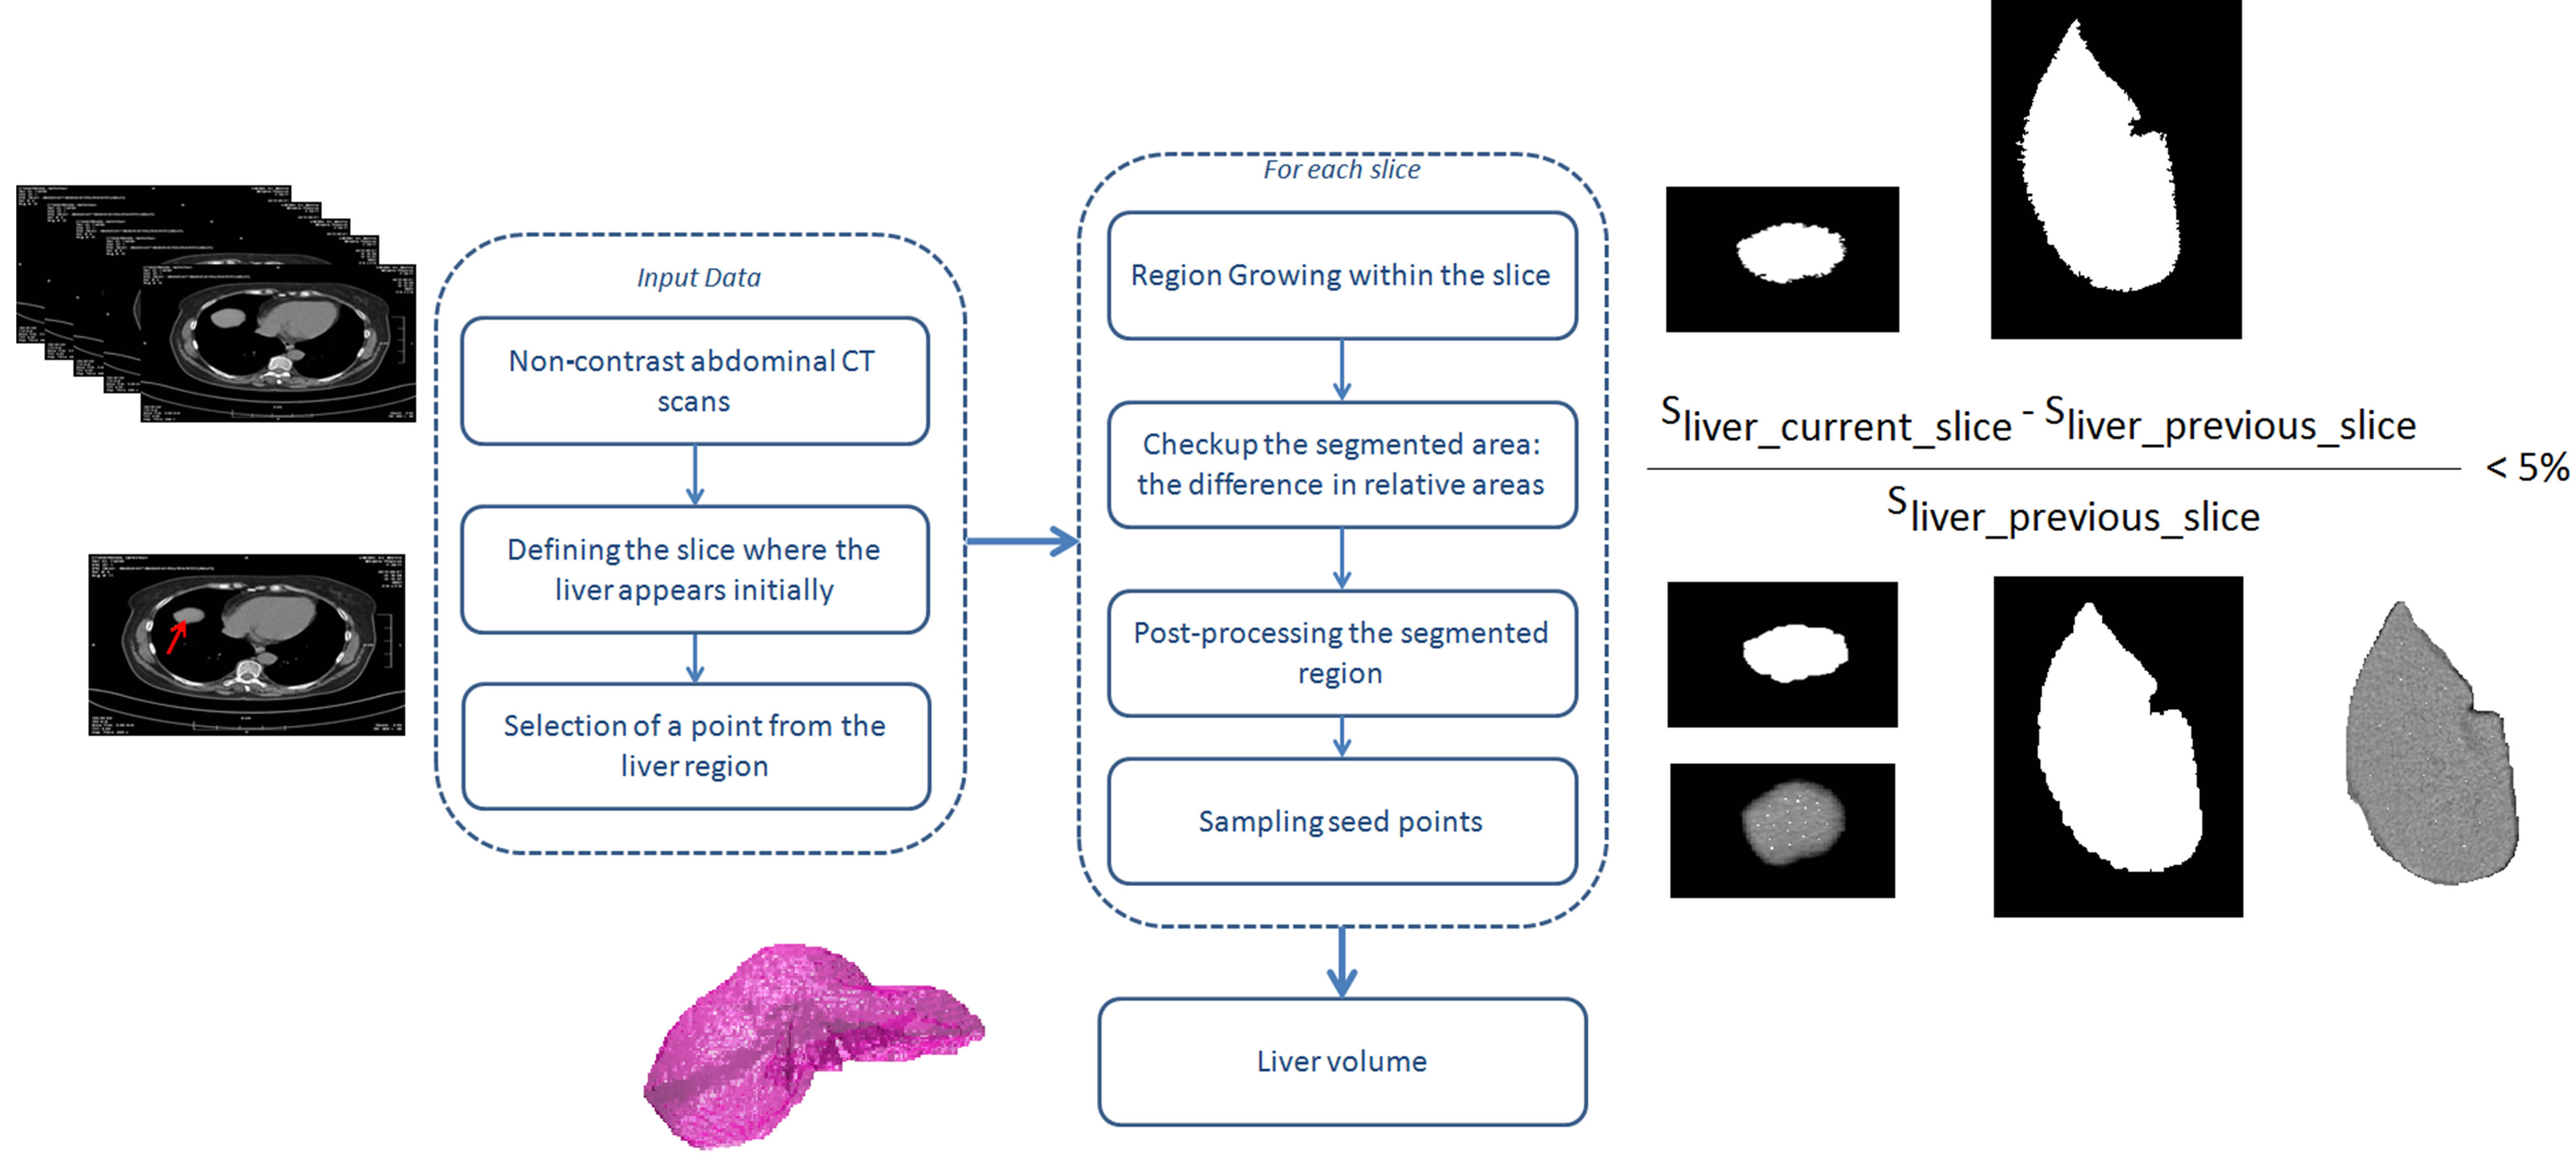
Figure 2. Block diagram of the algorithm for liver selection, together with visual presentation of the results of each block.
ing algorithm for the next slice. The intensity range is also set according to the mean intensity of the slice selected by the surgeon. This intensity range is adaptive and changes with tomographic slice.
The region growing algorithm is applied as many times as the seed points are (between 10 and 20). The region is iteratively grown by comparing all unallocated neighboring pixels to the region. Specifically, the difference between a pixel’s intensity value and the region’s mean is used as a measure of similarity. Any pixel in a slice is considered a voxel in the liver volume. After a voxel is added to the region, its eight neighbors are also processed. This process stops when the intensity difference between region mean and new pixel become larger than a certain threshold. The latter is set to the mean intensity of the selected region of the previous slide with a standard deviation set to 0.05%.
The images with the segmented liver areas obtained from the multiple seeded regional growing algorithm are then summed and voxel values are normalized to 1. To complete the segmentation of the liver parenchyma, the selected area is subjected to a set of morphological processes that fill areas that may belong to the liver. Once the segmented liver is available in 3D, the volume is calculated by taking into account the number of all voxels from the selected liver, the voxel volume and the density of the liver parenchyma, given in Table 1.
Virtual tumor resection. The virtual liver resection is performed interactively by the surgeons. This process incorporates virtual tumor removal by using another dedicated software module. In particular, axial tomographic slices are displayed on the screen and the surgeon marks the region that is supposed to be removed. The contours are then processed by morphological thresholding to de fine the resected volume. From this resection, the virtually removed volume can be calculated, similarly to the volume of the whole liver. The relative residual liver volume (RRLV) associated with the development of postoperative hepatic dysfunction and infections is defined as follows:
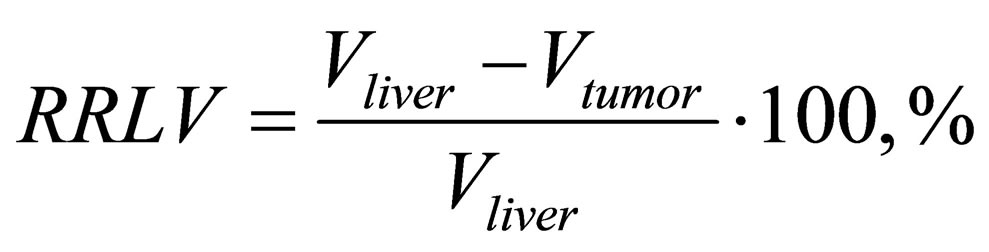
Vliver is the total liver volume, including the tumor, while Vtumor is the tumor volume.
Finally, volume rendering module of the segmented liver volume and pathologies is used to visualize the results. Volume rendering of the whole image allows an easy and fast interpretation of the segmentation result.
2.3. CT Data
Twenty abdominal CT sets were obtained at the University hospital “Saint Marina” in Varna, Bulgaria and used. The CT images were obtained using SOMATOM Definition Flash (Siemens Healthcare), comprised of a pair of sources and detectors that move around the patient. The images were of size 512 × 512 pixels and 16 bits grey level resolution. Different protocols were applied for scanning different patients. Therefore, pixel resolution varied from 0.55 × 0.55 mm2 to 0.87 × 0.87 mm2, while the inter slice distance varied between 1 and 3 mm. The number of images in each patient set varied from 60 to 178. No contrast agent was applied. From the total set of images, the half were characterized with pathology. Data were extracted from the initial DICOM images and stored in a tiff image format to facilitate the image processing techniques.
2.4. The Application as a Whole
The liver segmentation and visualization scripts were developed in Matlab (MathWorks, Inc.), while the 3D virtual resection was developed under C++. A graphical user interface has been developed for these models to facilitate work. There are no specific requirements for the system, however for fast processing it is recommended using quad-core processors and at least 4 GB of RAM.
The general workflow is as following: initially the total liver volume is extracted by applying the algorithm in Figure 2. The involvement of the user is minimal and limited to the selection of the slice where the liver initially appears in CT images. It takes few minutes to apply algorithm and to compute the final liver volume. Further, the second software module is loaded that provides a graphical environment for virtual resection. The user interactively “removes” the volume by drawing the regions on the slices of the patient CT set as depicted in Figure 3. The corresponding program code processes the outlined regions for resection and generates a 3D image of the tumor volume. Finally, the visualization module is used to render the results from the previous operations and to process quantitatively the results. 3D rendering of the whole image is particularly important for segmentation validation purposes.
3. Results and Discussion
Initially, the proposed computational tool has been evaluated to compute liver volume correctly. Further, an example of use is demonstrated in a particular case to support a decision.
3.1. Evaluation of the Proposed Computational Tool
The evaluation was carried by comparing calculated volumes obtained from automatic liver segmentation with volumes that were selected and calculated by two surgeons from all the imaging sets after manual selection. The surgeons were highly trained specialists in surgical treatment of various liver cancers with an expertise of more than 15 years in the domain. Therefore, we treated the volume they selected as a gold standard for the comparison. The comparison between all twenty volumes (after a manual procedure and according to the suggested automatic approach) showed an average relative difference of 4.5% ± 1.82%. There was no significant deviation between volumes that were automatically and manually selected, based also on visual observation.
An example is depicted on Figures 4 and 5 for case of abdominal CT sets with pathologies present. Specifically, Figure 4 reveals the comparison of the performance of the proposed algorithm (Figure 4 lower row) vs. the manual selection accomplished by one of the surgeons (Figure 4 upper row) in a case of a 65 years male with a severe alcohol induced steatohepatitis. In the same patients there were clinically significant co-morbidity due to diabetis melitus, complicated with chronic renal insufficiency, grade III and ischemic heart disease. In addition, the patient was a heavy tobacco smoker. In this patient, the severe steatohepatitis leads to parenchimal bilistasis with jaundice, total bilirubin 115, direct bilirubin 38 and hepato-renal syndrome.
The liver segmentation was performed on a set of 156 patient abdomen CT slices without contrast agent. The
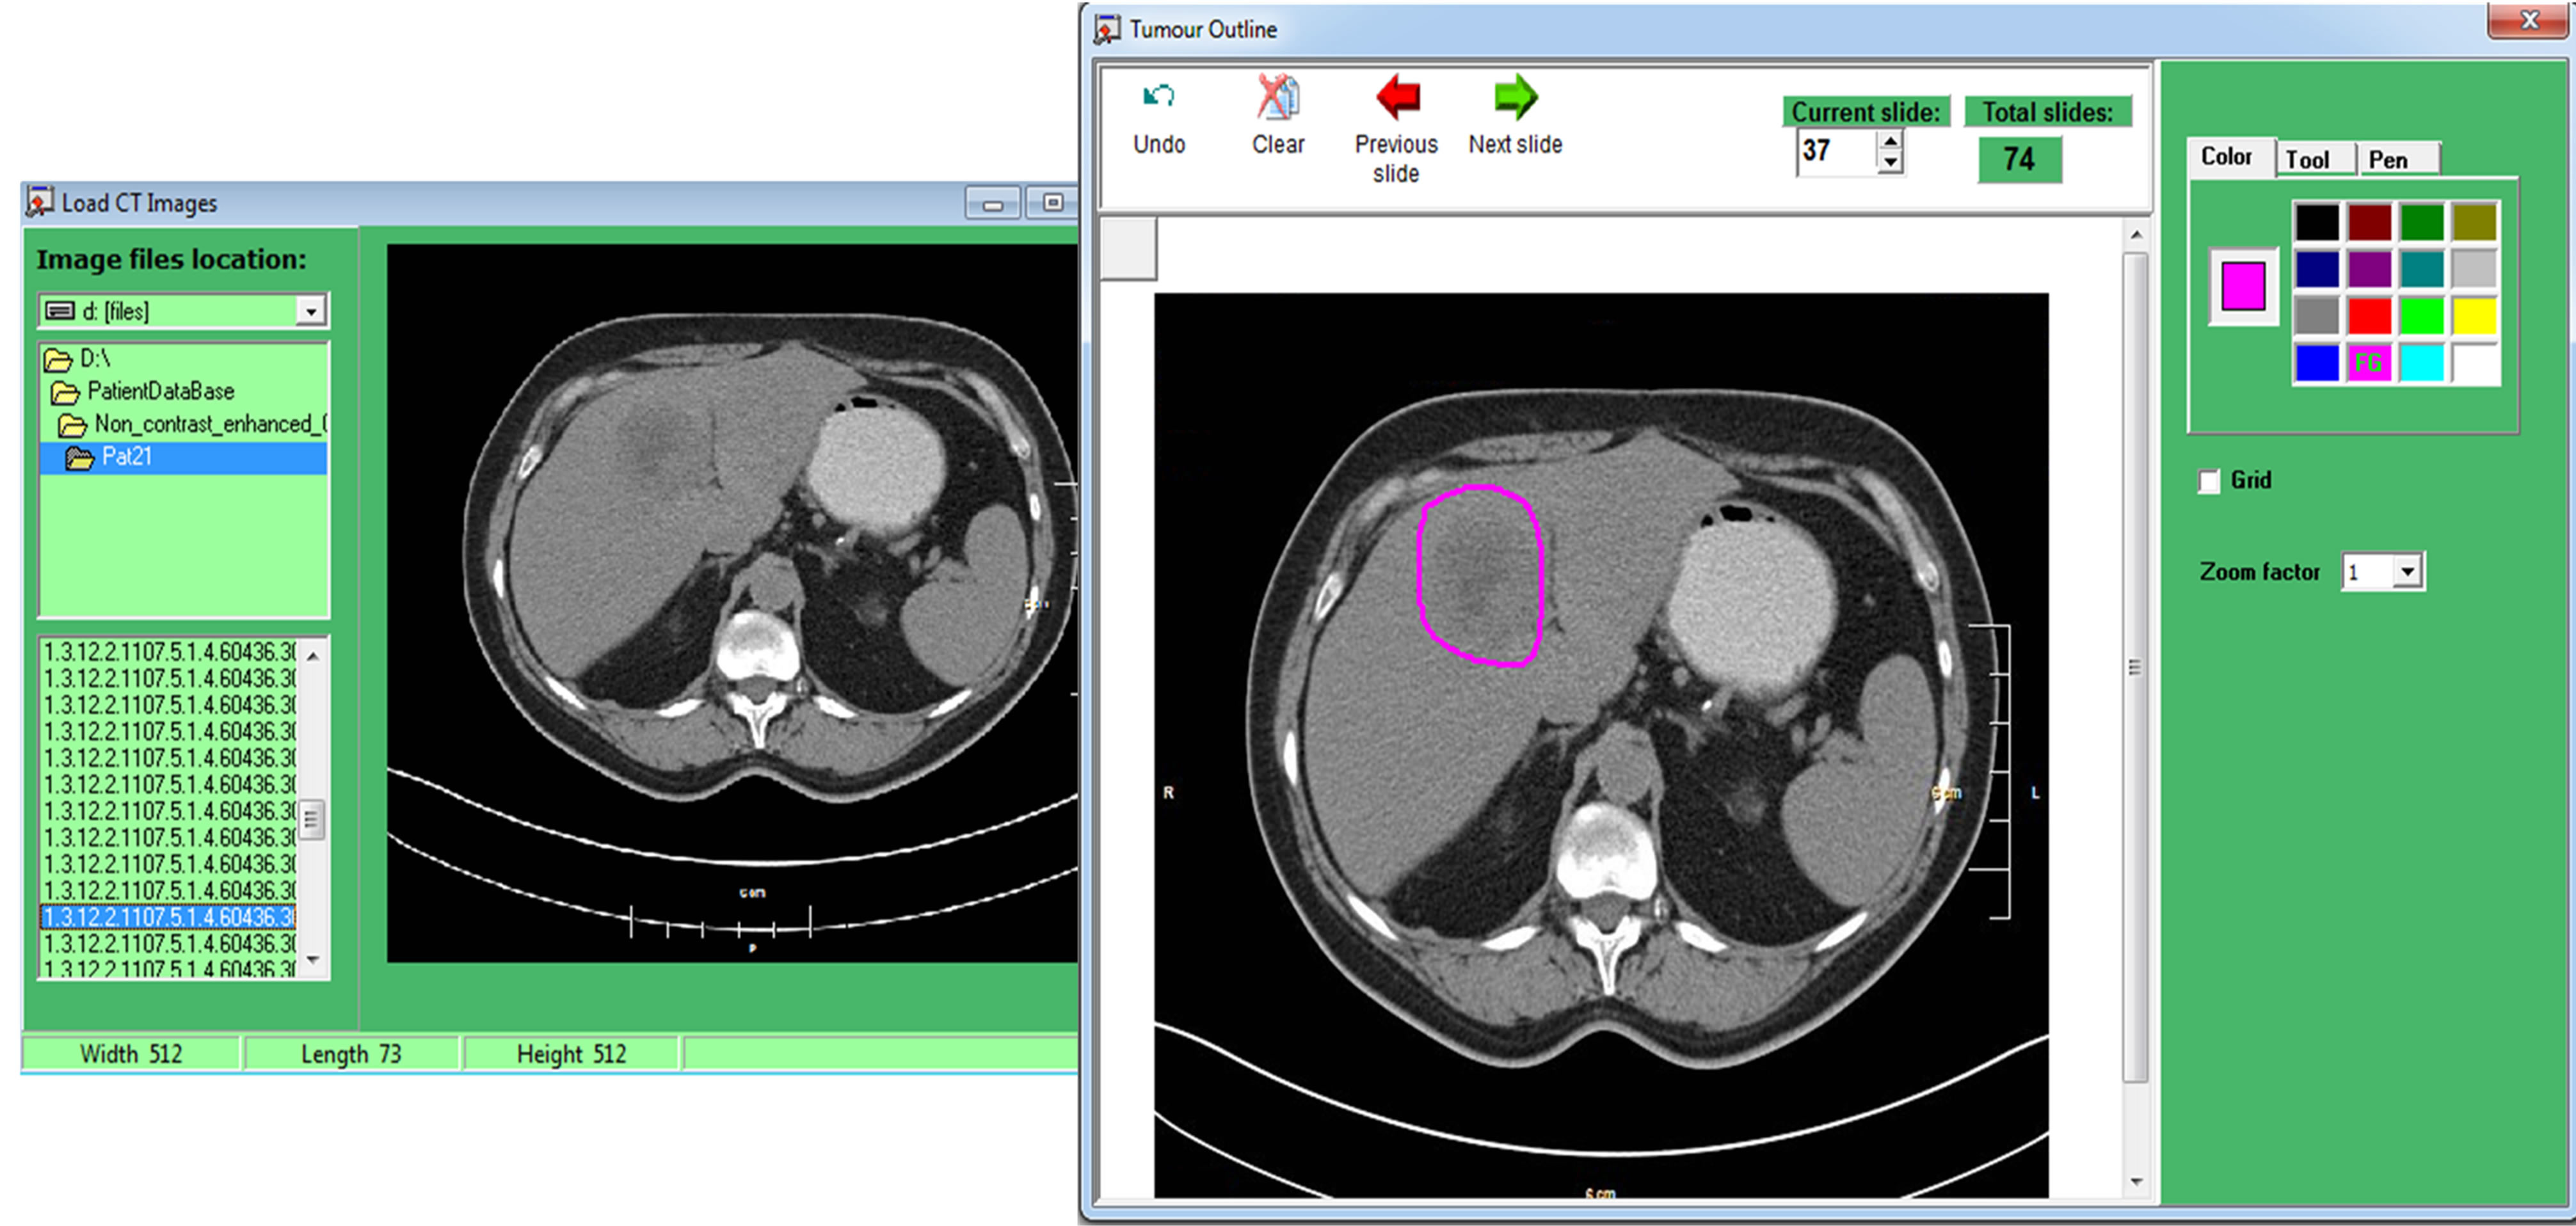
Figure 3. A screenshot from the software module for tracing of liver and tumor boundaries.
(a) (b) (c) (d)
Figure 4. Liver segmentation in a case of a 65 years male with a severe alcohol induced steatohepatitis: (a)-(c) show three subsequent CT slices with outlined liver boundaries, (d) shows liver volume visualization. First row—regions selected by the surgeon. Second row—automatically outlined regions by applying the algorithm in Figure 2.
(a) (b) (c) (d)
Figure 5. Liver segmentation in CT images of a 52 years male with a single site metastatic disease from mucinouse G3: (a)-(c) show three subsequent CT slices with outlined liver boundaries, (d) shows liver volume visualization. First row—regions selected by the surgeon. Second row—automatically outlined regions by applying the algorithm in Figure 2.
parallel made in Figure 4 concerns three consecutive CT slices. As it is seen from the comparison, the proposed algorithm was successfully applied to outline the shape of the liver in different slices. The automatically extracted volume was 1430 ml, while the manually selected was 1470 ml, resulting in a difference of 2.72%. The algorithm computes the liver volume with adequate accuracy.
Figure 4 presents a case of a patient that could be challenging for clinical evaluation and liver imaging. The computer based imaging tool can prove very useful in these cases, as seen from this figure. In some cases, the automatic selection performs even better than the manual approach, according to the surgeons’ opinion.
Another example for testing and validation of the algorithm is shown in Figure 5 for the case of a 52 years male with a single site metastatic disease from mucinouse G3, with a rectal cancer after primary tumor radical surgery with no extrahepatic tumor load of the body. Liver resection is necessary to be performed after neoadjuvant FOLFOX 4 + bevacizumab triple systematic treatment.
For this case, the liver segmentation was performed on a set of 132 patient abdomen CT slices, 60 of them with liver appearance. The comparison of three consecutive CT slices for both approaches showed satisfactory results for the automatic segmentation method and the estimated liver volume. In particular, the automatically extracted volume was 1420 ml, while the manually selected was 1500 ml, resulting in a difference of 5.33%.
The algorithm has been successfully applied to various sets of CT data extracted from non-contrast liver CT scans with and without pathologies. In all cases, the algorithm achieved satisfactory results in terms of correct selection of liver regions as well as in calculation of the volume. The obtained average deviation of 4.5% between the automatic liver segmentation and the manual approach has also been discussed with the surgeons. They pointed out that such a deviation is more than acceptable, as well as they agreed that the manual outlining, used as a reference, is not always performed to a maximum level of image details, which can explain the difference. The common opinion is that the software tool saves time and gives sufficient enough accuracy for the surgeon planning the operation. The computational time for applying the algorithm was about two-to-three minutes (using medium computational power PC), while the experts required on average 25 minutes to trace and calculate the liver volume.
3.2. An Example of Use
The software application is now installed and used by the surgeons from the University Hospital of Varna for their assessment and training of young specialists. We demonstrate one example of this application within the case of tumor resection and decision-making.
A 57 years old male with hepatitis C virus liver cirrhosis Child B with malignant transformation in two focuses of hepatocellular carcinoma in left liver lobe. The input patient data were taken from an abdomen CT patient set composed of 137 slices, 60 of them with liver presence. The volume of the liver was reconstructed by applying the algorithm and in consequence the surgeon performed a virtual resection of the tumor volume. The estimated liver volume was 1550 ml. Figure 6(a) shows two consecutive slices with tumors that were marked for resection, while Figure 6(b) reviews the reconstructed liver volume with the cancer. The tumor volume was estimated to 50 ml, while the evaluated RRLV was 96%. The patient was indicated for laparoscopic left lobectomy after preoperative downstaging of impaired liver function to Child A and control of viral load due to hepatitis C infection.
While detecting all metastases, even the smallest one is essential for building of oncosurgical strategy for radical treatment and it is crucial for removal the tumor load of human body with R-0 index—no residual tumor after surgery. This example also demonstrates the feasibility of this framework for the exercising of last year students in the Medical Universities.
The tool has been evaluated positively by the Department of Surgery at the University Hospital of Varna. Until now, the surgeons were evaluating the liver volume and the resection volume mainly subjectively and intuitively. This is primarily due to lack of experience to manage image processing software applications and to handle programming codes for overall calculation of the selected pixels and respectively the volume itself. The tool has been designed not to replace but to facilitate the surgeons, thus the requirements of minimal involvement, easy to use, fast volume evaluation have been respected.
4. Conclusions
An approach and an application tool for assessment of the liver volume and evaluation of the residual function of the liver prior to the intervention of the surgeons dedicated for patient with chronic kidney disease are proposed. The approach includes volume determination based on segmentation of liver from non-contrast enhanced computed tomography images, virtual tumor resection and estimation of the residual liver function and volume rendering. The tool relies on by robust technique for liver segmentation. It allows the surgeons objectively to evaluate the liver volume and the residual functional
(a) (b) (c)
Figure 6. An example of a liver with cirrhosis Child B with malignant transformation in two focuses of hepatocellular carcinoma in left liver lobe: (a) two consecutive tomographic images with observable multiple synchronous colorectal liver metastases; (b) reconstructed liver volume with the cancer.
ity when the tumors are removed interactively.
Furthermore, besides its application as an assisting tool to facilitate the decision-making, this tool appears to be appropriate for educational purposes as a teaching tool for medical students specializing in this area as well as for virtual training of young surgeon specialists.
Acknowledgements
This work is partially supported by Marie Curie Career Integration Grant within the 7th European Community Framework Programme, PHASETOMO (PCIG09-GA- 2011-293846).