Flow Injection Amperometric Determination of Phenol and Chlorophenols at Single Wall Carbon Nanotube Modified Glassy Carbon Electrode ()
The two main classes of CNTs are single-walled carbon nanotubes (SWCNTs) and multi-walled carbon nanotubes (MWCNTs). SWCNTs are sp2 hybridized carbon that possesses a cylindrical nano-structure that has only one single layer of graphene cylinder [8]. SWCNTs can be classified as either semi-conducting or metallic allotropes depending on the chirality [2]. MWCNTs have a complex structure with each carbon layer having different chiralities and electronic properties and consist of several layers of graphite cylinders that are concentric tubes encircling one another [4]. CNTs have attracted increasing interest in the application of CNTs based sensors in the detection and determination of phenols and phenolic compounds [3,9-12]. Phenolic compounds include a large class of compounds that are common in nature. They are widely distributed in fruits and vegetables with varying phenolic content [13]. They are partly formed as a result of biodegradation of natural compounds like humic acids, tannins and lignins. Phenolics are a complex group of substances that provide flavor and color characteristic of food, since most of them occur in food products. Many of the benefits associated with consumption of phenolrich foods are associated with their antioxidant activities which are determined by their reactivity as hydrogen or electron donating agent [14-16]. Phenols and phenol derivatives are commonly used in the manufacture of dyes, plastics, drugs, explosives, detergents, paper mills and in the petroleum industry. They are used to manufacture chemicals that are used as preservatives for woods, textile and leathers [17] and have a considerable application in agriculture as herbicides, insecticides and fungicides. Most phenolic compounds, especially chlorophenols and nitro phenols, are toxic, highly resistant to biological degradation and persistent in the environment. Chlorinated phenols such as 2-chlorophenoll, 2,4-dichlorophenol, 2,4, 6-trichlorophenol and pentachlorophenol are toxic and possess carcinogenic and immunosuppressive properties [18]. As a result, the United State Environmental Protection Agency (EPA) and the European Union have included these phenolic compounds in their list of primary pollutants [19-21].
The applications of phenol and its derivatives represent potential source of pollution and are usually found in waste waters’ effluents from different factories using phenolic compounds and manufacturing petrochemicals [17, 22]. Phenol contamination of water bodies also has serious environmental implications because of the damaging effects it has on aquatic organisms [22] including algae and aquatic spermatophytes. Phenolic derivatives are released to the environment, and their identification and quantifications are of great importance in environmental monitoring.
Various methods, such as high-performance liquid chromatography with different detectors, liquid chromatography-mass spectrometry, gas chromatography mass spectrometry, capillary electrophoresis and fluorometry, have been reported for the determination of phenols and phenol derivatives [15,17,18,23-30]. These conventional methods are sensitive, reliable, specific and precise. In spite of their advantage, most of these techniques need expensive instrumentations, require skilled technicians and are time-consuming, and some require derivatization procedures.
The sensitive, rapid and precise determination of phenols and its derivatives is of growing interest in environmental control and protection. Flow injection analysis (FIA) has been widely used for the determination of phenolic compounds because of its outstanding features of high sampling rate, small sample volumes, good accuracy and precision of results, high reproducibility, high versatility, high robustness and easy automation [31-33]. A number of research out-puts were published on the amperometric detection of phenol and its derivatives using tyrosnase (Tyr) [31,34], laccase [35,36], horse-radish peroxidase [37,38], as well as poly phenol oxidase based electrochemical sensors coupled with flow-injection analysis for the determination of phenol and phenol derivatives. These enzymes were either individually immobilized or a composite multienzyme system immobilized on conventional electrodes to determine phenolic compounds [39]. The analytical performances of enzyme based biosensors strongly depend on the immobilization procedure and accuracy, sensor-to-sensor reproducibility and operational life times and are drastically affected by enzyme stability [40]. The poor biocompatibity and low capacity for immobization of these enzymes also result in inefficient performance of some biosensors [41].
To our understanding, CNT modified electrodes for the determination of phenols and chlorophenols as an electrochemical sensor for flow injection amperometric analysis system have not been reported. The simplest electrochemical flow detector, SWCNT modified GC electrode, was developed successfully for the determination of phenols and chlorophenols. The parameters such as operational potential, pH and flow rates were investigated and optimized.
2. Experimental
2.1. Reagents and Apparatus
SWCNT was obtained from Saarchem Holparo Analytical (Pty) Ltd. Phenol, 4-chlorophenol, 2,4-dichlorophenol, 2,4,6-trichlorophenol, and pentachlorophenol were purchased from Fluka (Buchs, Switzerland). Acetic acid and DMF were obtained from (Merck). O-nitrophenol was from Riedelde Haen and other chemicals were obtained from SAAR-CHEM, Republic of South Africa (RSA). Helium gas (Air Products, RSA) was employed for the de-aeration of the carrier solution. All chemicals were analytical grade and were used without further purifications. Ultrapure water of resistivity 18.2 MW·cm was obtained from ELGA PURELAB Option-Q (UK) water purification system and was used throughout.
Electrochemical measurements were performed using Epsilon Electrochemical Analyzer (BASi) attached to BAS C2 cell stand (BASi Instrumentation, USA). A conventional three electrode cell was used for measurements, with a bare glassy carbon electrode (3 mm diameter, BASi) or SWCNT/GCE used as the working electrode, Ag/AgCl (3 M NaCl) (BASi) as the reference electrode and a platinum wire auxiliary electrode (BASi). The flow system consisted of a BAS pump (Model PM-92E; USA), a sample injection valve, and a thin-layer electrochemical detector (BASi LC-4C, USA), with a flow-through cell. The electrochemical detector was connected to the Epsilon Electrochemical Analyzer. Two GCE modified with SWCNT (in series configuration) were used as working electrodes, while Ag/AgCl electrode (3 M NaCl) (RE-1; BAS) served as the reference electrode. The counter electrode was the bulk plate of the cell, made of stainless steel. The thickness of the layer in the cell was 0.0127 cm. The pH of the solutions was measured using HANNA HI 8314 pH-meter.
2.2. Fabrication of SWCNT/GCE
The modified working electrode, SWCNT/GCE, was prepared by dispersing SWCNT in DMF (1 mg: 1 mL ratio) and sonicated with ultrsonication water bath for an hour [42]. Before surface modification, the bare glassy carbon electrode was polished with a 0.3 and 0.05 mm alumina slurry and washed with distilled water several times and sonicated for 3 minutes. The SWCNT film was prepared by casting a 20 μL of the dispersed solution over the bare GCE and dried overnight at room temperature.
2.3. Measurements
For the voltammetric measurements, 10 mL solution that contain 1 × 10⁻⁴ M phenol and chlorophenols, in a 0.1 M acetate buffer supporting electrolyte, were transferred to the cell. The cyclic voltammetry experiments were run after stirring the spiked solution for 30 seconds. The measurements were performed by scanning the potential from 0 to 1.2 V and back at a scan rate of 50 mV·s−1 for all the studied phenols. A 0.1 M sodium acetate buffer was also used as a carrier solution in the flow through experiments after de-aerating the solution with helium gas. A 20 μL of the sample solutions were injected at every experimental run.
3. Results and Discussion
3.1. Electrochemical Characterization of Phenol at SWCNT/GCE
The electrochemical characteristic of phenol at a bare glassy carbon electrode was studied using cyclic voltammetry. Figure 1 shows subsequent current/potential curves recorded for 1 × 10⁻⁴ M phenol in a 0.1 M sodium acetate buffer (pH 6.0) in the potential range of 0 to 1.2 V. Due to the electro-deposition of non-conductor oxidation product of phenol i.e. polymers [43-45], the oxidation peak at the bare glassy carbon electrode decreased markedly with successive cycles. The response disappeared totally after three cycles owing to the adsorption of phenol oxidation products which decrease the available electrode surface area. Normally the oxidation of phenol produces conducting monomers and non conducting polymer as shown by Scheme 1, which is responsible for such electrode fouling [46,47].
In the absence of phenol, only with the sodium acetate buffer solution, the bare GCE Figure 1(a), and SWCNT/ GCE, Figure 1(c) showed no oxidative or reduction peak, while the back ground current at SWCNT/GCE is much larger than the bare electrode. This indicates that the SWCNTs increased the effective surface area of the modified electrode [9] and also proved that SWCNTs have been successfully immoblized onto the bare electrode surface. For 1 × 10⁻⁴ M phenol solution of Figure 1(b), the voltammogram at the bare GCE showed irreversible behavior with Epa = 0.851 V [46], and at the SWCNT/ GCE there was also an irreversible peak, Figure 1(d), with Epa = 0.686 V with about twelve times intensified peak current compared to the bare GCE. This indicates that SWCNTs can greatly enhance the electron transfer rate, with significantly reduced over-potential. This implies that the SWCNTs show excellent electrocatalytic effect towards phenol oxidation.
On the other hand ten successive cyclic voltammetric curves of phenol recorded at SWCNT/GCE as shown in Figure 2 demonstrate a quite interesting behavior. During the first positively going scan, phenol undergoes oxidation in a single step, peak 1a, at Ep1a = +0.69 V. On the negative going scan, two reduction peaks occurred, peak 3c, at Ep3c = +0.36 V and peak 2c, at Ep2c = +0.10 V.
The cathodic peak corresponds to the reduction of the two phenol oxidation products, ortho-quinone to orthophenol (catechol), peak 3c, and para-quinone to paraphenol (hydroquinone), peak 2c, Scheme 1 [12,46]. The second scan in the positive potential direction shows two anodic peaks: peak 2a at Ep2a = +0.13 V, and peak Ep3a = +0.39 V, indicating the reversibility of the two peaks [46, 12]. This shows that the electroxidation path way of phenol at the modified electrode is different from that of the

Figure 1. Cyclic voltammograms: 0.1 M acetate buffer pH 6 base electrolyte at bare GCE (a); 0.1 M acetate buffer pH 6 base electrolyte at SWCNT/GCE (c); 1 × 10⁻⁴ M phenol at bare GCE (b); and 1 × 10⁻⁴ M phenol at SWCNT/GCE recorded at Scan rate, 50 mV∙s−1; pH 6.

Scheme 1. Phenol electro-oxidation and polymerization processes [12].
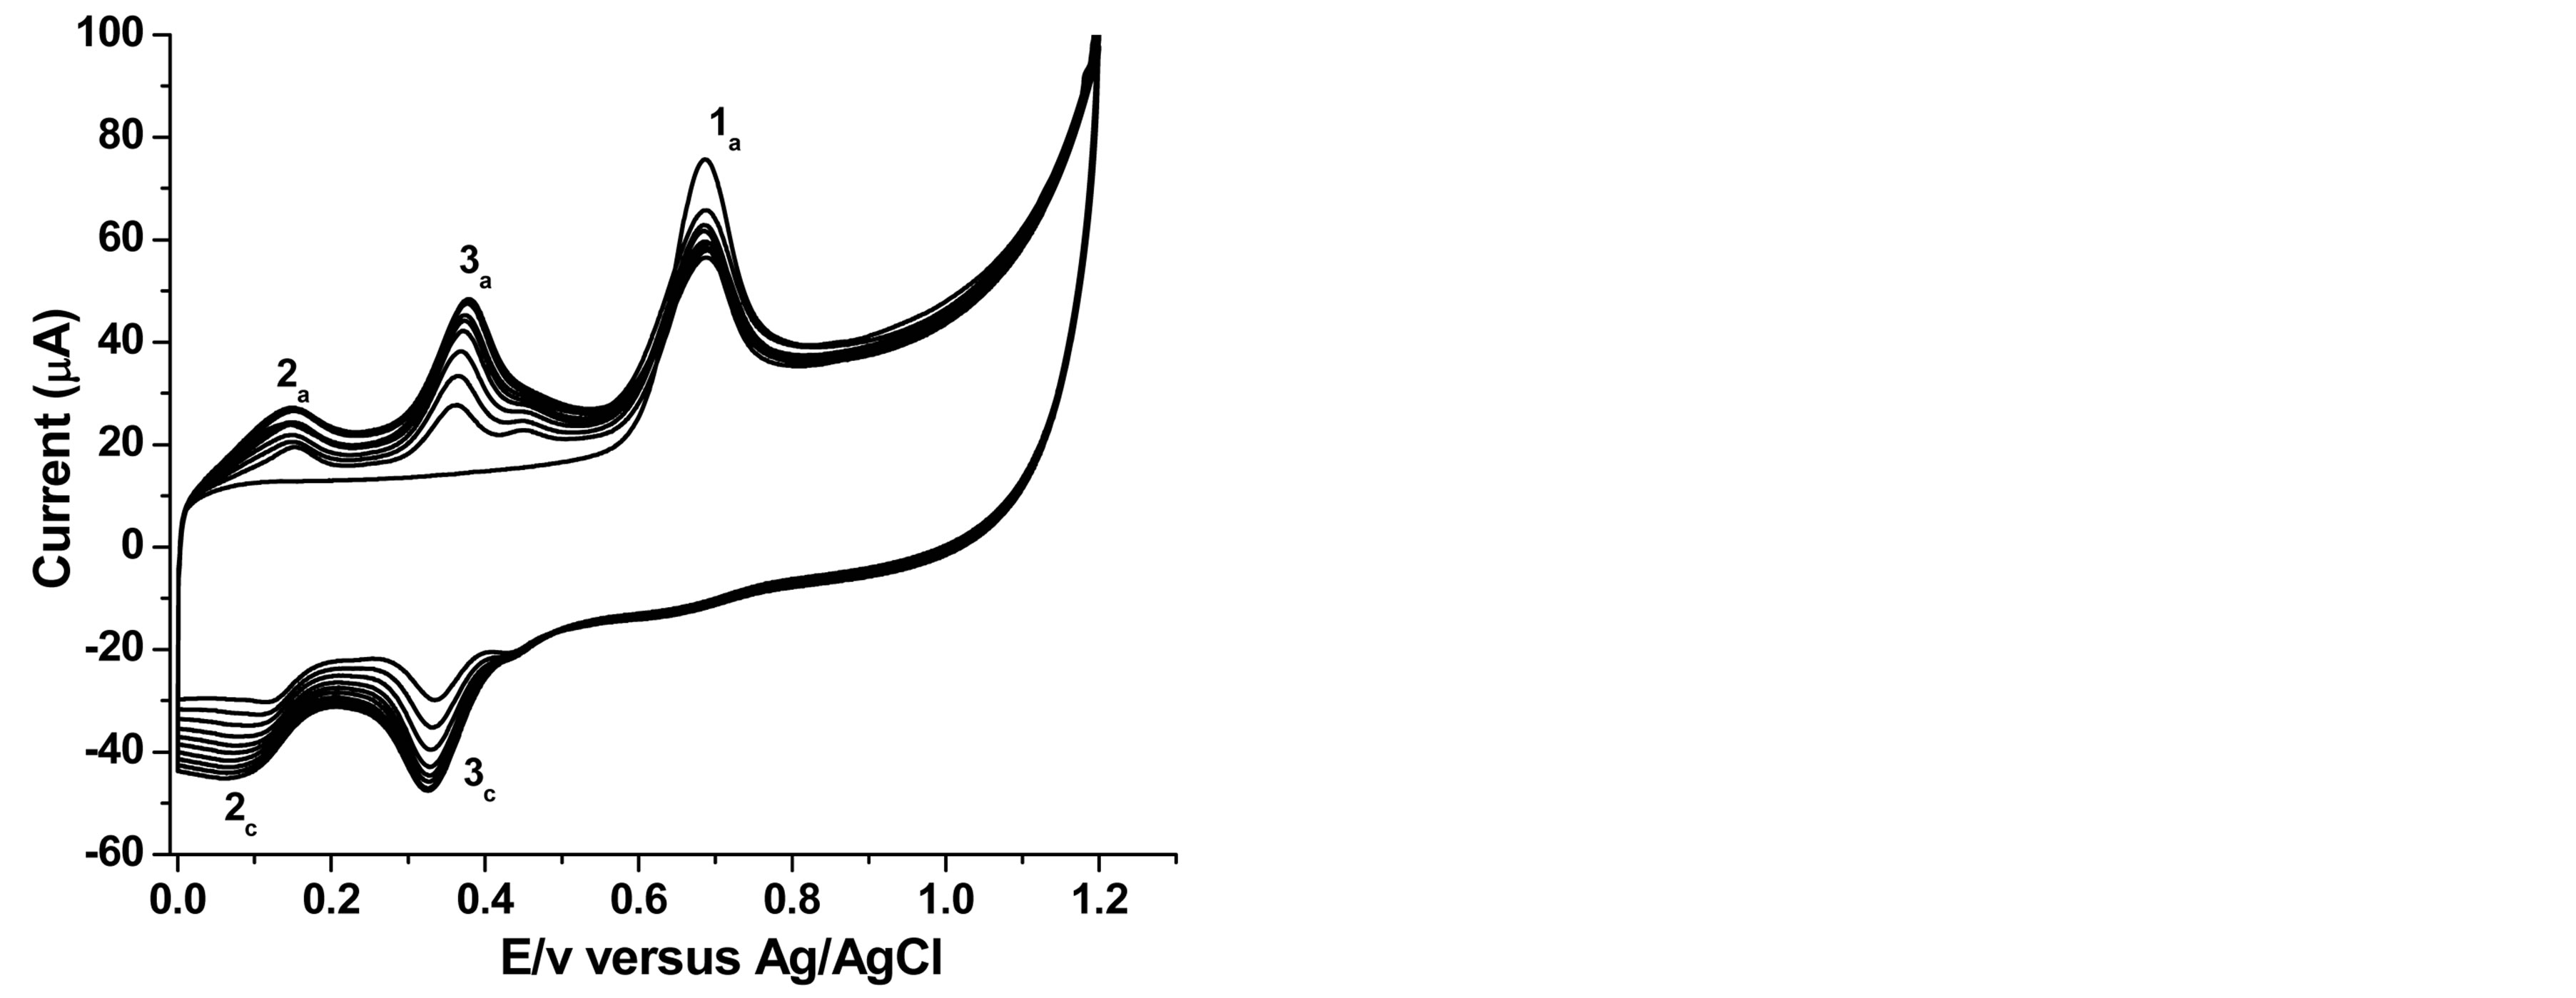
Figure 2. Overlay of 10 successive cyclic voltammograms for 1 × 10⁻⁴ M phenol at 50 mV∙s−1.
bare GCE. At the modified electrode, unlike at the bare GCE, the oxidation peak current of phenol 1a shows a small decrease in intensity after the first scan, but is then practically remains constant for the subsequent 8 scans. The peak potential observed ranged between 0.685 - 0.690 V versus Ag/AgCl and this makes it suitable to be used as an electrochemical flow through detector for the determination of phenol and chlorophenols in flow injection system.
3.2. Flow Injection Analysis
The electrochemical performance of the glassy carbon electrode modified with SWCNT was studied in 0.1 M acetate buffer solution using flow injection analysis. The parameters optimized to determine phenol and chlorophenols were: potential, flow rate and pH. For comparison, similar experiments were carried out using bare GCE during potential optimization.
3.2.1. Effect of Potential on the Response of SWCNT/GCE Electrode
The influence of the applied potential on the amperometric responses of the two electrodes for phenol and chlorophenols was examined using flow injection system. Figure 3 shows the hydrodynamic voltammograms obtained at bare GCE and SWCNT/GCE for 1 × 10⁻⁴ M phenol and chlorophenols, respectively. The influence of the applied potential on phenol and chlorophenols oxidation was studied over a potential range of 0.1 - 1.0 V. The maximum oxidation potential observed was between 0.6 and 0.8 V. This was similar to the maximum current observed between 0.65 to 0.80 V for 2,4,6-trichlorophenol [47]. As it is shown in Figure 3, the effect of the SWCNT/GCE can be clearly seen by the significant increase of the peak current compared to the bare GCE. Such effect is attributed to the fast electronic transfer offered by SWCNT which enhances the oxidation of phenols and chlorophenols [8,48]. The bare glassy carbon electrode responded favorably only to the first three injections with low amperometric current and exhibited a poorly defined response as reported [9].
3.2.2. Effect of pH on the Response of SWCNT/GCE
The effect of pH on the performance of GCE modified with SWCNT was evaluated by using 0.1 M acetate buffer solution over the pH range of 3 - 10 for phenol and chlorophenols. For each analyte the amperometric response was recorded at a fixed potential. The result shows that, (Figure 4), the amperometric response increases with increasing pH until it reaches the range of pH 6 to 7.5, where the higher peak current values were observed. The highest peak current for 2,4,6-trichlorophenol was observed at about pH 9. The current decreases as the pH increases. The optimum pH range that gave maximum current is similar to that previously reported for both enzymatic and mediated electrochemical reactions at carbon nanotubes [49], a screen-printed sensor based on immobilization of laccase, peroxidase, and tyrosinase for monitoring phenols [39,50] and a wide optimum pH of 5 - 8 for free enzyme [51]. It seems that the SWCNT/GCE composite has not altered the optimum pH of phenol and chlorophenols oxidation significantly. For further studies, pH of 7 for phenol and pentachlorophenol, pH 6 for 4-chlorophnol and 2,4-dichlorophenol and pH 9 for trichlorophenol were selected, respectively.
3.2.3. Effect of Flow Rate on the Response of SWCNT/GCE
One of the basic parameters which influence the performance of flow injection analysis is flow rate. The flow rate affects detection limit, sensitivity, and accuracy of analysis. The influence of flow rate on the amperometric signal was examined in the 0.1 - 2.0 mL∙min−1 range for all analytes at SWCNT/GCE. To investigate the effect of flow rate, 20 µL of 1 × 10⁻⁴ M phenol and chlorophenols were injected at various flow rates. The applied potential

Figure 3. Dependence for 1 × 10⁻⁴ M solutions of the current response in FIA on the applied working potential at GCE (B) and SWCNT/GCE (A), 2,4,6-trichlorphenol (TCP), 2,4-dichlorophenol (DCO), 4-chlorophenol (CP), pentachlorophenol (PCP) and phenol: Flow rate, 1.0 mL∙min−1; carrier solution: sodium acetate buffer (0.1 M); pH 6, injection volume 20 µL.

Figure 4. Variation of amperometric current responses with pH at the SWCNT/GCE for 1 × 10⁻⁵ M phenol and 1 × 10⁻⁴ M for the others; and Eapplied for phenol (0.725 V), for 2,4- dichlorophenol (0.75 V), for 2,4,6-trichlorophenol, (0.7 V), and for pentachlorophenol, (0.8 V), vs Ag/AgCl; flow rate 1 mL/min, injection volume 20 µL.
was constant for each analyte. As it is shown in Figure 5, similar trends were observed for phenol and all chlrophenols. It can be seen that the peak current increases in the range of 0.1 - 1 mL∙min−1. At low flow rates, the mass transfer of phenolic analytes to the electrode surface is relatively low [52]. Also a broader peak and low resolution were observed. For relatively high flow rates there was a decrease in the flow-injection peak current which is similar to the usual behavior for enzyme-based FIA [50]. At higher flow rates, above 1.2 mL∙min−1, the electron transfer and mass transfer rate are not significantly different. Moreover as the sample passes faster over the electrode the smaller is the fraction of analyte oxidized [36] and as a result the amperometric current
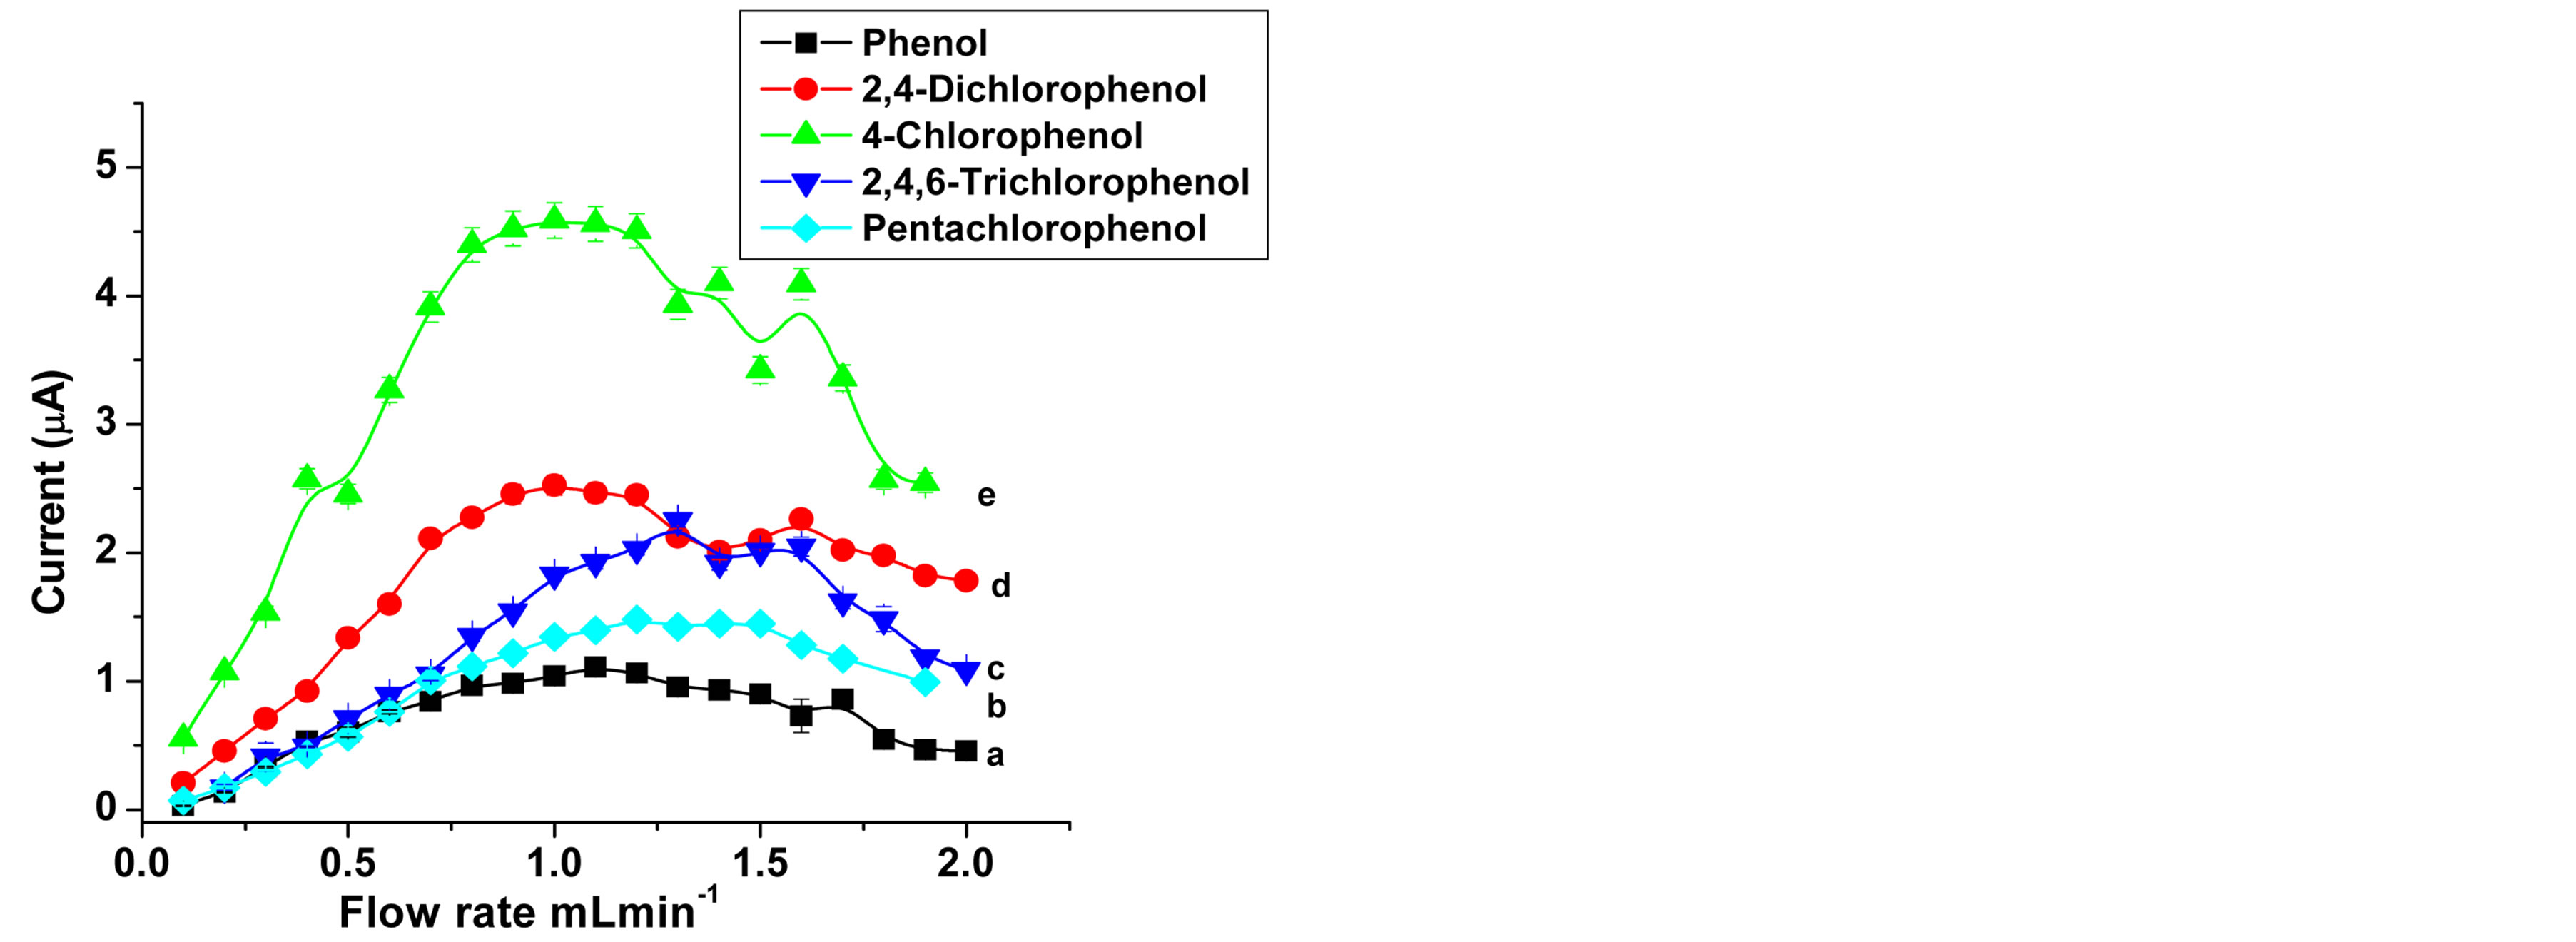
Figure 5. Flow rate dependence of the peak current in FIA: (a) for 1 × 10⁻⁵ M Phenol at pH 7, Eapp, 0.725 V, (b) 1 × 10⁻⁴ M Pentachlorophenol at pH, 7; (c) 2,4,6-Trichlorophenol with at pH 9; (d) 2,4-Dichlorophenol pH 6; (e) 4-Chlorophenol, at pH 6; Eapp as in Figure 4; Carrier, 0.1 M sodium acetate.
decreases. The optimum flow rate of the carrier solution for acceptable sharp peaks and sensitivity were in the range of 0.9 and 1.2 mL·min−1.
3.2.4. Stability of SWCNT/GCE
The performance of the SWCNT/GCE as a flow injection detector was found to be remarkably good and the amperometric response of the sensor showed a good stability, since after 20 injections the response remains the same. Figure 6(a) shows the amperometric response measured for 2,4,6-trichlorophenol. At each step 20 µL of: 8 × 10⁻⁶ M phenol and 4-chlorophenol, 1.5 × 10⁻⁵ M 2,4-dichlorophenol, 1 × 10⁻⁴ M 2,4,6-trichlorophenol and 1 × 10⁻⁵ M pentachlorophenol, were injected. Figure 6(b) shows the operational stability of the amperometric peak current,
 (a)
(a) (b)
(b)
Figure 6. Amperometric flow injection response of 2,4,6- trichlorophenol (a) and stability plot (b) obtained for 20 repetitive injections of 1 × 10⁻⁵ M phenol and pentachlorophenol; 6 × 10⁻⁵ M 4-chlorophenol; 1.5 × 10⁻⁵ M 2,4-dichlorophenol and 1 × 10⁻⁴ M 2,4,6-trichlorophenol at a flow rate: 1.1 mL∙min−1 for phenol, 1 mL∙min−1 for 4-chlorophenol and 2,4-dichlorophenol, 1.2 mL∙min−1 2,4,6-trichlorphenol and pentachlorophenol; Other conditions are as in Figure 5.
ip, for 20 successive injections of each analyte. The response had a relative standard deviation ranging between 0.94% and 3.20%, as shown in Table 1. These results are due to the fact that flowing liquid solutions continuously clean the surface of the cell and remove the reaction products and impurities leached from the electrode [33, 53]. This experimental results are in good agreement with the stability of CNT modified electrodes [53,54] and different enzymztic biosensor [36,50]. Such additional advantages of the flow injection method based on the SWCNT/GCE modified detector broaden the possibilities of determining different phenol derivatives.
3.2.5. Analytical Performance of the SWCNT/GCE Detector in the Flow Injection System
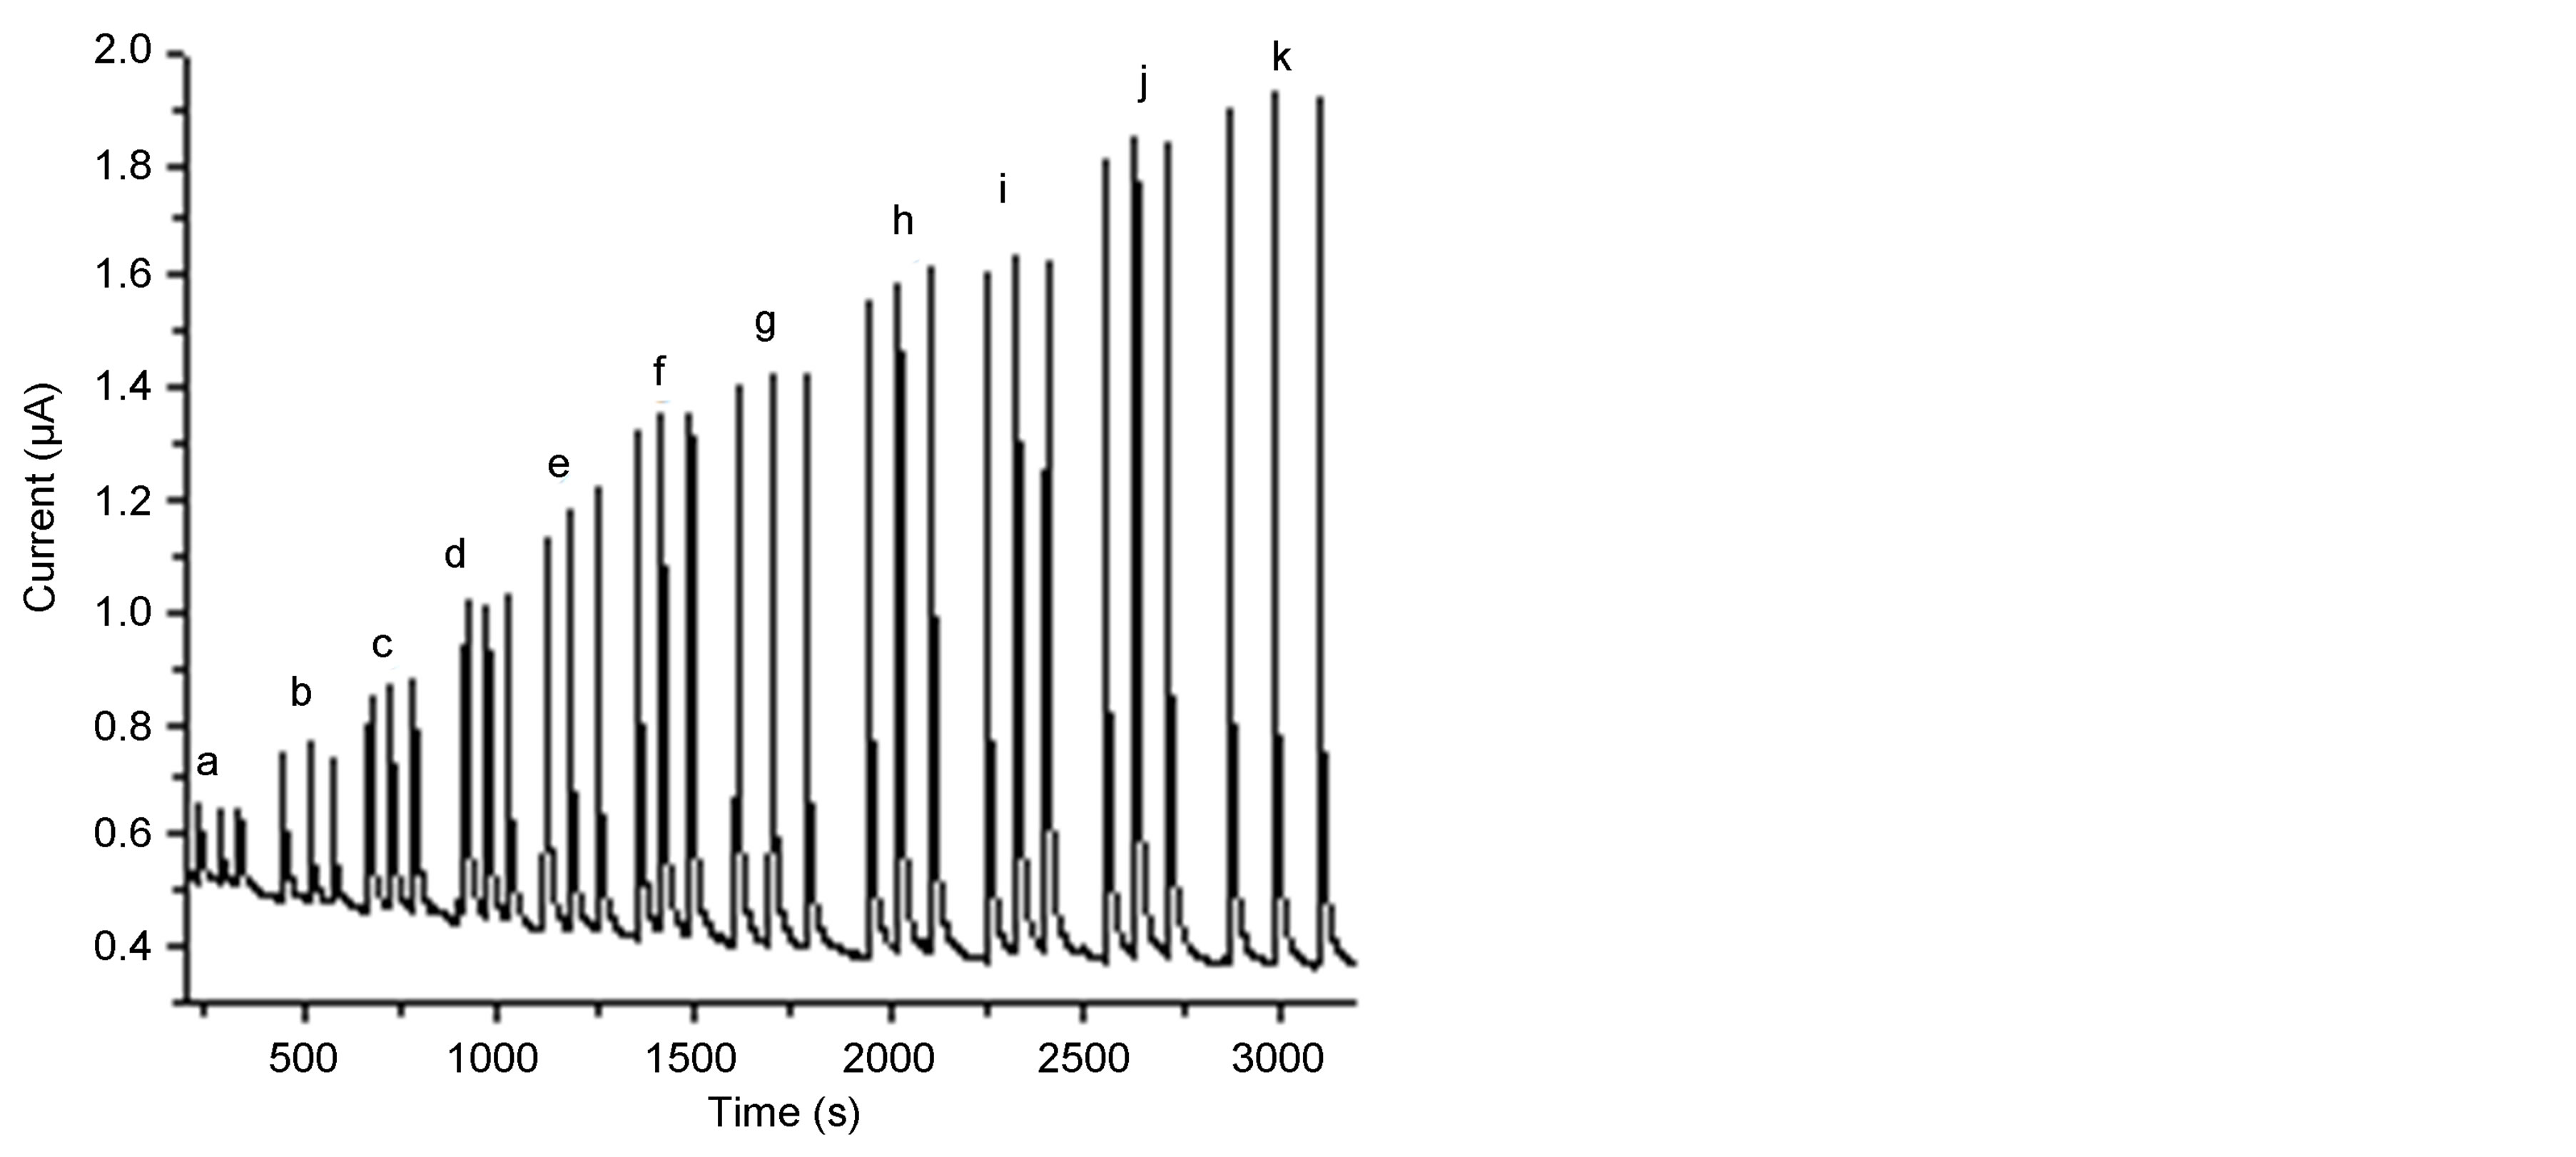
In flow injection analysis, the flow-through detection cell monitors the concentration-time profile of the analyte. The behavior of SWCNT/GCE modified electrode was investigated in flow injection for the determination of phenol and different chlorophenls under the optimized conditions. Increasing concentrations of phenol and chlorophenols were injected to the carrier solution (0.1 M sodium acetate). Figure 7(a) displays the amperometric response of the SWCNT/GCE for 4-chlorophenol and it can be seen that the peak current increases with increasing the concentration of 4-chlorophenol. This wellshaped amperometric peaks indicate that the surface sensing properties of the modified electrode were efficient and reproducible mass transport towards the electrode surface was observed which goes in line with [53, 55]. The amperometric peak heights increase with increase in the concentration of 4-chlorophenol. Figure 7(a) was used to construct the analytical calibration curves of the SWCNT/GCE composite electrode under the optimum experimental conditions for each analyt. Figure 7(b) shows the calibration curve for 4-chlorophenol. Table 2 summarizes the analytical characteristics of the calibration graphs. The limits of detection were calculated on the 3 sb/m, where m is the slope of the linear calibration graph for each analyte, and sb was estimated as the stan-
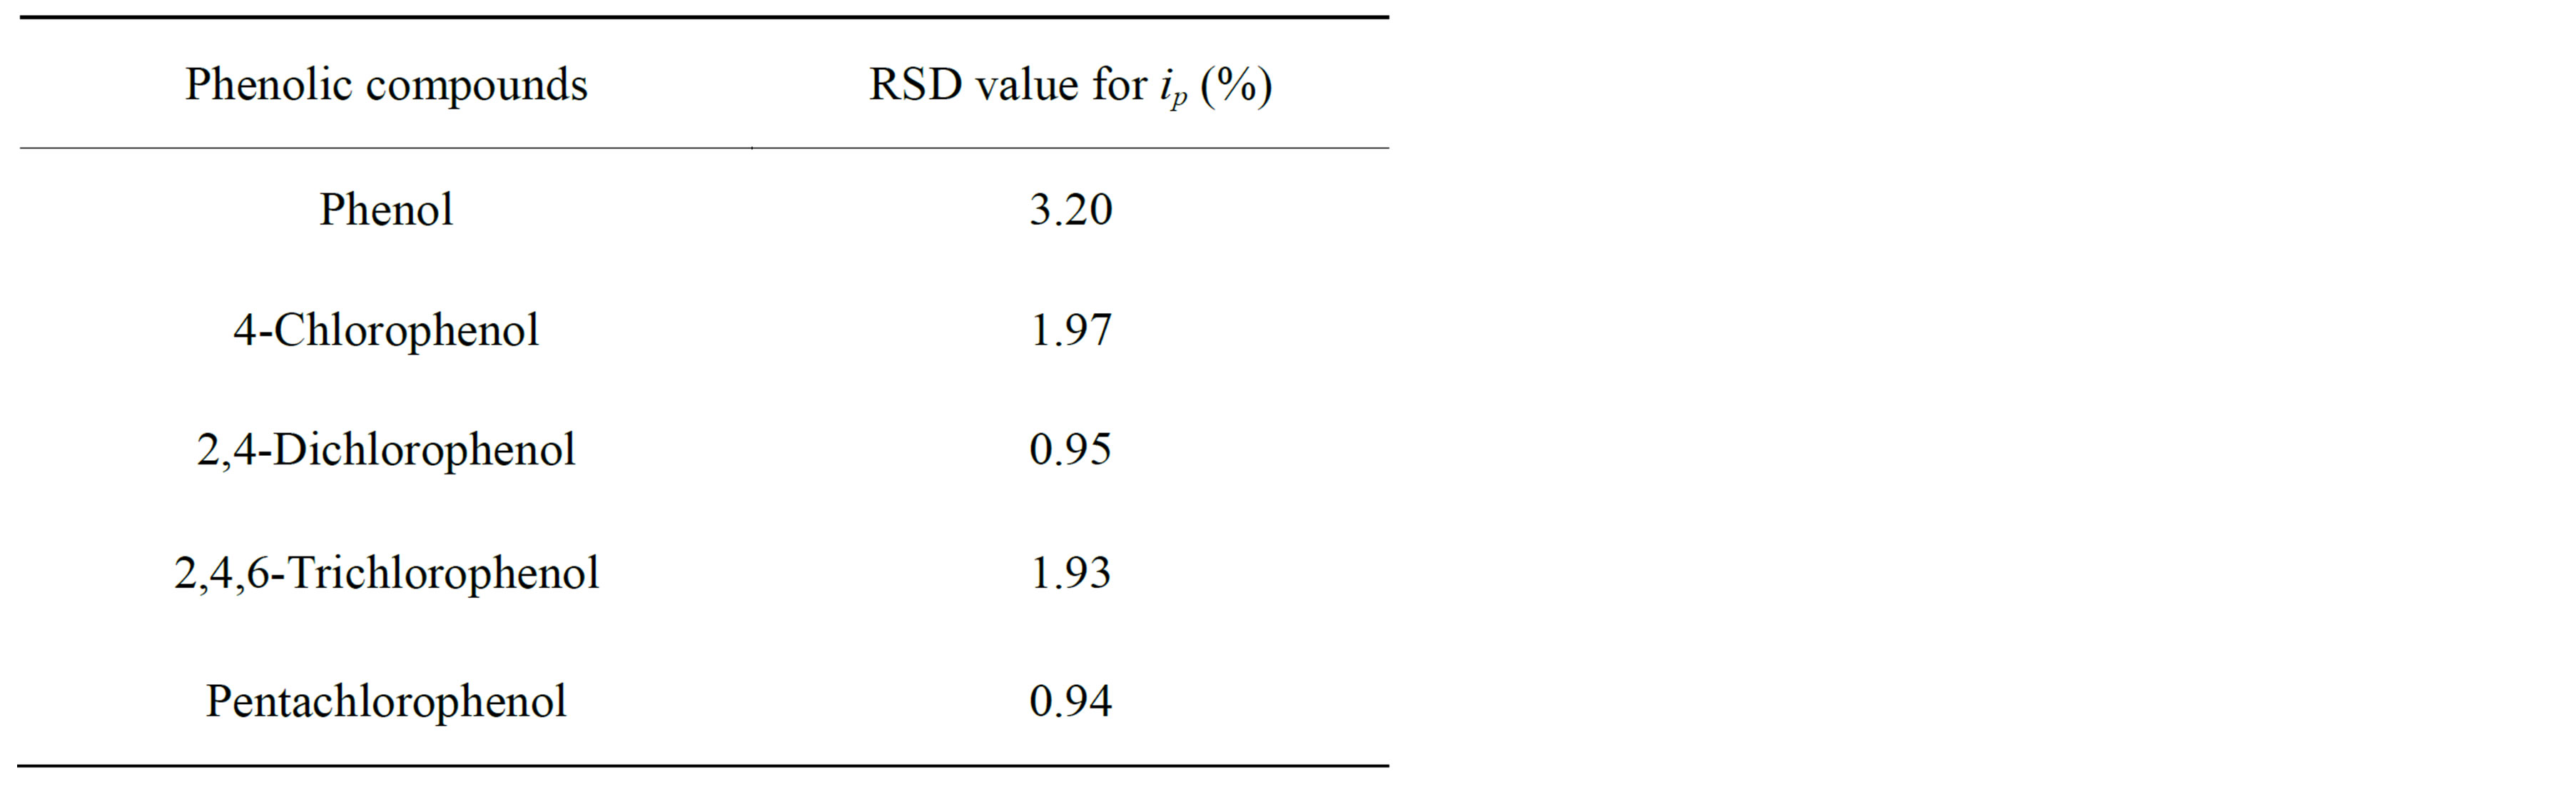
Table 1. Reproducibility of the stability measurements obtained with SWCNT/GCE in flow-injection analysis.

Table 2. Analytical characteristics of the calibration plots for different phenolic compounds in flow-injection system with the SWCNT/GCE detector.
 (a)
(a) (b)
(b)
Figure 7. Amperometric responses for different concentrations of 4-chlorophenol (a-k) of concentrations 2, 4, 6, 8, 9, 10, 12, 14, 16, 18, 20, 22 mM, respectively (a), and the calibration curves (b), Eapp, 0.8 vs Ag/AgCl; flow rate 1.0 mL∙min−1, pH, 6; carrier solution 0.1 M sodium acetate.
dard deviation (n = 10) of the response obtained from the repetitive analyte injections at the lowest concentration. Using this criterion, detection limits ranging between 0.011 and 0.31 mM were achieved. As summarized in Table 2, the SWCNT/GCE system used as a detector exhibits a good linear response between the amperometeric peak currents and concentrations of phenol and chlorophenols with low detection limits for all phenolic compounds investigated. The analytical performance of the SWCNT/GCE determined in the flow through system has been compared with other enzyme/enzymeless electrochemical sensors reported recently as shown in Table 3. Characteristics such as, range of linearity, sensitivity and limit of detection achieved and type of electrode were compared. It can be clearly seen from Table 3 that the SWCNT/GCE sensor offers advantages as compared to the other detector designs. Apart from the simplicity in its preparation its dynamic range for the detection of phenolic compounds is wider.
3.2.6. Interference Studies
The amperometric response of the SWCNT/GCE modified electrode for to 5 × 10⁻⁶ phenol was not affected by the addition of oand p-nitrophenol up to the concentration of to 5 × 10⁻⁴, which is in a ratio of 1:100. Above this concentration the peak current increases. Similarly the addition of the same concentrations of 4-chlorophenol, 2,4-dichlorophenol, 2,4,6-trichlorophenol and pentachlorophenol to 5 × 10⁻⁶ M phenol has no effect on the amperometric responses of the electrode. With further increase in the concentration of chlorophenols added an increase in the response current was also observed. These can be attributed to their similarity in the optimum operational conditions which resulted in the oxidation of phenolic OH group. In fact, the selectivity of most commonly used amperometric biosensors such as tyrosinase, laccase, and peroxidase, modified electrodes for phenolic compounds are relatively higher due to the use of low applied potentials [35]. The SWCNT/GCE modified electrode needs higher potential to be able to oxidize the phenol; therefore the risk of electro-oxidation interfering compounds in the sample is higher.
3.2.7. Analytical Application
The analytical applications of the modified electrode were investigated within the linear range. With phenol as the analyte the estimation of content was carried out by injecting a 2 μM phenol to deionizzed water. Increased concentrations of phenol were injected and the amperometric responses were recorded which were used for recovery calculations. As shown in Table 4 the recoveries were between 99.7% and 108.36%, which confirm the designed electrode used in the method is reliable for quantitative determination of phenol and chlorophenols.
4. Conclusion
In this paper, we presented one simple and low cost electrochemical sensor based on SWCNT modified GCE for the analysis of phenol and chlorophenols using flow injection amperometric methods. The SWCNT modified electrode has a great role in minimizing of surface fouling due to its high electrocatalytic activity. The analytical performance obtained after optimizing experimental variables was impressive, and the electrode has a good operational stability, linear range and detection limits. Although the sensor has limited selectivity for these analytes, the electrode is simple in its preparation.
Acknowledgements
Negussie Negash is grateful to the Graduate School of

Table 3. Comparison of analytical performance of the calibration curves of SWCNT/GCE with different modified electrodes for phenol, 4-chlorophenol, 2,4,6-trichlorophenol, and pentachlorophenol.
Addis Ababa University, for financial support and the National University of Lesotho for giving him the chance to use the resources and facilities of their research laboratory.
NOTES