Relationships between Earth’s Rotation or Revolution and Geographical Extent of the Global Surface Monsoons ()
1. Introduction
The monsoons influence the climates of India, Bangladesh, Southeast Asia, and, to a lesser extent, northern Australia and Central Africa. They are found in those regions where there is a complete seasonal reversal of easterly (or westerly) winds. Despite the interest shown by scientists in monsoons [1-20], many questions remain about the physical processes capable of generating complete seasonal reversal of the prevailing surface winds. In this work we want to develop a better description of the relationship between earth’s rotation-revolution with respect to sun and geographical extent of the global surface monsoons. In our previous work [21-24], we deduce from Clausius-Clapeyron relation derived in 1832 that, unlike the dry water vapor that can be assimilated to the ideal gas at all circumstances, the saturated water vapor has, in an air parcel at the same time very cold (temperatures below 0.0098˚C) and rich in moisture (vapor pressure above 6.11 mb), thermoelastic properties diametrically opposed to those of ideal gas (including dry water vapor). I.e., the two equal level surfaces of water vapor and temperature rating respectively at 6.11 mb and 0.0098˚C separate clearly parts of the troposphere where ideal gas assumption can be applied without too distort reality to parts of the troposphere where this assumption is banned. Therefore, everyone can now easily note with satisfaction that the presence of water substance in all three states in the earth’s atmosphere gives to troposphere the exclusivity of a General Circulation consisting of three groups of passive convective cells (Hadley, Ferrel, and Polar) on either side of the ITCZ. Knowing that the ITCZ oscillations on either side of the equators due to earth’s revolution determine the hemisphere’s seasons (mainly winter and summer), it is clear that earth’s revolution plays a crucial role in the seasonal reversal of the prevailing surface winds observed in the regions where monsoons occur. Our results will mainly be based on representation in either side of the ITCZ of the seasonal prevailing surface winds triggered by Coriolis force effects on Hadley, Ferrel and Polar cells.
2. Troposphere General Circulation Based on Atmosphere Dynamic Balance
2.1. Troposphere Dynamic Balance
Atmosphere dynamics uses precise concept of air particle [25-27]. Especially:
1) Few exchanges on molecular scale: it is easy to follow quantity of air which preserves certain properties.
2) Quasi-static equilibrium: at any moment there is dynamic balance, i.e., the particle has the same pressure as its environment (P = Pext).
3) No thermal balance: heat transfers by conduction are very slow and neglected. One can have T ≠ Text.
4) The horizontal sizes of the air particle can go from a few cm to 100 km according to the applications.
Taking into account the fact that the atmosphere is mainly composed of dry air and water vapor, the Dalton’s law connects the pressure (P) with the partial pressure of dry air (Pa) and saturated water vapor (ew)
 (1)
(1)
In deriving (P) with respect to the temperature, one has
 (2)
(2)
According to the Quasi-static equilibrium (or dynamic balance) the pressure of the parcel of air must be the same as that of the ambient air, including during sudden local changes in phases by water contained in this parcel. Reality that all meteorologists restore through the following famous sentence: the phases change takes place at constant pressure. Thereby write Equation (3),
 (3)
(3)
Equations (2) and (3) lead to the derivative of V compared to T
 (4)
(4)
Introducing the coefficient of thermal expansion of moist air at constant temperature
 (5)
(5)
Then the Fundamental Relationship of Atmosphere Dynamic Balance:
 (6)
(6)
One can also write equation of Atmosphere dynamic balance in terms of partial pressures
 (7)
(7)
Or,
 (8)
(8)
Relations (6) and (7) lead to a very important atmosphere Dynamics statement:
At any moment and throughout the atmosphere, one can use Equations (6) or (7) and Clausius-Clapeyron slope of the equilibrium curves in the eT-plane (Figure 1) to predict in which direction the air parcel will move (up or down) if its temperature increases or decreases. Table 1 and Figure 2" target="_self"> Figure 2 provide an overview of possible situations in the troposphere.
2.2. Troposphere General Circulation Based on Moist Air Dynamic Balance
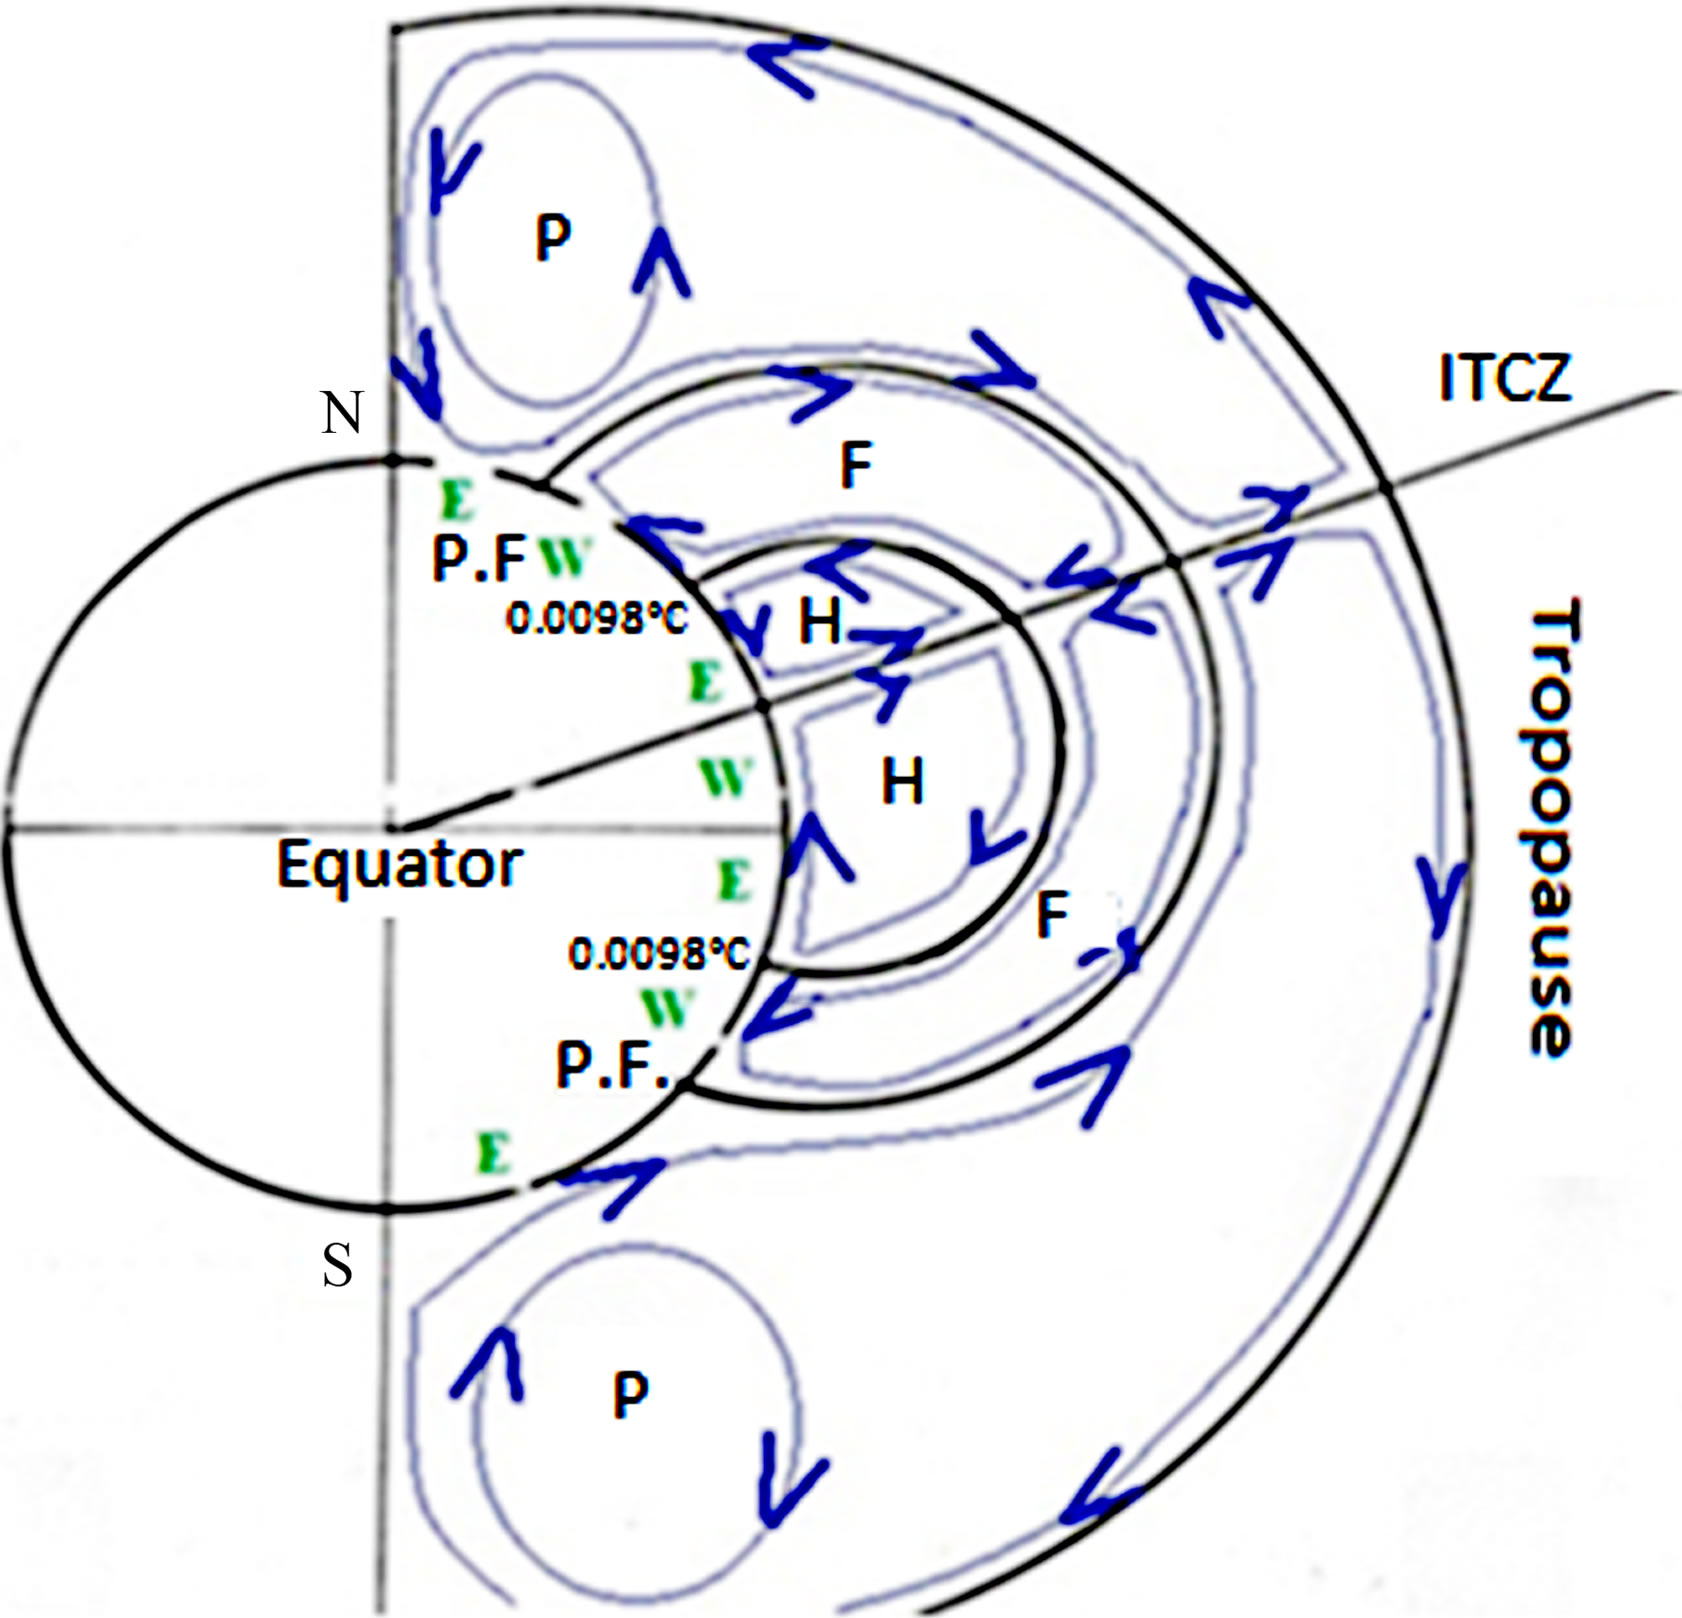
The two equal level surfaces of water vapor and temperature rating respectively at 6.11 mb and 0.0098˚C (Figure 2) separate clearly parts of the troposphere where ideal gas assumption can be applied without too distort reality to parts of the troposphere where this assumption is banned: hence appropriate and unique plots of earth’s atmosphere tricellular circulation (Figure 3).
3. Coriolis Force Effects on Troposphere General Circulation
Coriolis force is everywhere perpendicular to the relative
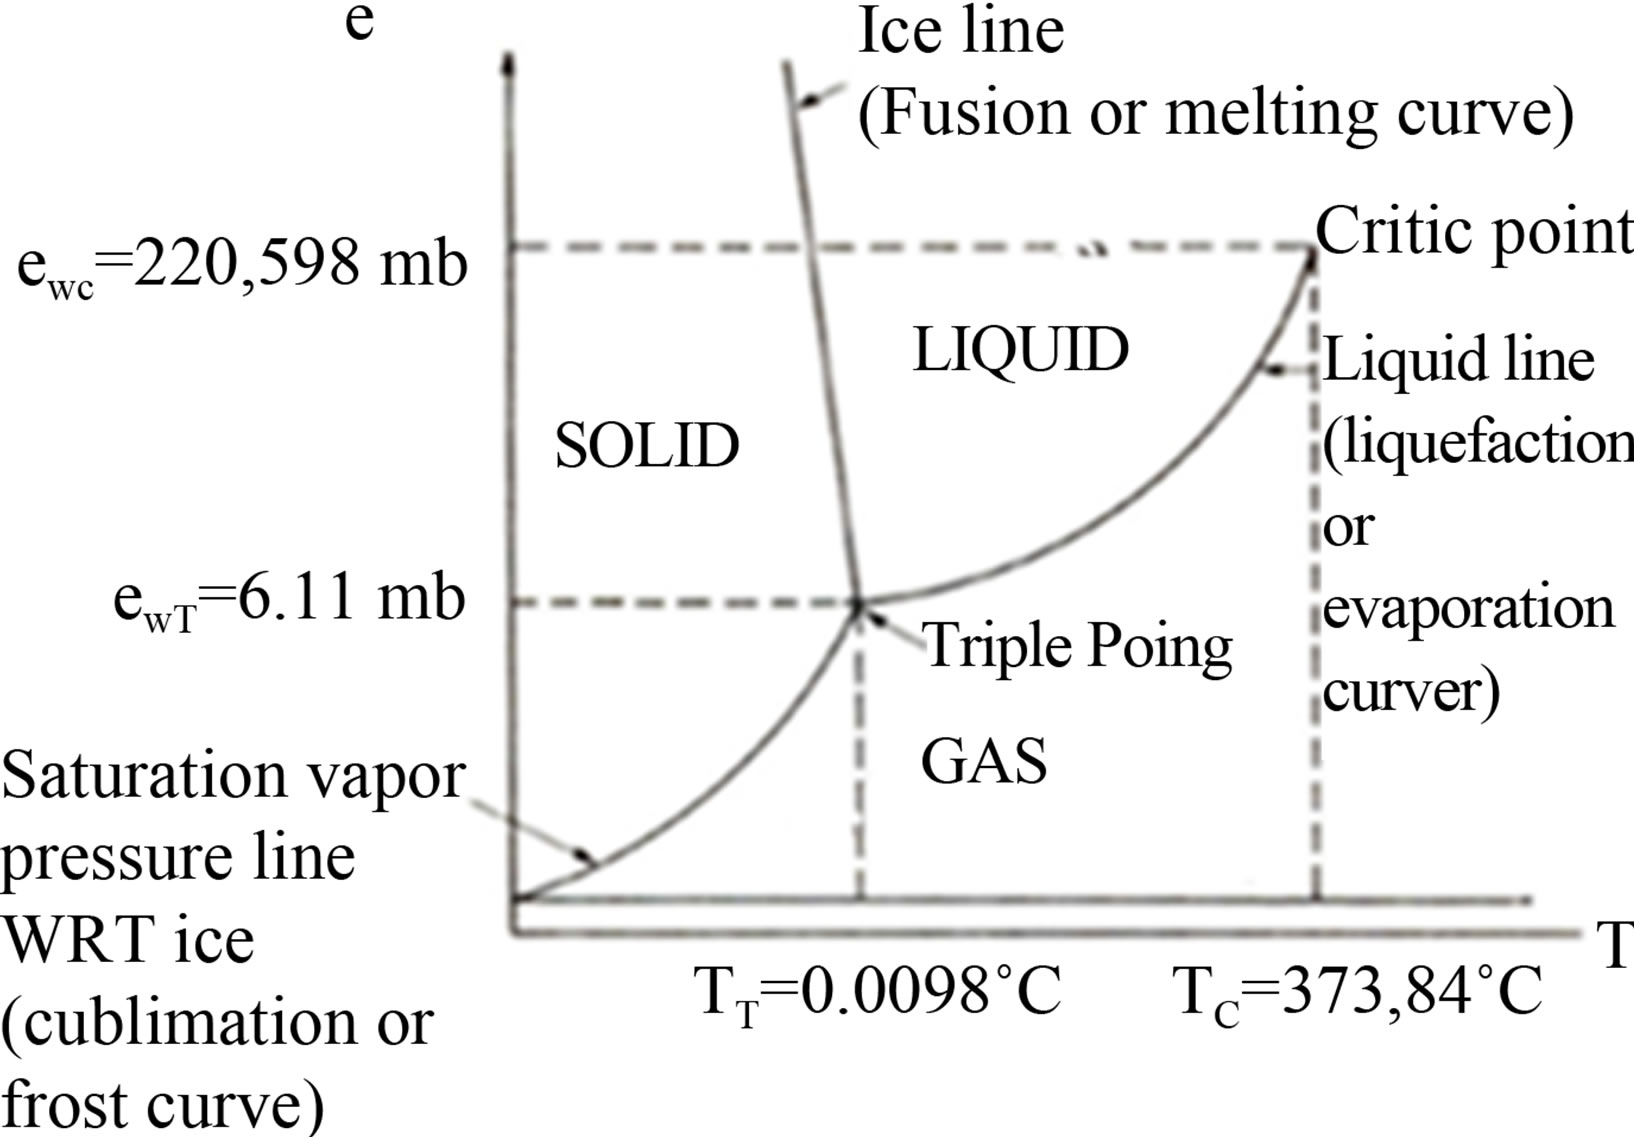
Figure 1. Saturation curves for water substance onto the eT-plane (ewT and TT are triple-point coordinates): ewT = 6.11 mb; TT = 0.0098˚C.

Table 1. Pressure variation of a constant volume of moist air, depending on the temperature T: in specific regions of the Troposphere, delimited by equal level surfaces rating respectively at 0.0098˚C and 6.11 mb.
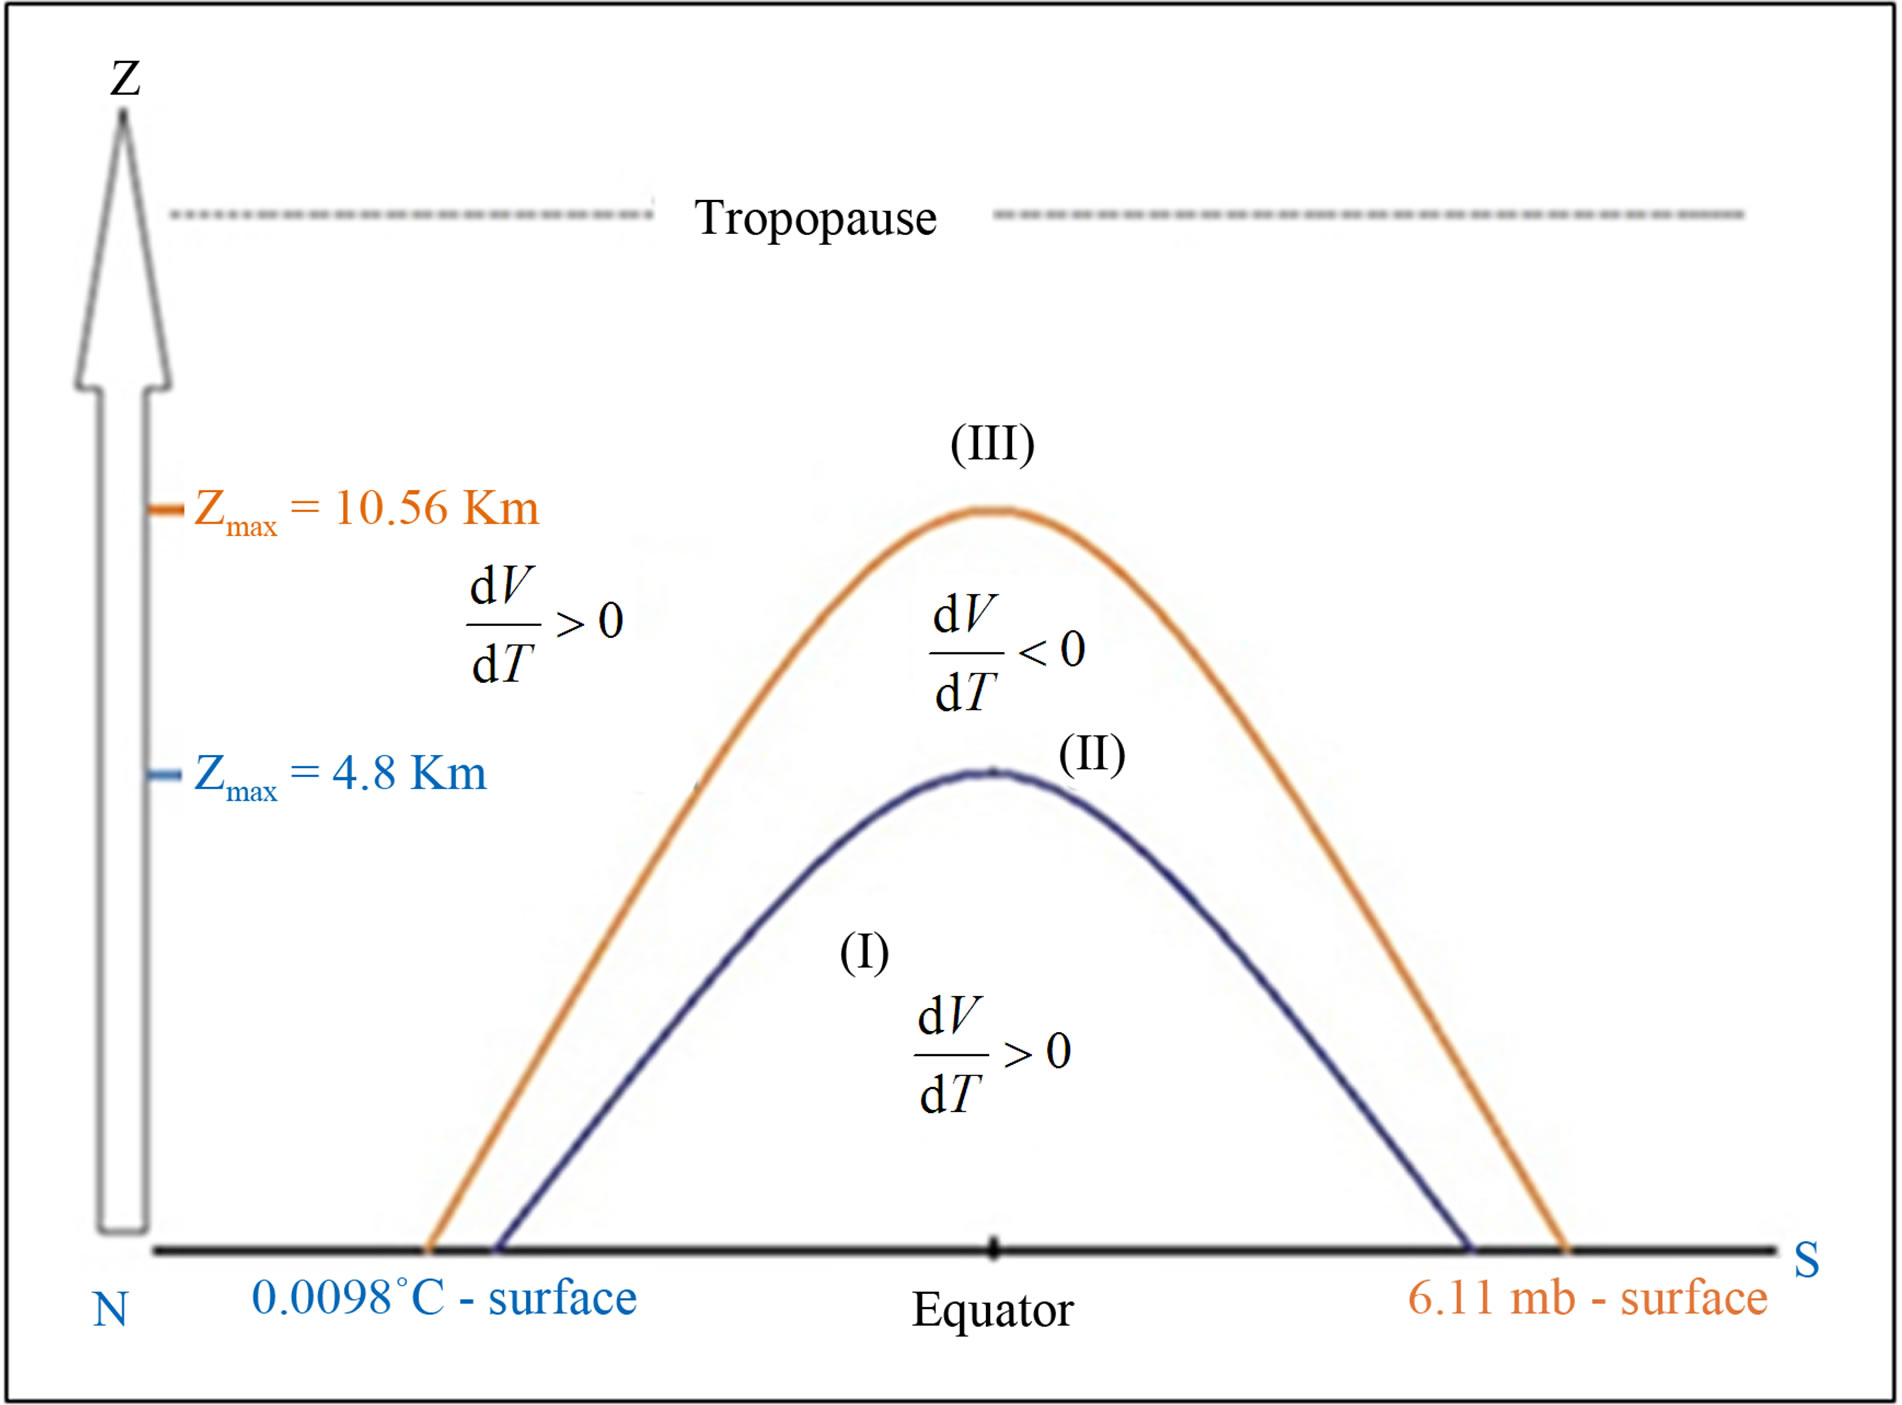
Figure 2. Troposphere specific regions depending on the manner in which V changes with T (V and T are respectively volume and temperature of an air parcel): If (dV/dT) > 0 the particle swells when its temperature increases (so it becomes lighter), if (dV/dT) < 0 the particle shrinks when its temperature increases (so it becomes less light). Zmax are statistical value of observed maximum elevation of equal level surfaces of temperature and water vapor rating respectively at 0.0098˚C and 6.11× 10⁻³ bars.

Figure 3. Schematic representation of the General Circulation, derived from Troposphere dynamic balance.
velocity  (since:
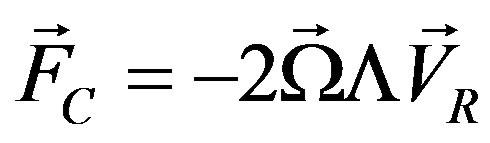 , in Meteorology Rectangular Coordinates System), and it acts to the right (left) in the northern (southern) hemisphere. Therefore, each cell of Figure 3 must be behind the formation of easterly-westerly couple of winds as shown on Figure 4. When the ITCZ is positioned along the equator, Coriolis force acts on the Hadley and Polar cells and produces surface Easterly winds (E) while at the same time it acts on the Ferrell cells and generates surface Westerly winds (W) as summarized on our Figure 5(a) and on the commonly known Figure 5(b). In our work, we want to understand what happens exactly when the ITCZ moves to the northern hemisphere and then the 2nd Hadley cells cross the equator. At that time Coriolis force acts on the 2nd Hadley cells and generates surface southern westerly winds [named in this paper: SE2W (Southern Equatorial Westerly Winds)] in regions firstly occupied by Trade Winds (Figures 6(a) and (b)). During Northern Hemisphere’s winter, the ITCZ moves in the Southern hemisphere and then the 1st Hadley cells cross the equator and gives rise to surface northern westerly winds [named by us: NE2W (Northern Equatorial Westerly Winds)] in regions located between the equator and the ITCZ and firstly occupied by Trade Winds (Figures 7(a) and (b)). To summarize: Anyone who wants to understand the weather factors which drive the formation of monsoons must remember that these rainfalls phenomena occur in regions where seasonal reversals can be performed by Trade Winds, SE2W, NE2W, HL2W (Horse Latitudes westerly winds) and PLEW (Polar Latitudes Easterly Winds) as summarized in geographical extent of the global surface monsoons [28]. That means typically: both latitudes within extreme positions in summer (Figure 6(a)) and winter (Figure 7(a)) of the equal vapor pressure surface rating at 6.11mb. In the case of tropical monsoons, seasonal reversals are performed in the northern and southern hemispheres by (Trade Winds; SE2W) and (Trade Winds; NE2W) couples respectively (Figure 8).
4. Conclusions and Comments
In the northern hemisphere, the sun declination reaches its extreme values on June and July: it is precisely during this period that the monsoon rains are most abundant. This shows that there is a closely relationship between the two climatic factors that are the sun declination (which is aligned on the ITCZ, with a slight phase delay) and

Figure 4. Easterly and Westerly winds triggered by Coriolis force acting on the Hadley Cell.
 (a)
(a) (b)
(b)
Figure 5. (a) Schematic localization of prevailing surface winds (E = Easterlies, W = Westerlies) when the ITCZ is positioning along the equator; (b) Worldwide Geographical Extent of the prevailing surface winds when the ITCZ is positioning along the equator.
 (a)
(a)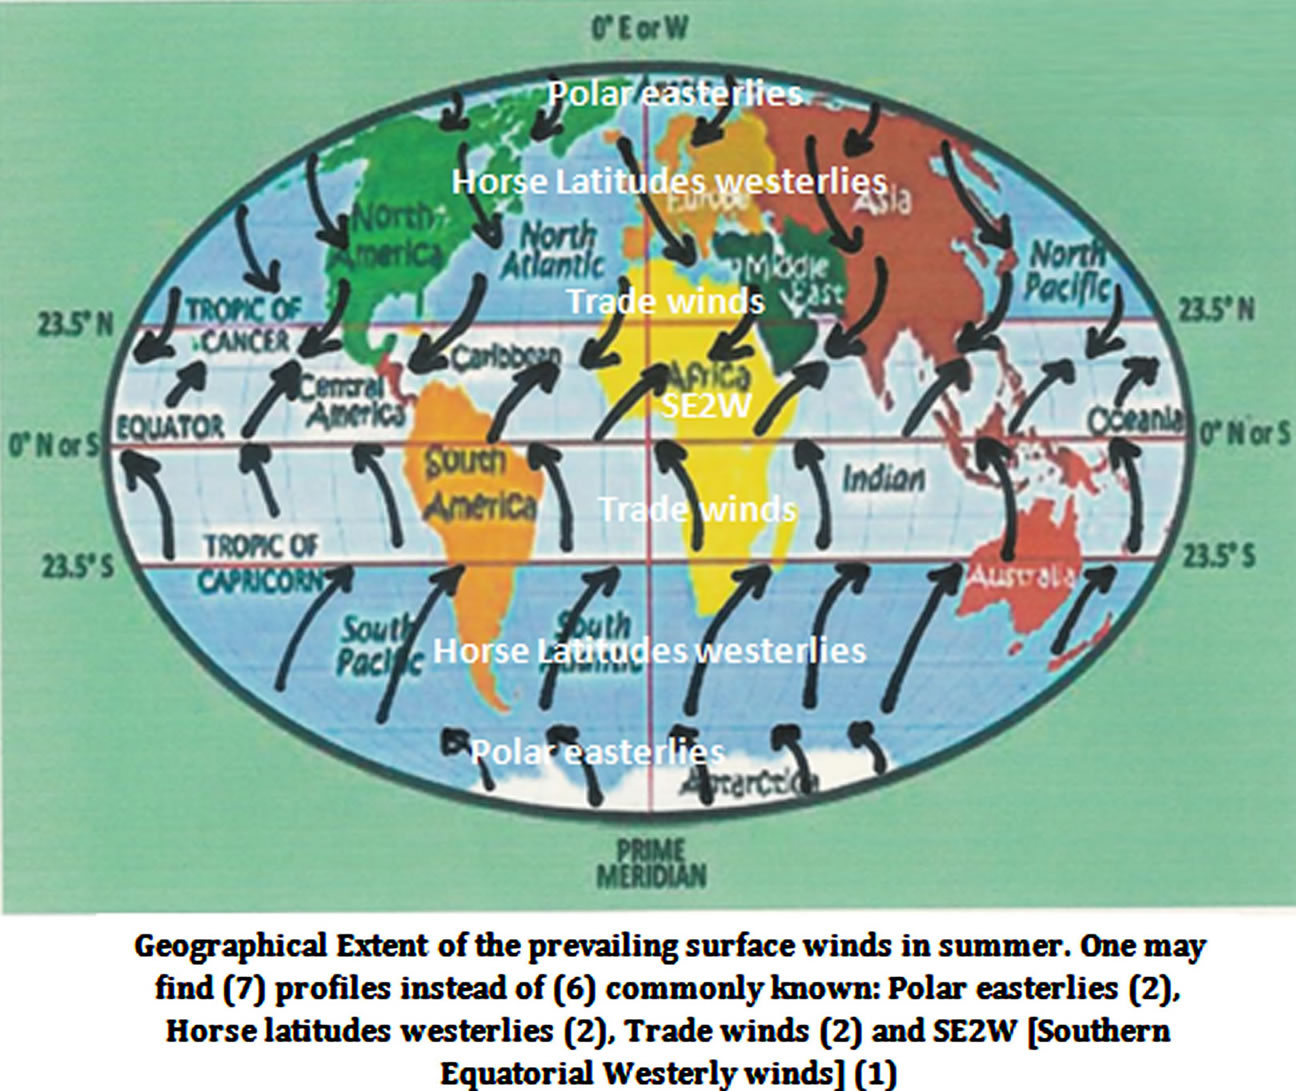 (b)
(b)
Figure 6. (a) Schematic localization of prevailing surface winds in summer: with respect to Northern hemisphere; (b) Worldwide Geographical Extent of the prevailing surface winds in summer: with respect to Northern hemisphere.
monsoon rainfall intensity. Whether the Northern Hemisphere or Southern Hemisphere, monsoons are weather phenomena closely associated with the earth’s rotation effects on general circulation of the troposphere and ITCZ oscillations performed by earth’s revolution. Monsoon precipitation intensity also depends on the proximity of oceans or sees whose are heat reservoirs capable of producing water vapor even at night due to liquid water inertia. Monsoon is then characterized by hot and particularly wet surface winds that are as tropical wet climates or tropical and trade-wind littoral climates. Therefore it is necessary to avoid confusing monsoons, of which time scales (several decades) are comparable to those of the general circulation, with sees breezes of much smaller
 (a)
(a) (b)
(b)
Figure 7. (a) Schematic localization of prevailing surface winds in winter: with respect to Northern hemisphere; (b) Worldwide Geographical Extent of the prevailing surface winds in winter: with respect to Northern hemisphere.

Figure 8. Geographical extend of the global surface Monsoons.
time scales (less than 12 hours). At the African NorthWest Littoral, the SE2W (revealed by this paper) which replace the traditional Trade Winds (called Harmattan by west Africans), announce the arrival of the West African monsoon that takes place during northern hemisphere’s summer. At the northern west littorals (e.g., European littorals), our SE2W combine favorably with sea breezes: the resulting precipitations are therefor persistent and abundant. While on the northern east littorals, our SE2W prevent sea breezes and considerably reduce the frequencies of sea breezes’ precipitations. At night, the SE2W dominate the continental breezes in west littorals while in the east littorals, the SE2W and continental breezes combine favorably. In summary, the limiting factors for monsoon rainfall are: distance from the moisture sources such as the oceans, distance from the main source of heat which is the sun (that means solar activity), low penetration of the ITCZ in the northern or southern hemisphere (that means: low height of monsoon), small size of the water vapor source. Within Horse latitudes, Trade winds brought wet climates to eastern littorals while SE2W brought wet climates to only parts of the western littorals crossed by the ITCZ. Intensity of precipitations, as a result, mainly depends on the width of the ocean which moistens the trade winds or the SE2W.