Wind-Induced Response Characteristics of a Tall Building from GPS and Accelerometer Measurements ()
1. Introduction
Tall buildings, unlike low-rise buildings, are generally very responsive to dynamic excitations, such as those from winds and earthquakes. Wind-induced vibration is almost always a matter of concern and the design of tall buildings is often governed by their serviceability requirements rather than the ultimate limit state. Although wind tunnel model testing has been an invaluable tool in the design of many high-rise buildings and structures, loading conditions in the real world are much more complicated. Therefore, it is vital to investigate the dynamic responses of tall buildings with field measurements to verify the design computations and to optimize future design and construction of similar structures.
An increasing number of tall and super tall buildings have been built around the World. Hong Kong is currently ranked the ninth in the world in terms of cost of living, which is caused by the inextricable link to high land prices. The high land prices have led to the construction of a great number of tall buildings in the city. On the other hand, Hong Kong is prone to tropical cyclones and typhoons. It is therefore useful to verify the full-scale dynamic performances of the tall buildings under extreme wind loading conditions by comparing the actual performances of the buildings with the original design criteria, to determine the serviceability conditions of the buildings and to improve future building designs.
It is well known that although accelerometers are useful in determining the dynamic properties and/or windinduced resonant type responses of tall buildings, they are unable to measure accurately the static deflection and quasi-static background responses, which are of particular interest for studying structural behaviors under wind excitation. Recent studies have demonstrated the feasibility of using GPS for wind-induced response measurements [1,2]. GPS measurement systems have also been demonstrated as temporary installations on tall structures, like Di Wang Building in China [3], a steel tower in Japan [4,5], buildings in San Francisco and Los Angeles [6], buildings in Chicago [7], and a 256 m tall residential building in Hong Kong [8-10]. Despite the advantages of GPS for measuring wind-induced responses, care must be taken in equipment setup and data processing and analysis to minimize the effects of GPS errors. The major challenges that need to be overcome in the use of GPS in the current application include the interference of GPS signals by other tall buildings nearby, known as multipath effect, and the difficulty in determining the 3D modes (i.e. two lateral components and a significant torsional component) of the building based on GPS measurements.
This paper presents results from an ongoing research program on monitoring a tall building with three-dimensional (3D) mode shapes in Hong Kong under ambient wind loading conditions. The main objectives of the research are to validate the GPS results and characterize the building’s resonant and slowly-varying (quasi-static) responses under wind excitations.
2. Field Measurement Program Setup
A 260 m tall reinforced concrete (RC) building, with a plan area of about 80 m × 19 m, was instrumented with two sets of orthogonally aligned accelerometers on the top floor of the building, a GPS receiver and antenna, and an ultrasonic anemometer with 1.5 m height on the roof of the building to measure its wind-induced response. The subject building and instrument locations are illustrated in Figure 1.
The test building is located within an urban environment and, due to being significantly taller than the surrounding buildings, has relatively more exposure to the prevailing winds. A pair of Topcon GB-1000 receivers and Topcon CR-3 choke ring antennas were used to measure the dynamic structural displacements. One GPS antenna was placed at the roof top of the high-rise building as rover station (Figure 2(a)), while the other was placed on the roof top of a office building with 30 m height as a reference station (Figure 2(b)), and the distance between rover and reference station is about 850 m. The GPS data were sampled continuously at 10 Hz for periods of one hour. The two sets of orthogonally aligned Honeywell QA-650 accelerometers on the upper floor of the building were used to record accelerations at 20 Hz using a 16-bit A/D converter and the readings were stored on a dedicated PC after signal amplification and the application of a 10 Hz low-pass filter. The data stream of the monitoring system is illustrated in Figure 3. The monitoring system worked from November 2007 to September 2008.
3. Wind-Induced Acceleration Response Measured by Accelerometers
3.1. Natural Frequency of the Tall Building
Figure 4 presents the measured acceleration traces for one representative hour. The measured accelerations were post-processed by applying a 1 Hz software lowpass filter to focus on the first three modes of vibration of the building. It can be seen from Figure 4 that the accelerations of the building wing in both the X and Y directions are larger than the corresponding accelerations at the building core, as expected. Furthermore, it is also clear that the largest components of acceleration were aligned with the prevailing wind direction.
Spectral analyses of the acceleration records produced the acceleration spectra shown in Figure 5, which are the ensemble average of four records extracted from the hour of measured data that contained the peak resultant acceleration. The natural frequencies identified from the spectra
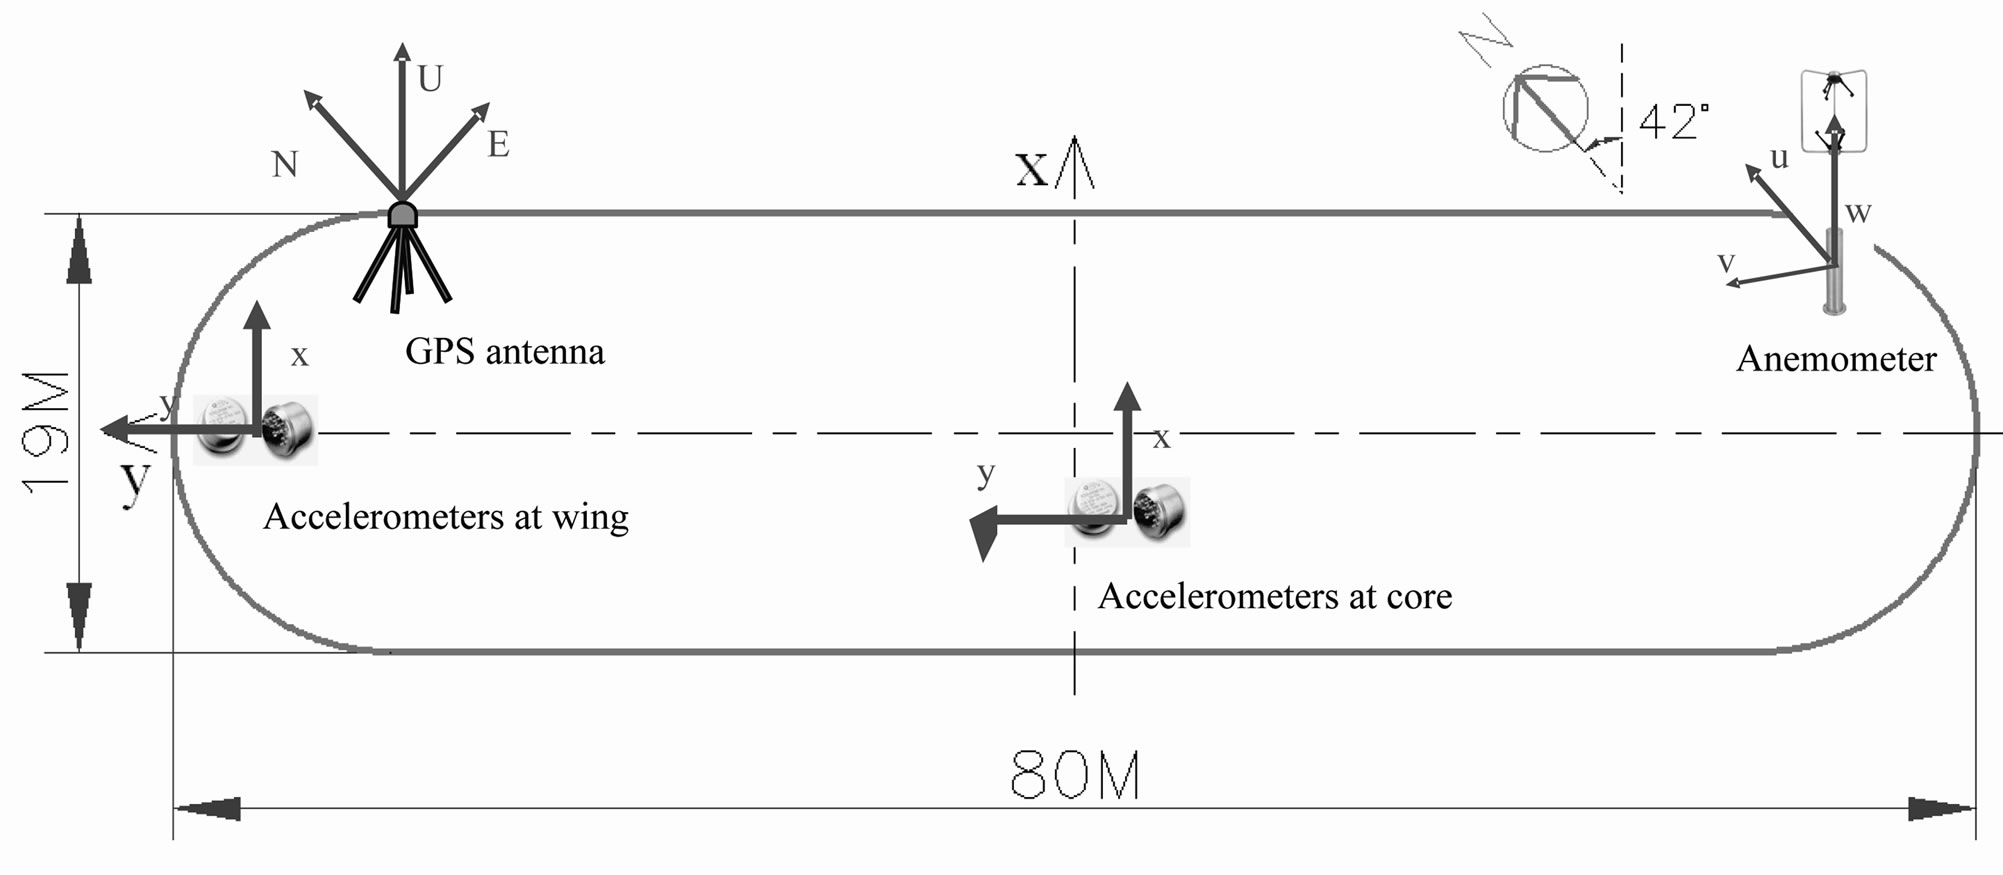
Figure 1. Schematic plane view of the instrumented test building and sensor layout.

Figure 2. GPS baseline for measuring wind-induced response of the test building. (a) Rover Station at Tall Building. (b) Reference Station.
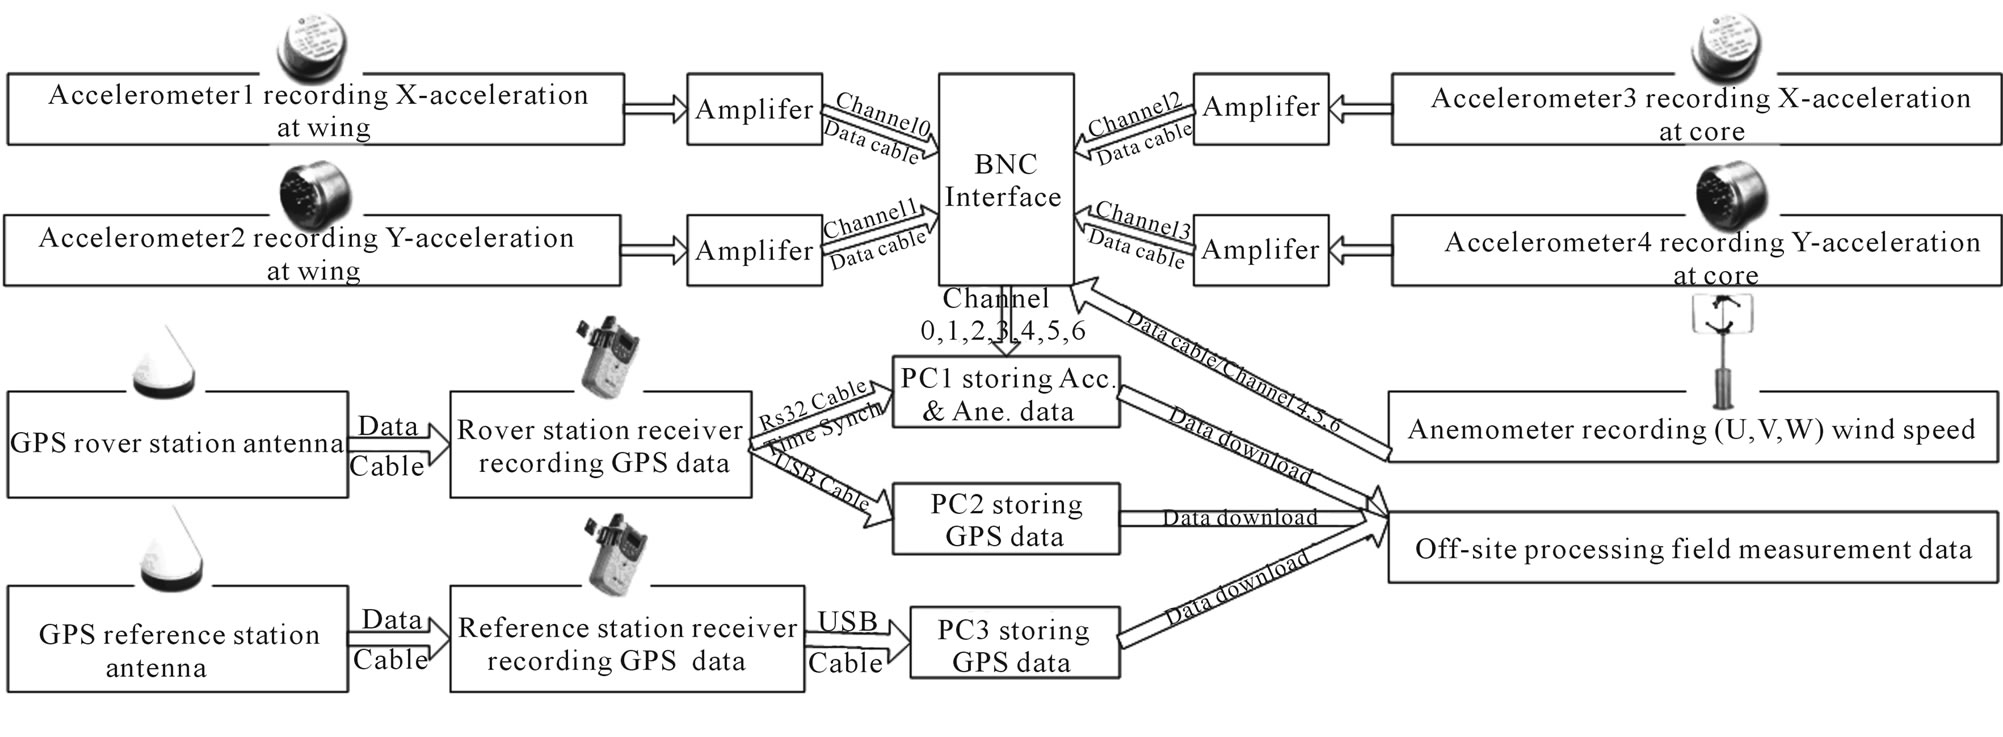
Figure 3. Data stream of field measurement system.
in Figure 5 are 0.22 Hz and 0.36 Hz, that correspond to modes of vibration that are predominantly translational, and 0.46 Hz, that is predominantly a torsional mode of vibration. Therefore, the alignment of the pair of accelerometers located at the building wing were responsive to the first three modes, whereas the pair of accelerometers located at the building core mainly detected either the first mode or the second mode of vibration that were essentially orthogonal modes with predominant components along the X and Y axes respectively. The difference between the orthogonal natural frequencies is attributed to the different stiffness along the X and Y axes associated with the building shape.
3.2. Damping Characteristics of the Tall Building
Damping is a parameter defining the ability of a structure to dissipate energy from an excited state to reach a state of lower energy. Damping in typical tall buildings is most conveniently treated as equivalent viscous damping having a single value, although it has been recognized that the actual nature of damping is significantly more complex than this simple assumption. This makes it very
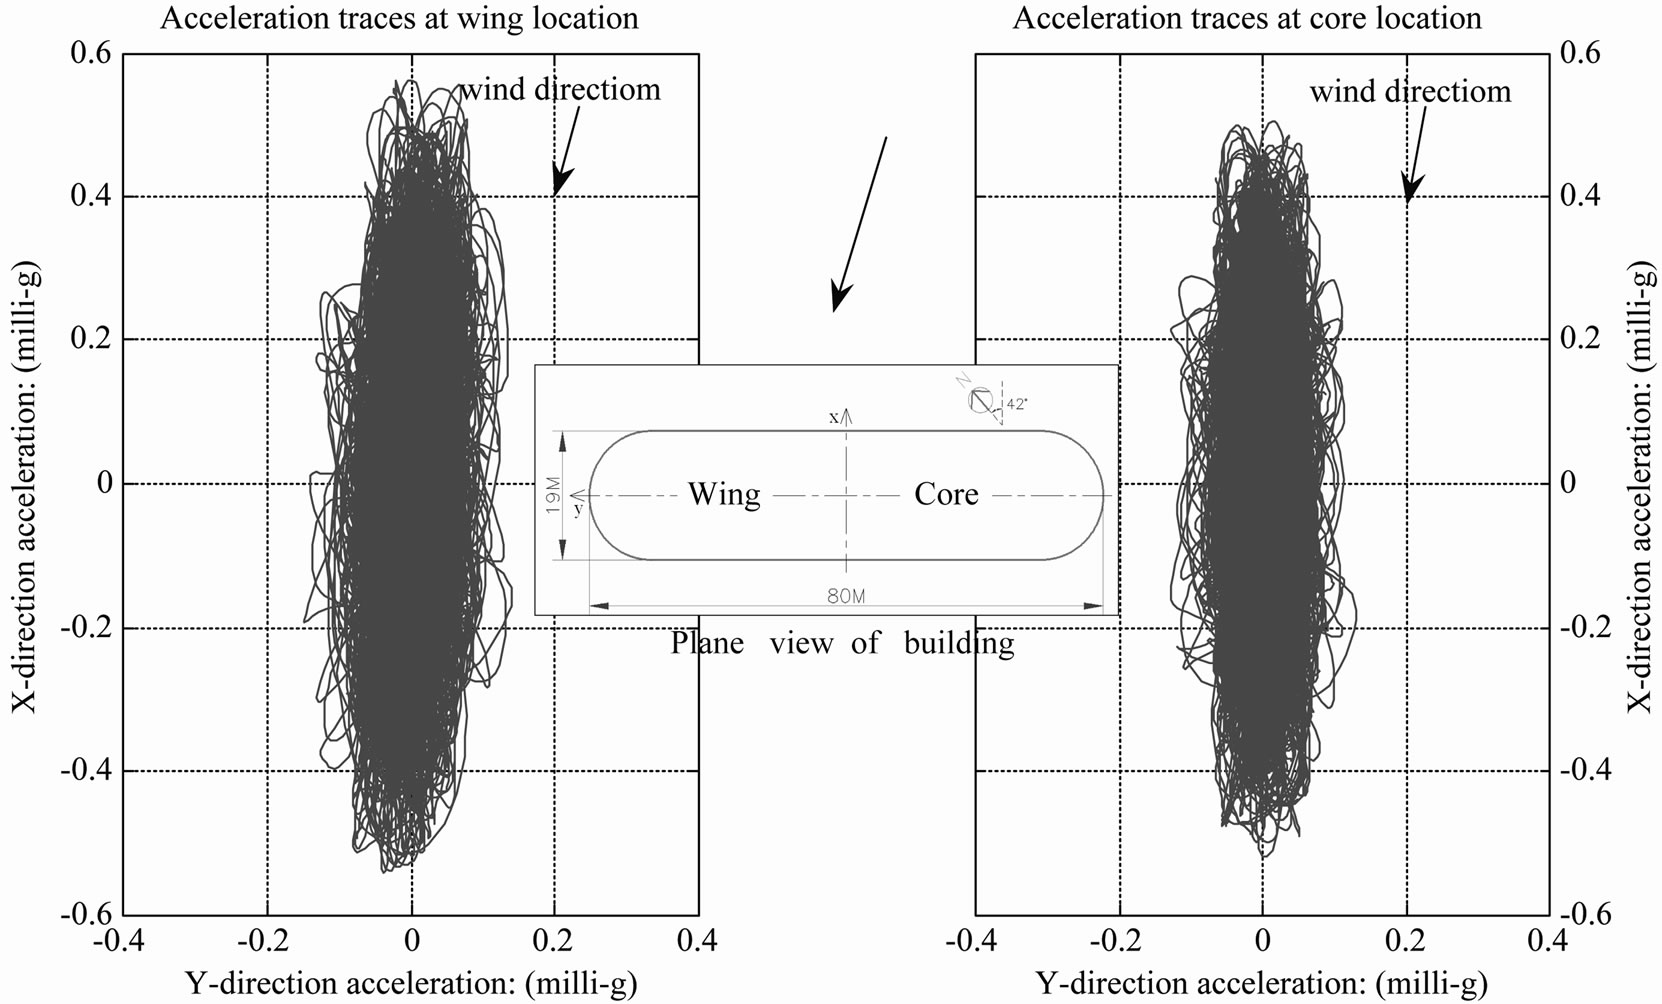
Figure 4. Representative acceleration traces measured on the building.
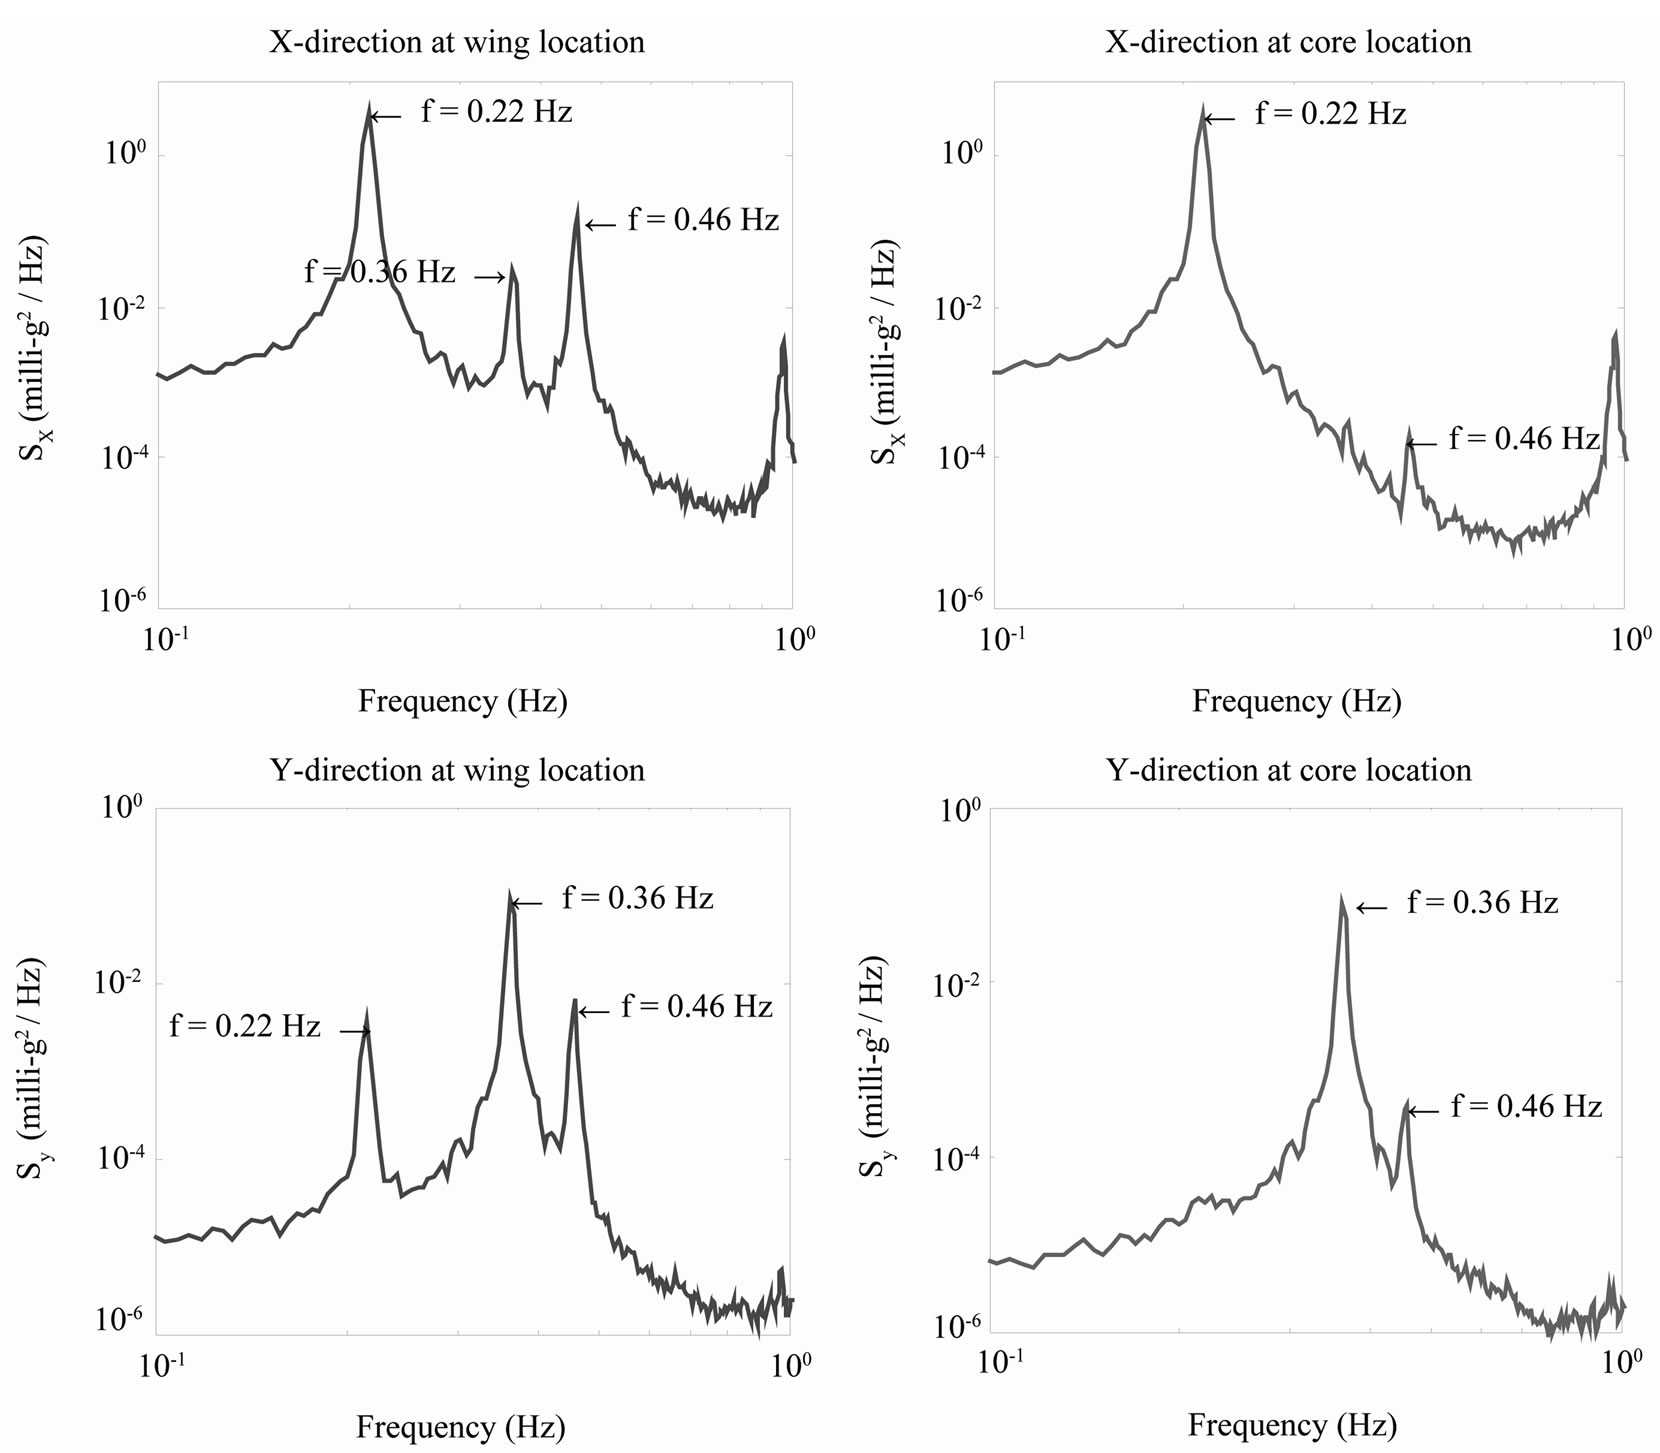
Figure 5. Acceleration spectra for the X and Y directions.
difficult for the designer to predict damping with any great certainty. Damping of full-scale structures can be estimated through a number of techniques, including logarithmic decrement, autocorrelation, half-power bandwidth, and random decrement techniques [11]. The random decrement technique (RDT) has been chosen for this study because it overcomes limits of stationarity, input amplitude and resolution, and allows for the convenient determination of any amplitude-dependent effects. In addition, for closely spaced modes of vibration, the RDT has been shown to suffer from less distortion than the autocorrelation method [12].
In the RDT, the random decrement signature (RDS) of a building is calculated by selecting segments of a measured time-history of a building response process which, when ensemble averaged, removes the effects of initial conditions and random input. The resulting RDS approximates the free-decay vibration of the system, which can then be used to estimate modal parameters such as structural damping and natural frequency.
As discussed previously, the wind-induced responses of the test building were primarily in the two fundamental sway modes of vibration, but higher modes of vibration were also present. When calculating the damping ratio of each mode, the measured signals of acceleration responses were band-pass filtered before obtaining the RDS to remove extraneous components from noise and other modes of vibration. The RDS of the first three modes of the building were evaluated from the measured acceleration data, as shown in Figure 6, after which the damping ratios for the tall building were estimated using the logarithmic decrement method (0.28%, 0.37% and 0.35% of critical damping respectively).
4. Wind-Induced Displacement Responses Measured by GPS
4.1. Verification of Dynamic Measurement Accuracy of GPS
A GPS antenna was mounted on a computer-controlled mechanical shaker that simulated sinusoidal vibrations of adjustable frequency and amplitude to assess the dynamic measurement accuracy of the GPS. The shaker was set up in an open area with a reference base station placed approximately 10 m away from the device. A laser displacement sensor with a measurement resolution of 0.05 mm was also positioned nearby to accurately measure the displacement of the rover antenna during the test (Figure 7). Various combinations of frequencies of 0.2, 0.3 or 0.5 Hz and peak-to-peak displacements of 20, 40 or 60 mm were used in the test.
The spectra of some of the displacement signals as measured with the laser and GPS are presented in Figure 8. The results show that the frequencies identified from the two types of measurements match each other well. The GPS measurements exhibit elevated levels of variations over the laser measurements, which is attributed to the background noise of the GPS measurements. Nevertheless, for the purposes of identifying the natural frequencies of a wind-excited building, the favorable comparison of the laser sensor and the GPS displacement measurements supports the use of the GPS technology for tall buildings in strong wind conditions. Furthermore, after implementing a band-pass filtering scheme designed and applied to the data, better agreement can generally be observed between the measurements, as illustrated in Figure 9.
4.2. Measurement of Wind-Induced Resonant Responses
Although no significant strong wind events have occurred since the test building was instrumented, it is much more sensitive to wind loading along its X axis due to the shape of the building. Therefore, only the GPS results along the X axis will be presented. Figure 10 shows one representative hour of wind-induced response measured by GPS installed at the wing of the building and the corresponding 3 second mean value of wind speed and wind direction measured by the anemometer. Slowly-varying displacements fluctuating about a nonzero mean value can be observed, which are the windinduced quasi-static responses.
The displacement of the subject building measured by GPS included both the resonant and the quasi-static responses, and the background noise of the GPS mainly caused by the GPS multipath errors. The frequency spectrum of the displacement time series obtained by Morlet wavelet transform is shown in Figure 11(a). An enlarged view of the region ranging from 0.1 to 0.5 Hz is presented in Figure 11(b) which shows that the main energy of the time series is around 0.2 Hz. Figure 12 shows the results of building response over the frequency range of 0.1 to 0.4 Hz after wavelet filtering. Evidently the magnitude of the GPS-measured displacement is up to about 2 mm.
4.3. Measurement of Wind-Induced Quasi-Static Responses
Wind-induced tall building response comprises a quasistatic component and a dynamic fluctuating component and the main aim of instrumenting a tall building with a GPS is to separate the measured displacement response into its constituent components. However, it is not straightforward to extract the quasi-static deformation as GPS multipath errors typically yield long-period distortions in the GPS results.
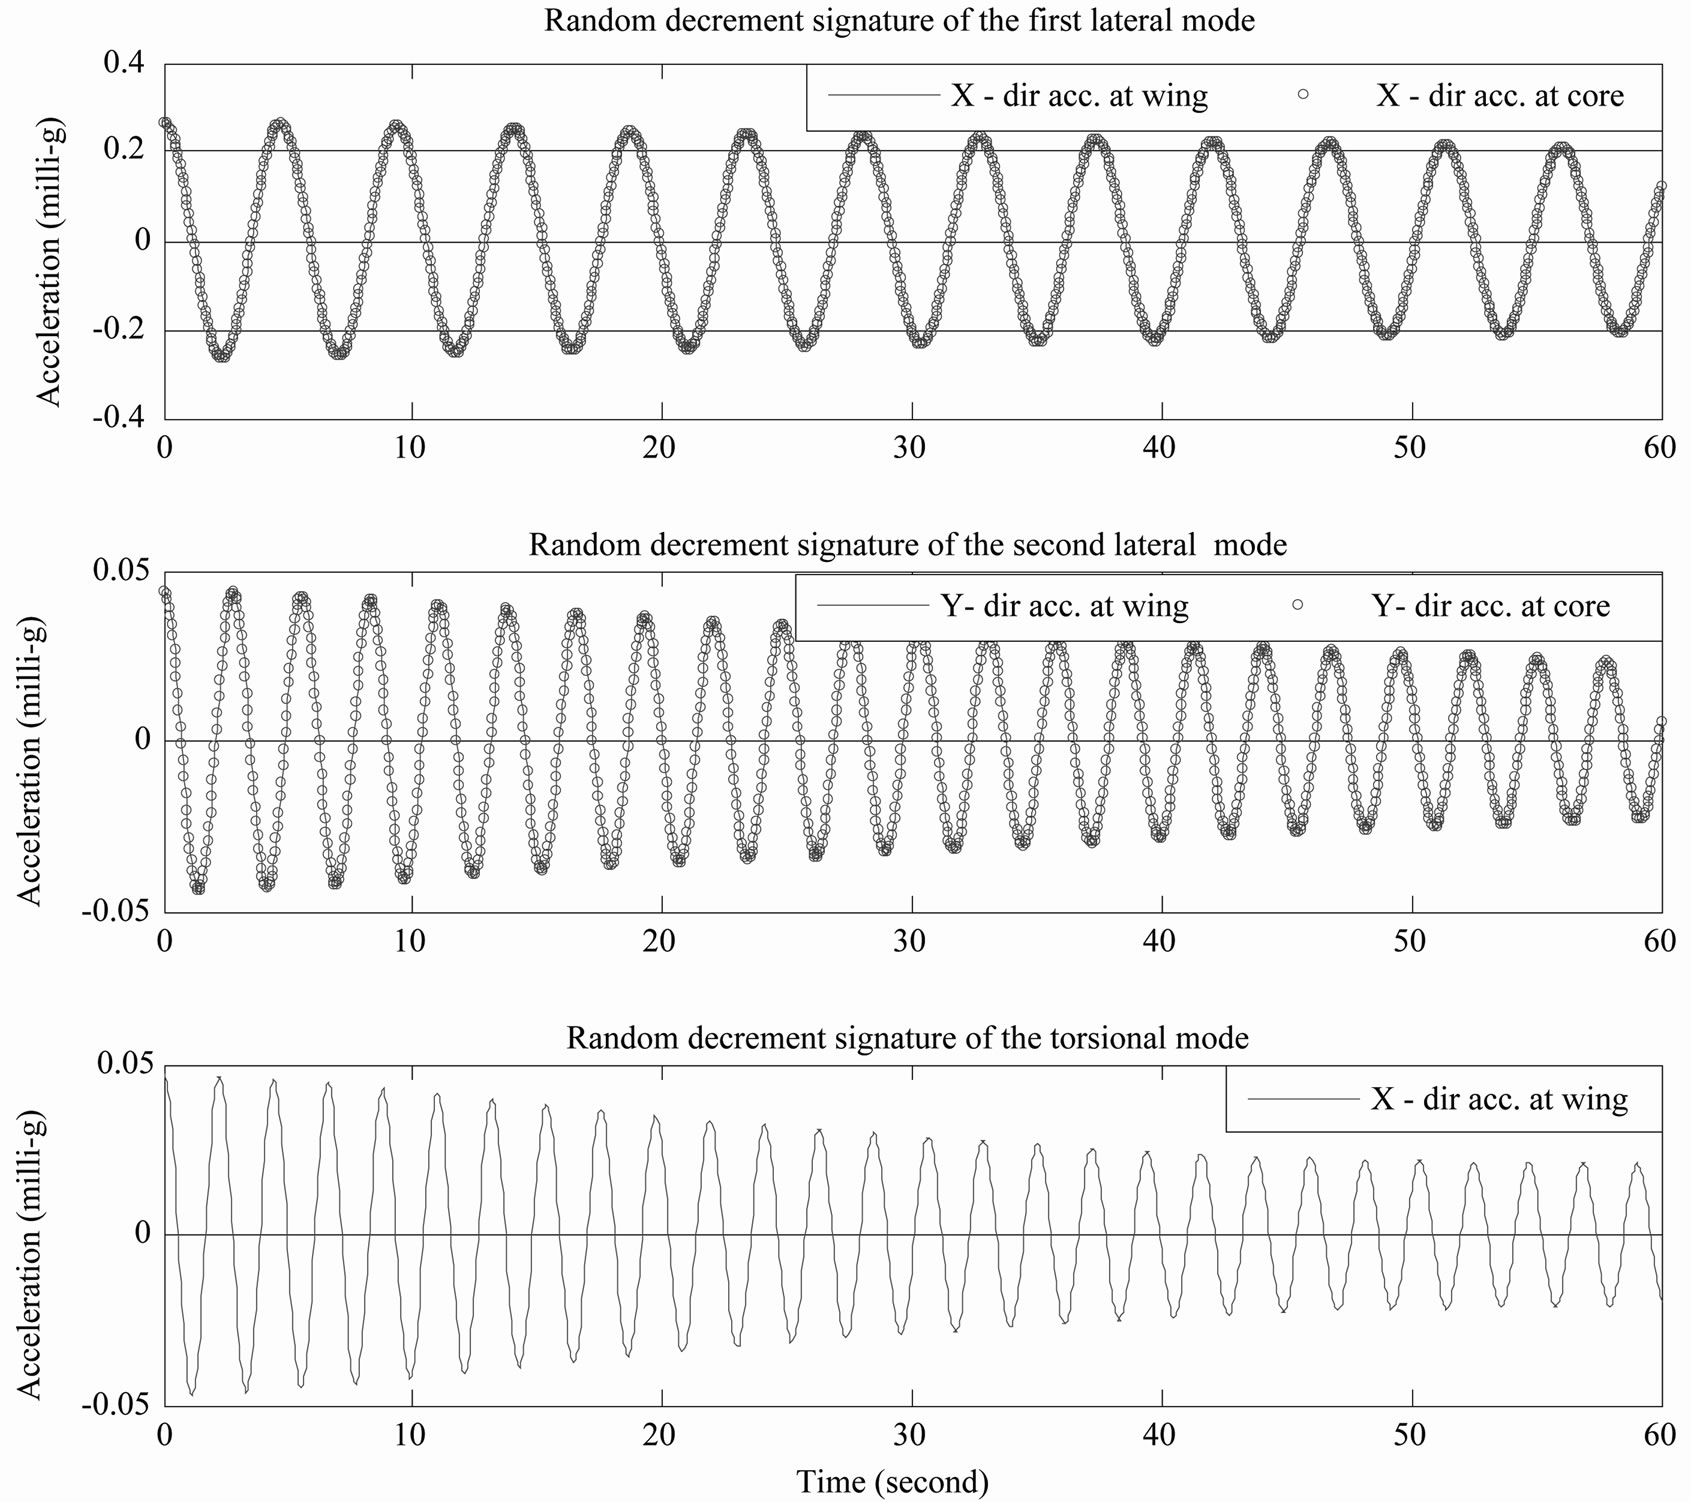
Figure 6. Random decrement signatures obtained from acceleration time series measured with accelerometers.
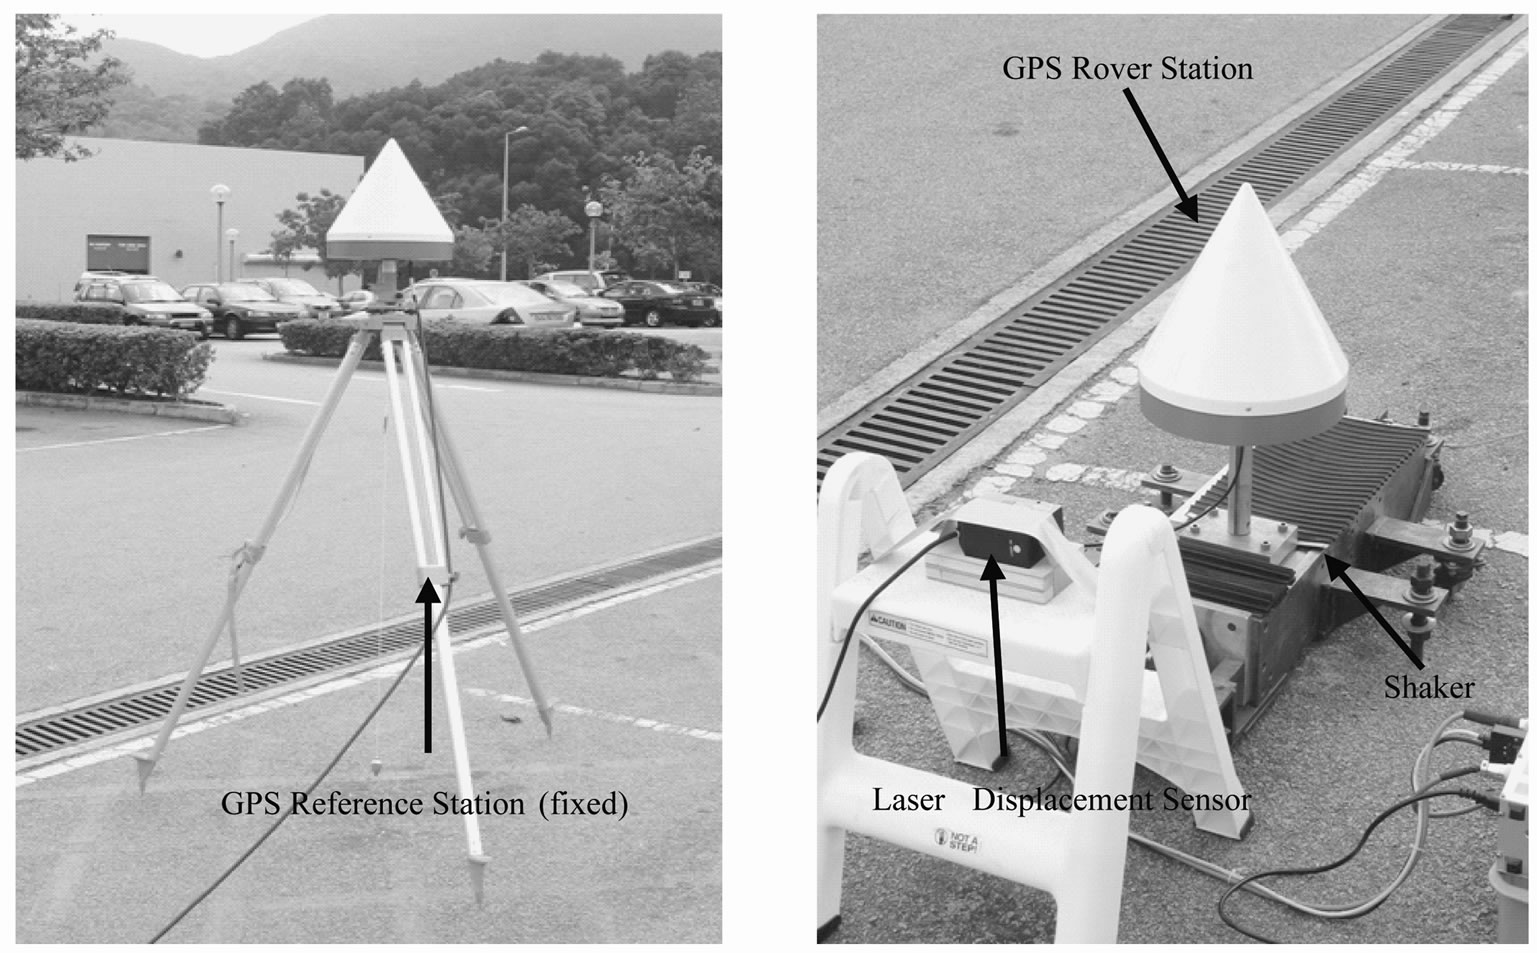
Figure 7. Vibration test setup for GPS calibration.

Figure 8. Spectra from laser displacement sensor and GPS before filtering.
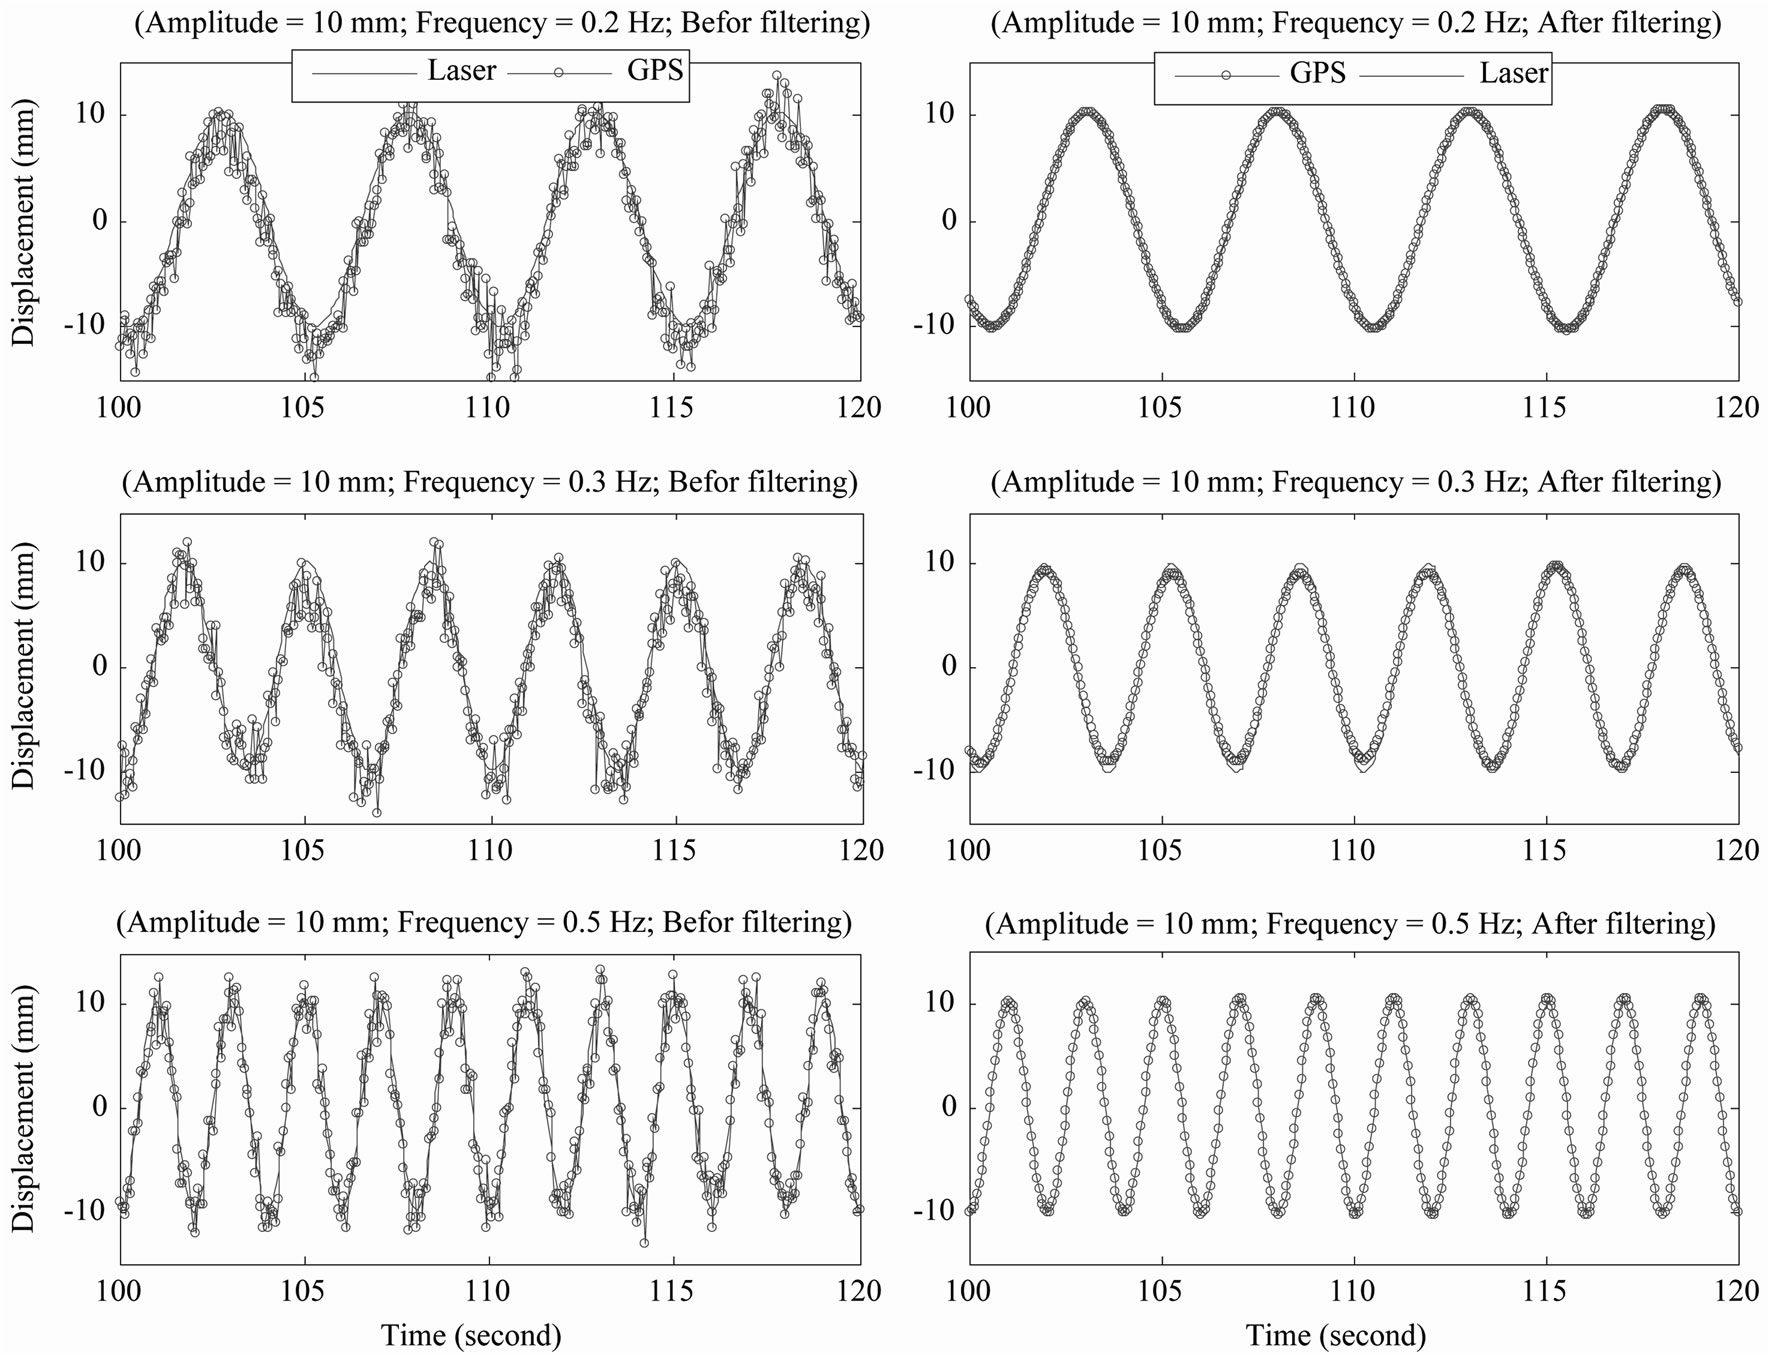
Figure 9. Comparison between vibration displacements measured with GPS and laser displacement sensor.
Although most manufacturers offer GPS antennas that are “multipath resistant”, these devices cannot reject completely the multipath signals that are from sources above the antenna plane. Efforts have also been made to develop GPS receivers with capabilities of detecting and removing the multipath signals on-the-fly but such algorithms are still in their infancy [13]. Hence, it is necessary for the end users to diagnose and remove the multipath effects from GPS measurements. This can be done by exploiting a number of multipath features. For example, GPS multipath signals usually repeat themselves every sidereal day (approximately 23 hours and 56
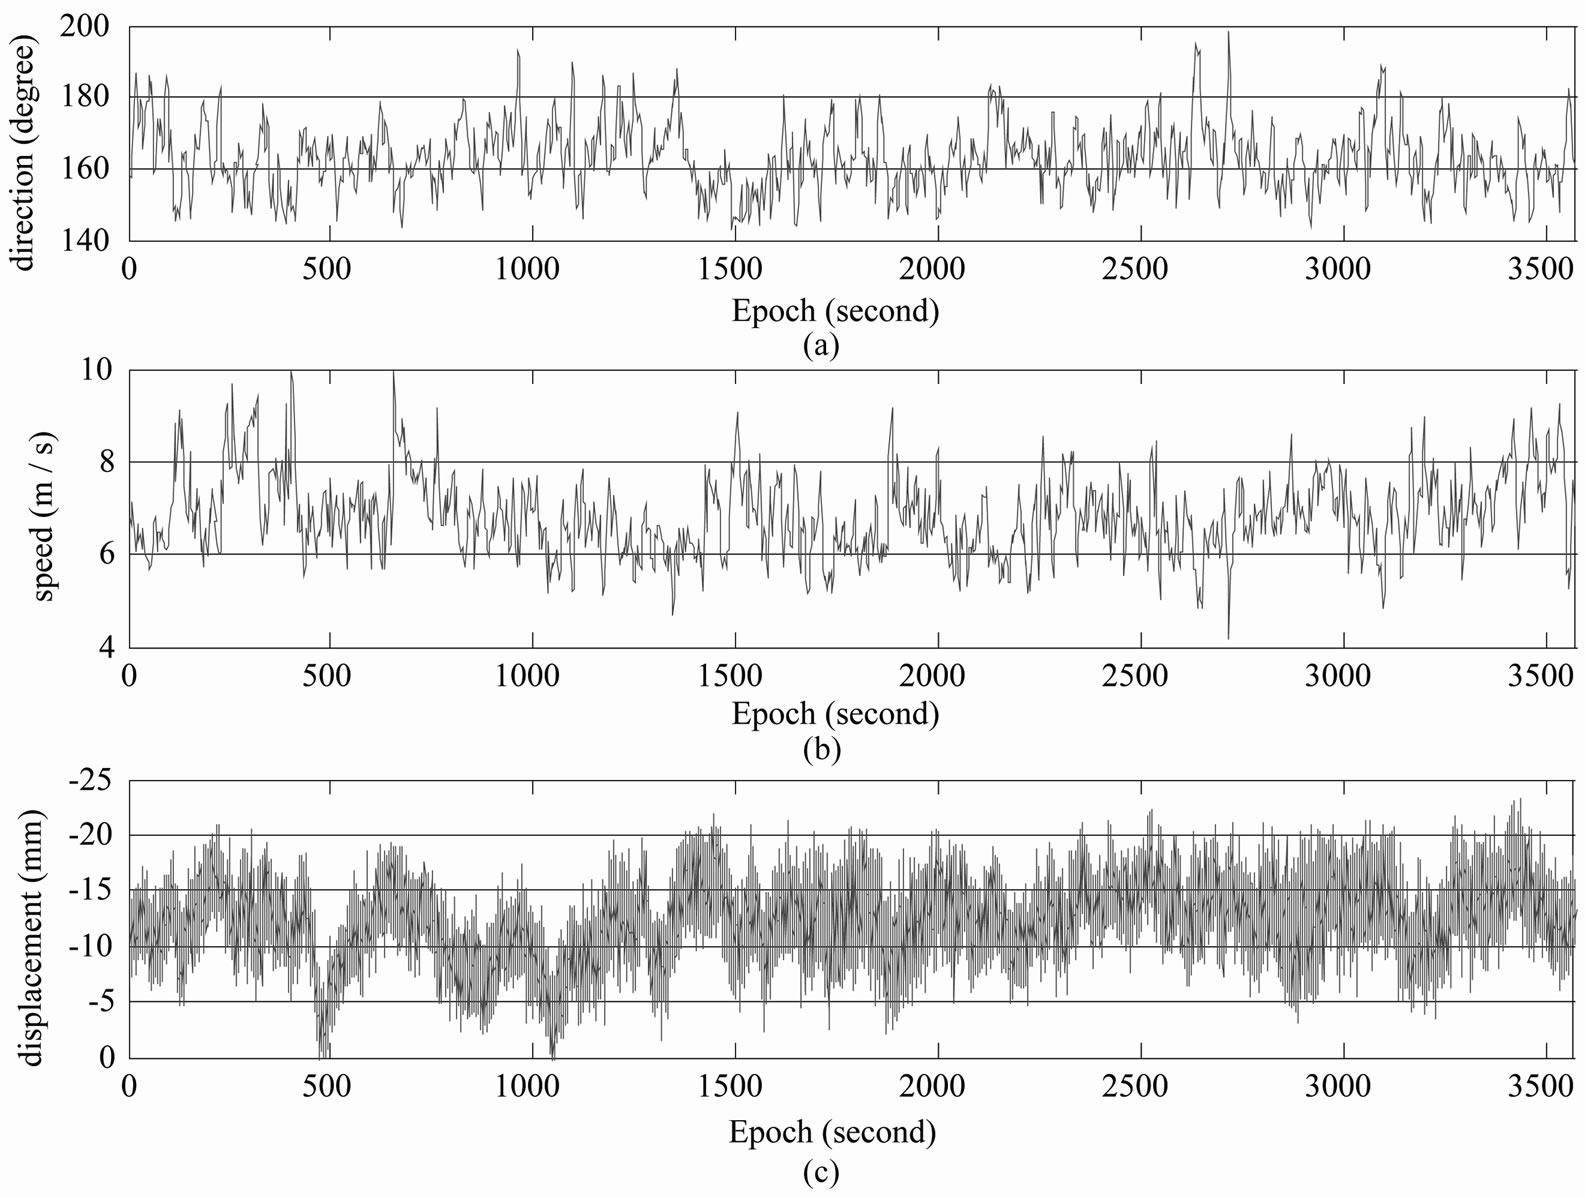
Figure 10. Displacement time series measured with GPS and the corresponding wind information. (a) 3 second mean value of wind direction (positive X is the zero direction). (b) 3 second mean value of wind speed. (c) GPS-measured raw displacement (X direction).
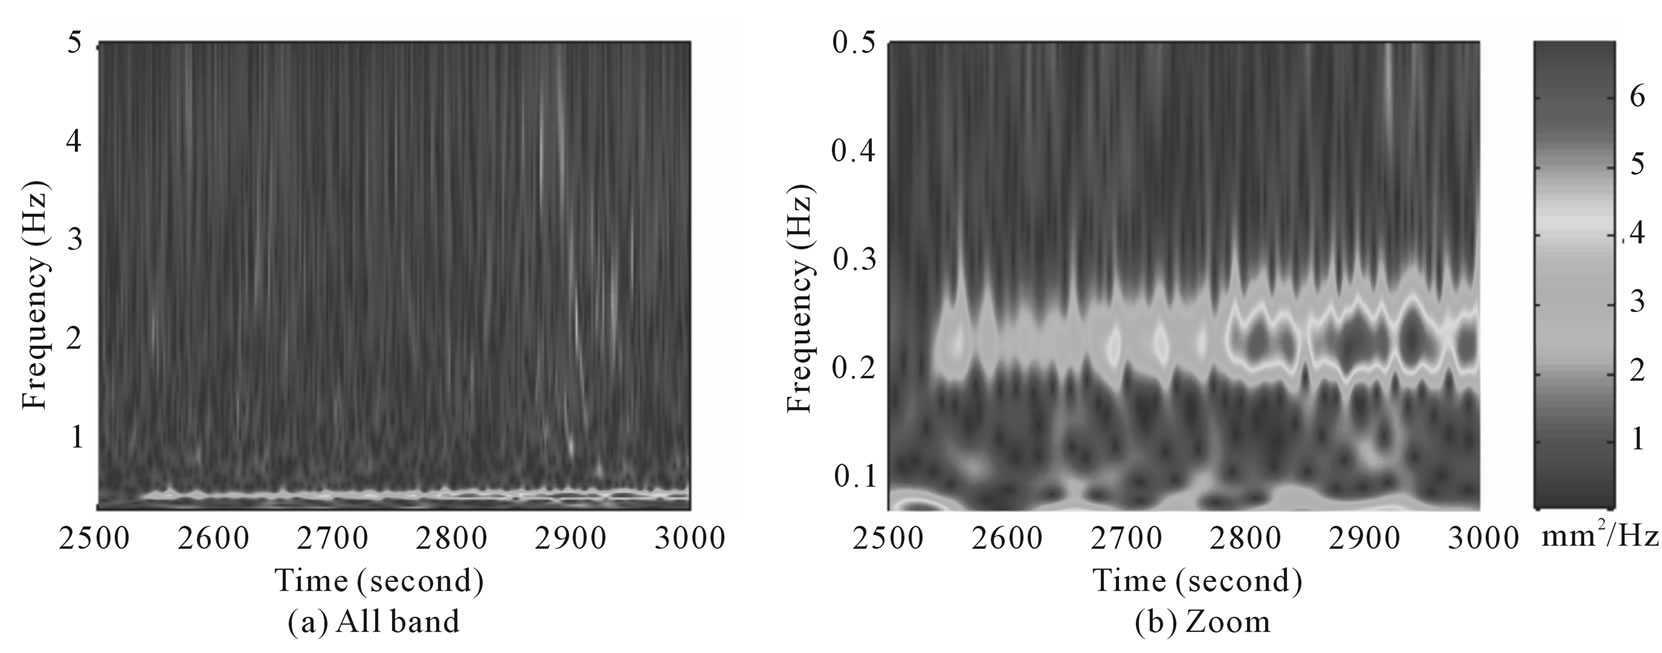
Figure 11. Frequency spectrum of wind-induced displacement response. (a) full measured band-width of GPS; (b) enlarged view of the region from 0.1 to 0.5 Hz).
minutes) if the relative geometry between the GPS satellites, the GPS antennas and the reflective surfaces is maintained the same. Figure 13 shows such repeatability between GPS results of two consecutive days. It is seen from the results that the main trends are similar between the two days. Algorithms have been developed for mitigating the multipath effects based on this feature [14,15]. A similar method was used in this study to construct a multipath model based on GPS results obtained on the building when the winds were very weak and the model was then applied to correct the GPS results of the subsequent days. Figure 14 shows the wind-induced quasistatic responses of the test building thus obtained for a whole day and the corresponding wind information. It can be seen from Figure 14(b) and 14(c) that the magnitude of the 10 minute mean value of the quasi-static

Figure 12. GPS-measured resonant response after wavelet filtering. (a) time series of one hour data; (b) a magnified 150- second window).

Figure 13. Repeatability of multipath effects between consecutive days.
displacements follows the general trend of the magnitude of the 10 minute mean value of wind speed. Discrepancies between the quasi-static displacement and the wind speed may have been caused by changes in the wind directions illustrated in Figure 14(a). For this measurement period, the wind direction was approximately aligned with the negative X direction. In summary, the GPS monitoring system was able to be used to measure the along-wind static displacement of the building.
5. Comparison of Results between Accelerometers and GPS
Figure 15 shows the power spectra of the acceleration and displacement time series measured with both the accelerometers and GPS. The power spectral density determined from the accelerometer measurements was converted into units of displacement by multiplying the results with  to allow a direct comparison with the displacement measured with GPS. Both spectra have a peak at 0.22 Hz corresponding to the first mode natural frequency of the building, although the spectrum determined from the GPS measurements shows almost constant energy at the two sides of the natural frequency, which is attributed to the background noise of GPS.
The measured accelerations were then band-pass filtered over the range of 0.1 to 0.4 Hz to focus on contributions from the first mode and to remove the noise. Data from the GPS measurements were compared with those from the accelerometers by double-differentiating the displacement measurements from GPS with respect to time. As shown in Figure 16, the form of the acceleration response derived from the GPS displacement measurements generally resembles that from the accelerometers, and the measured accelerations have almost the same magnitudes, particularly in the vicinity of the peak accelerations. This is more evident in the magnified 200 s windows in Figures 16(b) and 16(d).
The characteristics of vibration were also estimated by the RDT. Figure 17 shows the RDS obtained from the RDT, from which damping ratios are estimated using the logarithmic decrement method. The damping ratio determined from the acceleration signal is 0.28% and that from the GPS displacement signal is 0.31%.
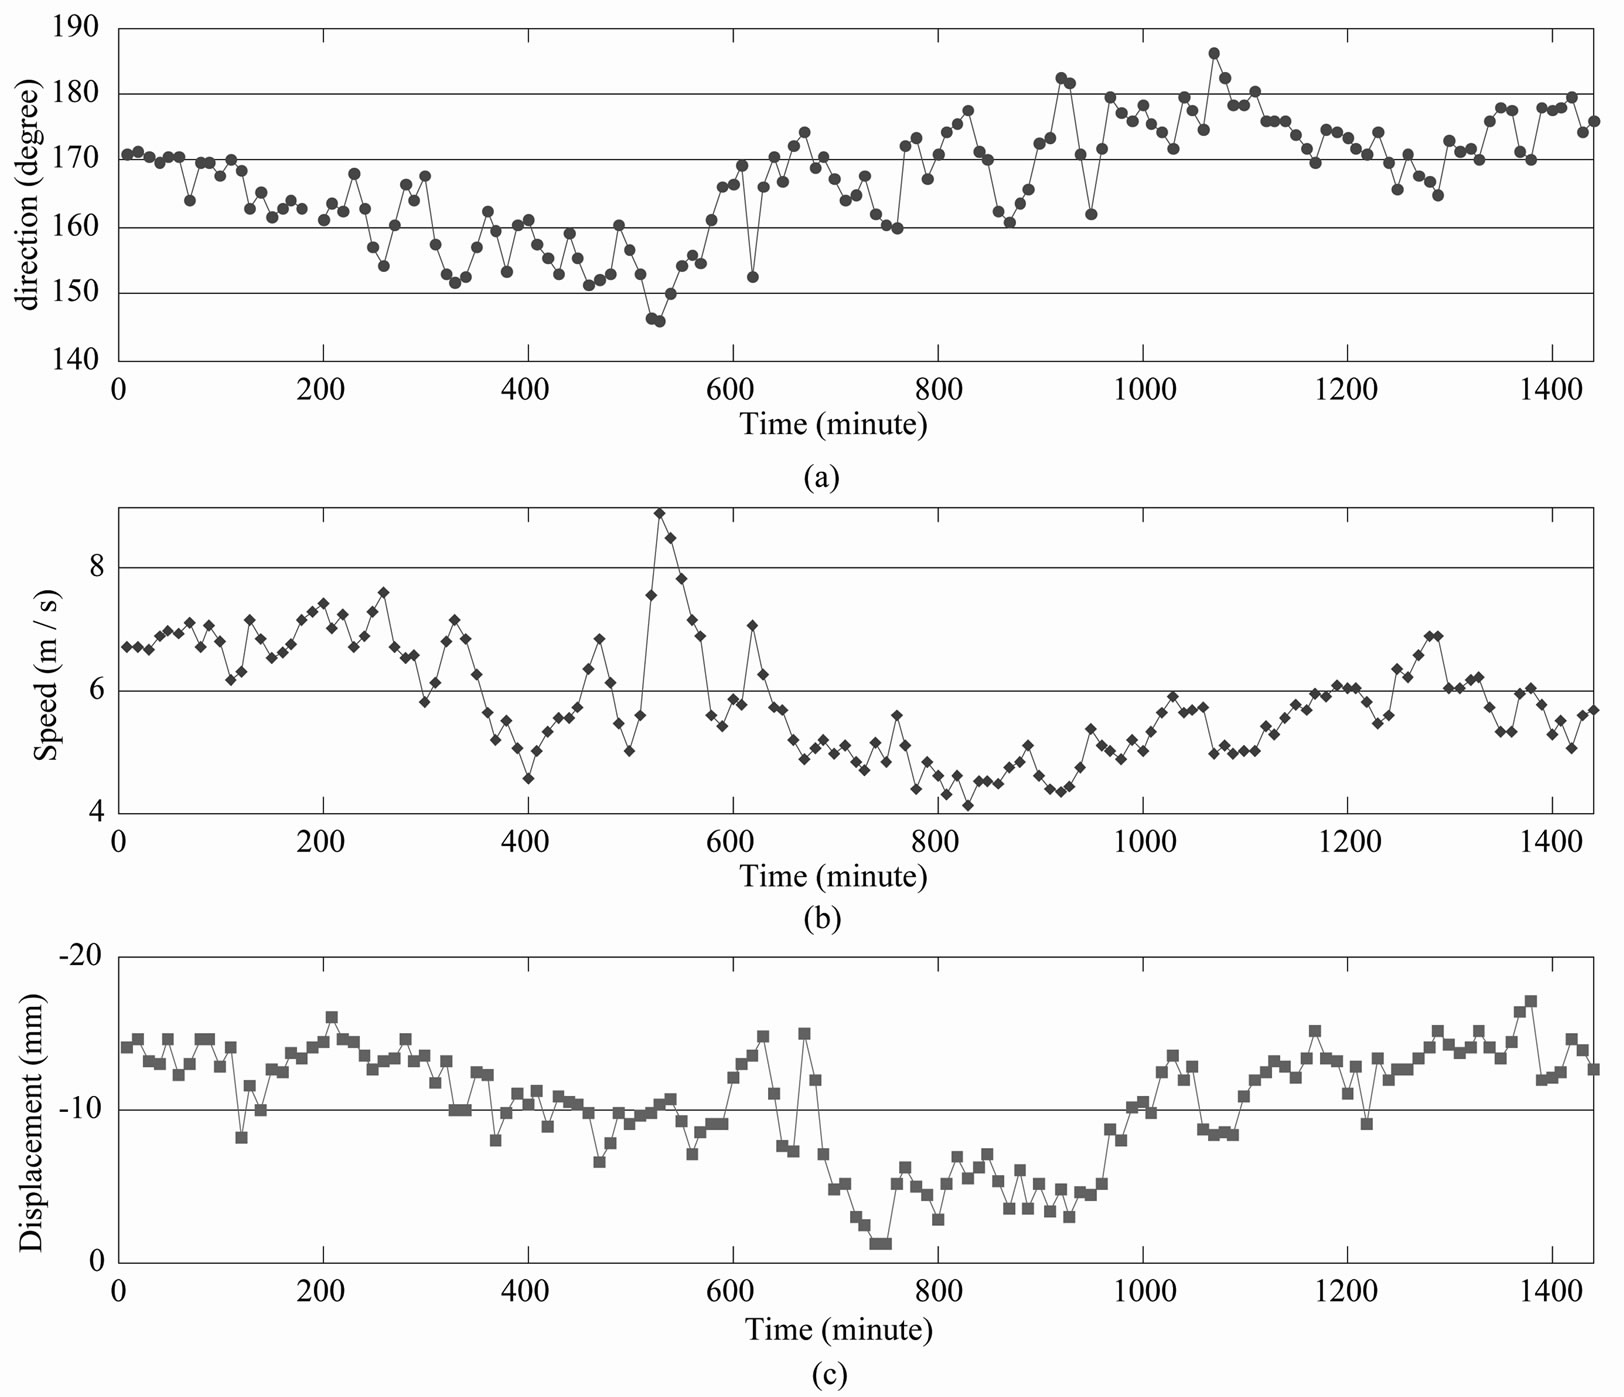
Figure 14. Wind-induced quasi-static responses and the corresponding wind information. (a) 10 minute mean valude of wind direction ( + X is the zero direction). (b) 10 minute mean valude of wind speed. (c) 10 minute mean valude of displacement.

Figure 15. Comparison between frequency spectra of displacements from GPS and accelerations from accelerometers. (a) logarithmic scale plot. (b) linear scale plot.
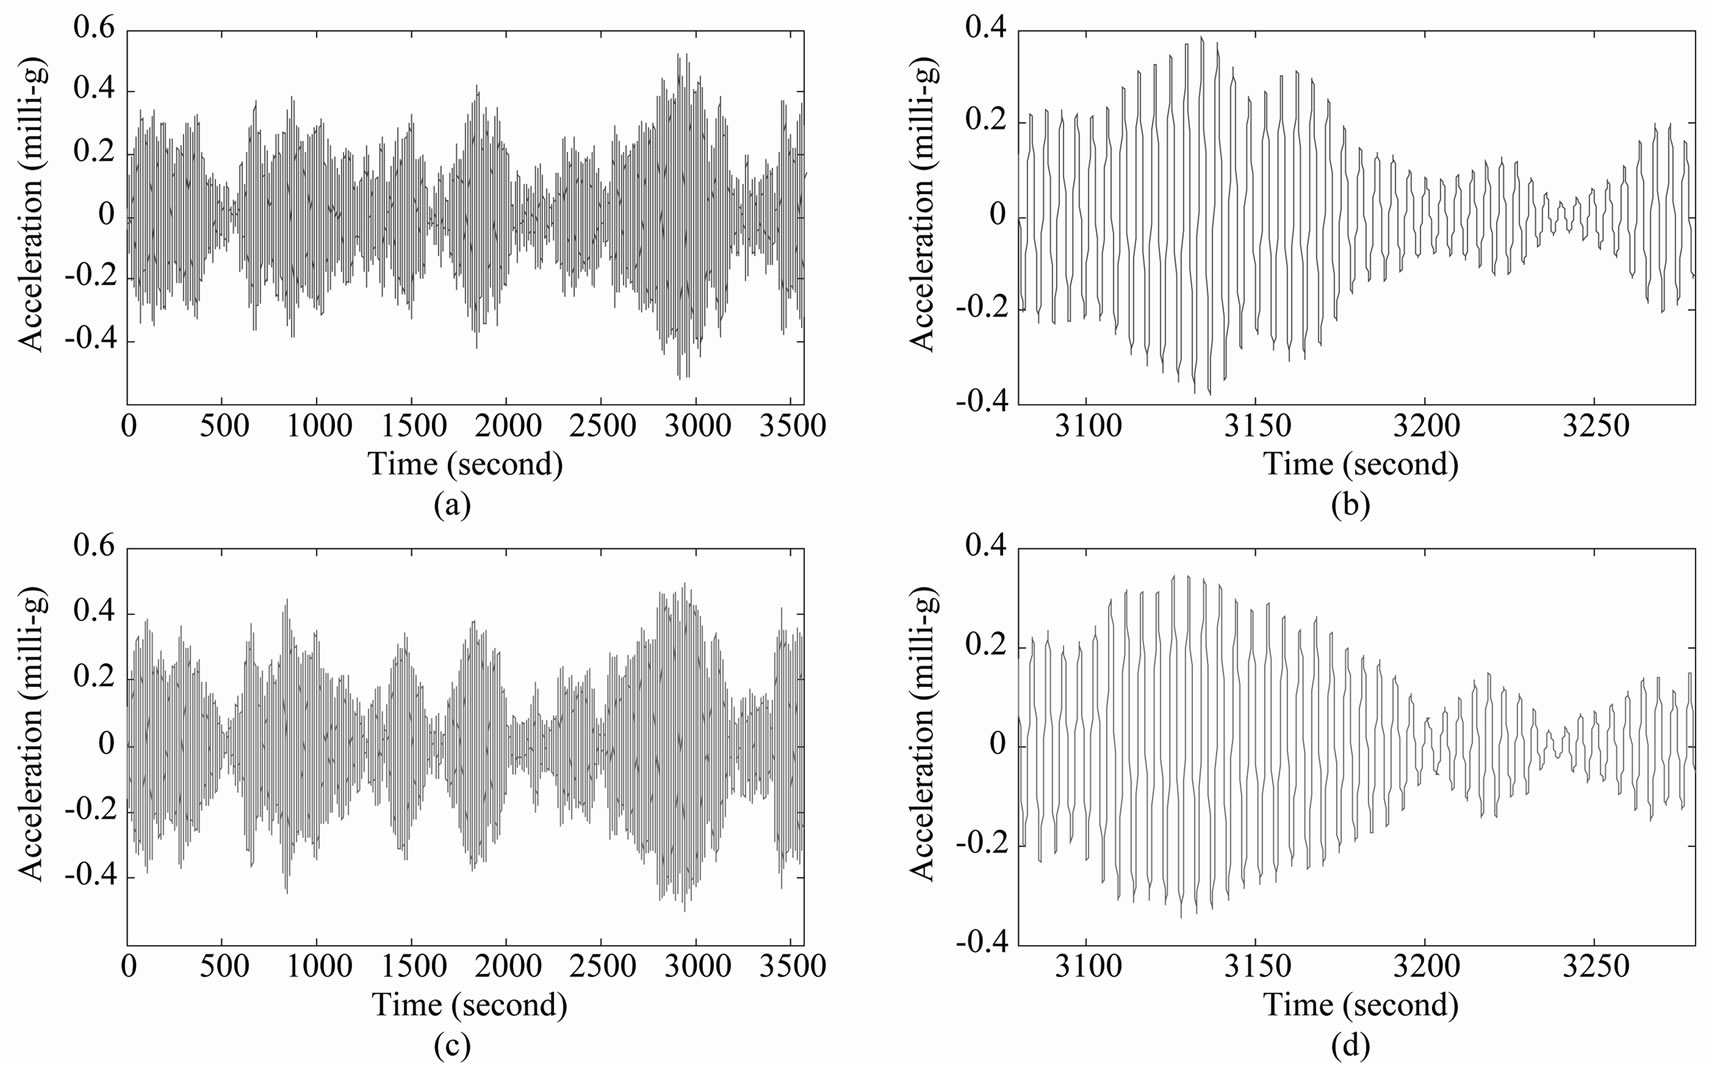
Figure 16. Comparison between accelerations determined from GPS and accelerometer measurements. (a) GPS-derived acceleration (X direction). (b) Zoom in 200 second window from a. (c) Accelerometer-measured acceleration (X direction). (d) Zoom in 200 second window from c.
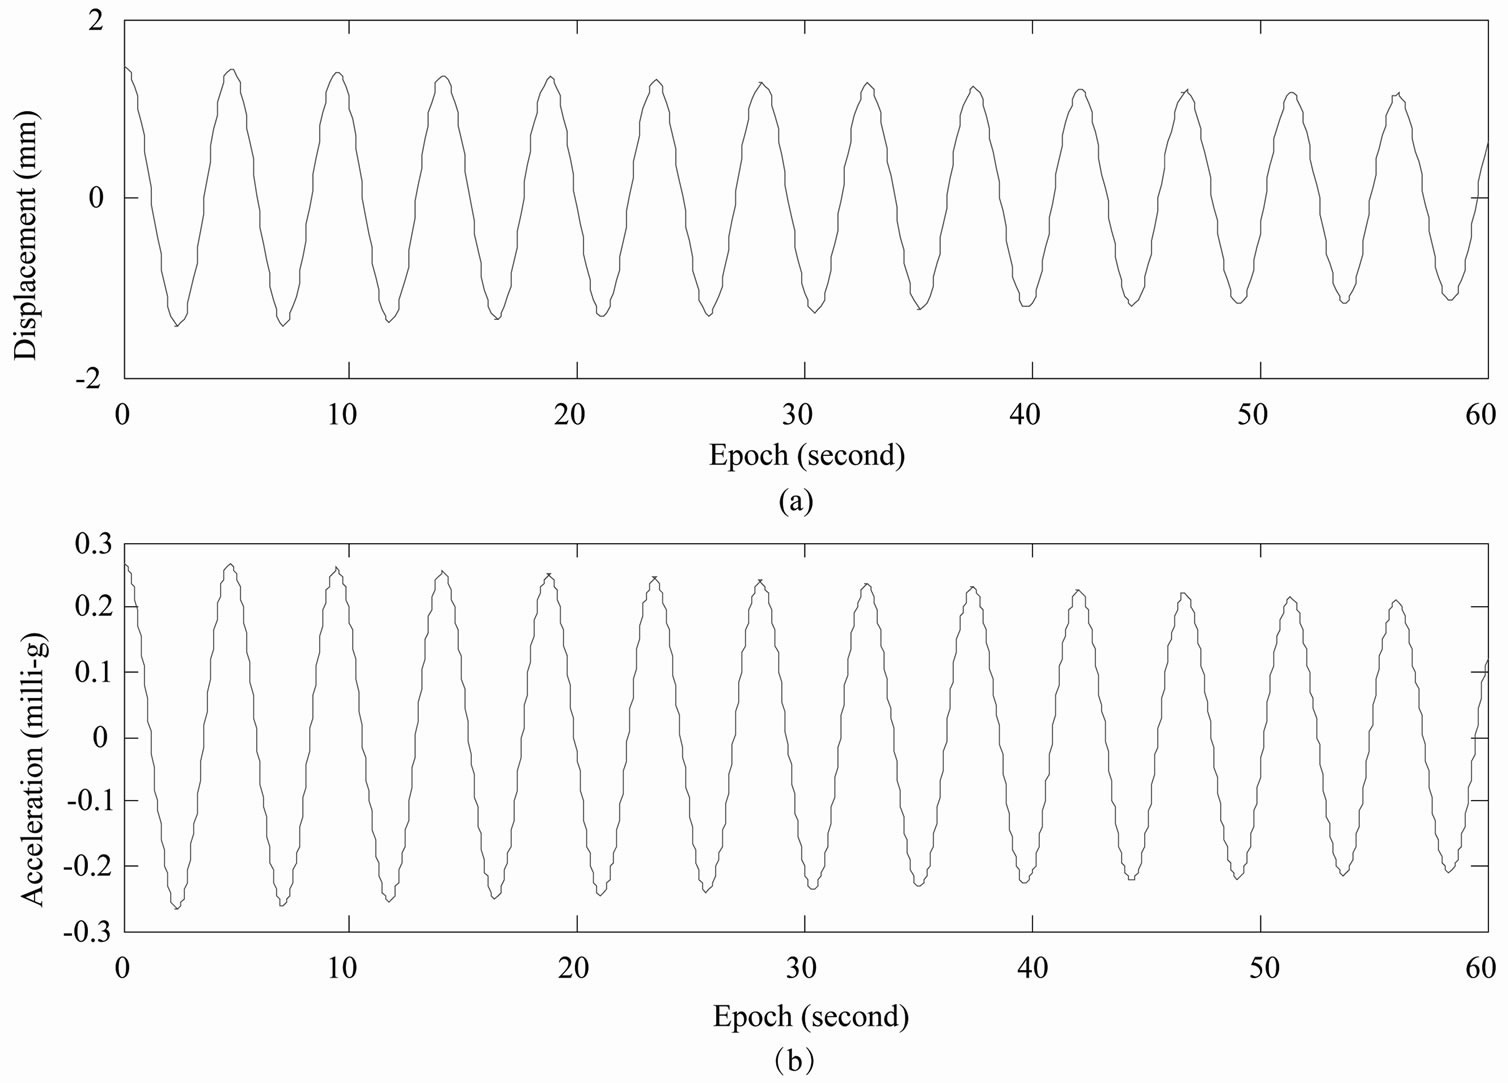
Figure 17. Random decrement signatures obtained from GPS and accelerometer measurements. (a) Displacement random decrement signature (X direction at wing). (b) Acceleration random decrement signature (X direction at wing).
6. Conclusions
The results from a field monitoring program of a tall building with GPS and accelerometers during periods of low to moderate wind speeds have been presented. The natural frequencies of the wind-induced vibration of the building were determined based on the measured time series of accelerations and displacements. A significant torsional component was observed in the results. The structural damping values estimated for the first three modes of vibration using the random decrement technique are 0.28%, 0.37%, and 0.35% of critical damping respectively. The low damping values are consistent with the low response magnitudes associated with the modest wind speeds.
The results have shown that GPS can be used effectively for the measurement of wind-induced responses of tall buildings, including both the dynamic resonant responses and the quasi-static responses. The GPS results agreed well with those from the accelerometers in both the time and frequency domains.
7. Acknowledgements
The authors wish to thank Ove Arup & Partners Hong Kong Ltd. for its cooperation in the monitoring of the test building. Thanks also go to the staff of CLP Power Wind/Wave Tunnel Facility at The Hong Kong University of Science and Technology. The research project is funded by the Research Grants Council of Hong Kong (Project CA04/05.EG01).