The Relationship between Salinity and Bacterioplankton in Three Relic Coastal Ponds (Macchiatonda Wetland, Italy) ()
1. Introduction
The great environmental importance of wetland areas is linked to the high biodiversity of the flora and fauna they support, so that the international Ramsar Convention, already in 1971, focused on these areas, highlighting the need to preserve them. Wetlands prevent coastal erosion and increase the productivity of the coast, being focal points of biological diversity [1,2]. The term “wetlands” encompasses different kind of sites, all sharing a large productivity and a limited depth, and playing a significant role in coastal biogeochemical cycles. Wetlands act as natural purifiers, especially for phosphorus and nitrogen, which are retained and made bioavailable to higher trophic levels [3-5]. The bacterial communities that thrive therein play, of course, a key role in these processes [6,7], and their diversity depends on environmental factors.
Both abiotic and biotic factors, indeed, can bias the survival of all the bacterial taxa or some of them, so determining both quantitative and qualitative differences in the bacterial community composition. A typical example of such an environmental factor is salinity, which varies across natural aquatic systems due to differences in the ratio of precipitation to evaporation [8].
To monitor the diversity of the microbial components in salty wetlands will help to understand the influence of salinity on the dynamics of the bacterial community that thrive therein, and to develop environmental indicators and strategies to improve the preservation of these ecosystems [9,10].
The aim of this study was to analyse the seasonal variation of the bacterial community in the wetland of Macchiatonda, a natural reserve located North of Rome (Italy). Three ponds, which differ mainly for their salinity, so allowing to evaluate the effect of this factor on bacterioplankton diversity and composition, form the Macchiatonda wetland.
2. Material and Methods
2.1. Sampling Area
The Macchiatonda Nature Reserve is a 250 hectares-wide relict drainage area [11] on the Tyrrhenian coast, located 50 km North of Rome, within the Santa Marinella municipality. It encloses a wetland area of standing waters spanning for about 1 km along the coast, and consisting of three distinct coastal ponds (Figure 1). Two of these, Alberobello and Piscinula, are close to the waterline and undergo marine ingressions during sea storms; the third one, Didattico (the Italian for “Educational”), is located more inland, where there is not direct seawater input [12].
The sampling strategy was defined after conducting a preliminary collection of data about the abiotic characteristics of the ponds. A single sampling station (Station 1) was chosen in Didattico, that is an artificial circular pond of constant depth, (about 1.5 mt when completely filled), where the water forms a ring around a central circular islet.
Two sampling stations were chosen in each Alberobello and Piscinula ponds, which are natural wetlands.
Alberobello pond is formed by a net of channels (station 2, max depth about 60 cm), carrying water to a major water hole (Station 3, max depth about 90 cm). Piscinula pond is a continued wetland with little islands inside, with a shallower portion (Station 4, max depth 60 cm) and a deeper area (Station 5, max depth 1 mt) at the South Eastern edge of the reserve.
The sampling stations were identified in situ by GPS coordinates (Table 1). Samples were taken from the 5 stations, in June, September, December 2009 and March 2010, in the late morning (10 - 12 a.m.).
2.2. Field Measures and Sampling
In each sampling station, temperature, salinity and pH were measured with a multiparametric probe Multi 340i (WTW, Udine, Italy). Salinity was measured using the Practical Salinity Scale. Soon after the measurements were taken, five liters of water were collected from each sampling station.
The water samples were kept cool and under the dark during transport to the laboratory, then stored (at 4˚C under dark), until processed for microbiological analyses (within 6 hours).
2.3. Bacterial Community DNA Extraction
Five 1 L aliquots, from each sample were centrifuged at 15,000 g for 20 min to proceed to DNA extraction [13]. The DNA extraction followed the protocol described in Rossolini et al. [14] with slight modifications inserted from Zhou et al. [15]. Each pellet was mixed with 1 ml of extraction buffer Solution 1 (50 mM Tris-HCl pH 8, 20% sucrose, 50 mM EDTA, 10 mg/ml lysozyme) and kept 30 min a 37˚C. The samples were then treated with
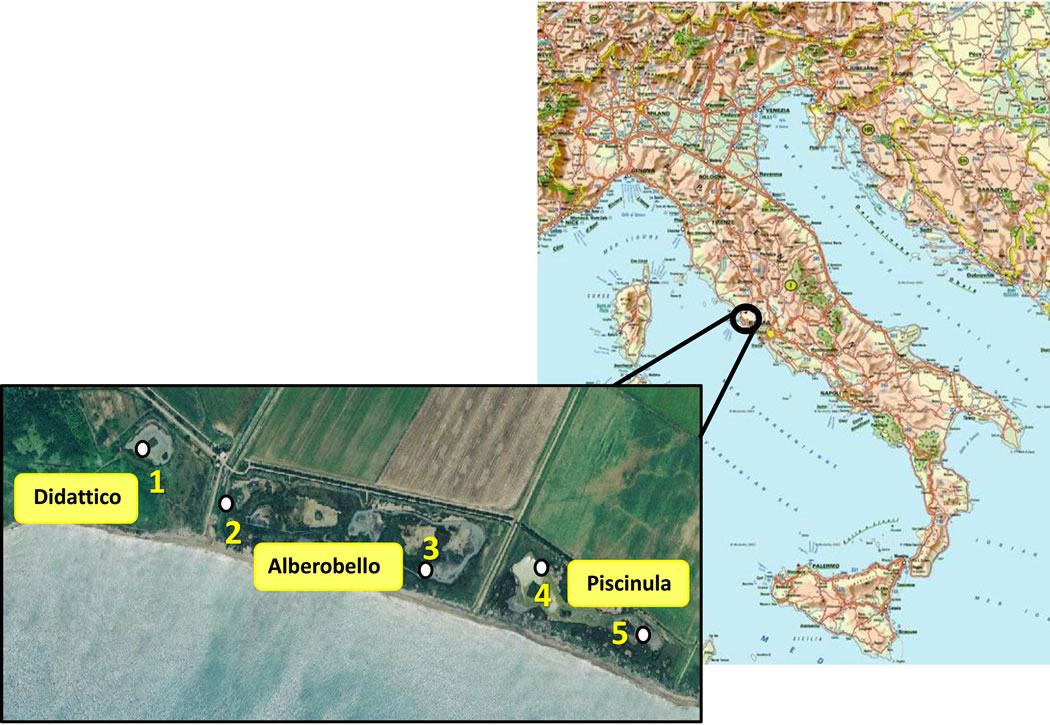
Figure 1. Geographical localization of the sampling stations in the Macchiatonda wetland.

Table 1. UTM-RD50 coordinates of the sampling stations.
4 ml of extraction buffer Solution 2 (50 mM NaCl, 1% CTAB, 35 μl of 10 mg/ml proteinase K solution) kept at 37˚C for 30 min and shaken by inversion every 10 min. After the shaking treatment, 0.5 ml of 20% Sarkosyl (Sigma-Aldrich, USA) was added, and the samples were incubated at 65˚C (2 hs) under gentle inversion. After centrifugation at 6000 g (10 min) at room temperature, the supernatants were collected and mixed with an equal volume of preheated (to 60˚C) phenol-chloro-formisoamyl alcohol (25:24:1) (Applichem, Germany). The aqueous phase was recovered by centrifugation (4000 g) at 4˚C and precipitated with sodium acetate 3 M pH 5.2 (1/10 volume) and ethanol (2 volume). The pellet obtained after centrifugation at 15,000 g was rinsed in 70% ethanol (Sigma-Aldrich USA) and stored in 100 μl TE buffer at −20˚C until PCR amplification. The metagenomic DNA extracted from the aliquots coming from the same station were pooled and subjected to the SSCP analysis.
2.4. PCR Amplification of 16S rRNA
PCR amplification targeting bacterial 16S rRNA genes was performed with forward primer Com1 (5’-CAGCA GCCGCGGTAA TAC-3’ positions 519 to 536) and reverse primer Com2Ph (5’-CCGTCAATTCCTTTGAGT TT-3’ positions 907 to 926). Reverse primer was phosphorylated at 5’ end. Both primers hybridize to phylogenetically conserved regions within the 16S rRNA genes and amplify a 407 bp fragment encompassing the two phylogenetically highly variable regions, V4 and V5 [16,17]. Amplification reactions were carried out in a 100 μl volume with 100 pmol of each primer in GoTaq Green Master Mix buffer (Promega, Madison, W.I.) and 2 μl of the DNA solution in TE buffer diluted 1:30 [18]. The following cycling conditions were used: 3 min at 94˚C, 30 cycles (1 cycle consists of 1 min at 94˚C, 1 min at 50˚C, and 70 s at 72˚C), and 5 min at 72˚C. PCR products were purified with E.Z.N.A. Cycle-Pure Kit (OMEGA bio-tek, USA).
2.5. SSCP Analysis
SSCP analysis was done according to Schwieger and Tebbe [16]. PCR products, containing both the phosphorylated and the unphosphorylated strands were then processed. The phosphorylated strand was removed with λ-exonuclease digest (Fermentas, Lithuania) according to the manufacturer’s instructions. Single-stranded DNA was purified with E.Z.N.A. MicroElute Cycle-Pure Kit (OMEGA bio-tek, USA) and resuspended in 10 μl of TE buffer. Before the electrophoretic run, 3.5 μl of singlestranded DNAs were mixed with an equal volume of denaturing loading buffer (95% formamide, 10 mM NaOH, 0.25% bromophenol blue, 0.25% xylene cyanol). Samples were incubated at 95˚C for 2 min and immediately cooled on ice. The samples were subjected to electrophoresis in a 0.625 × MDE gel (Lonza, Switzerland) with 1 × TBE buffer. The gels (16 cm in length, 0.4 mm in thickness) were run at 250 V, 8 mA for 17 h at 25˚C in an adjustable slab gel kit (C.B.S. Scientific Co., USA). The gels were silver stained according to the procedure of Bassam et al. [19]. Single bands from SSCP profiles were excised with a sterilized scalpel, transferred to microtubes containing 50 μl of crush and soak buffer (0.5 M ammonium acetate, 10 mM magnesium acetate, 1 mM EDTA, 0.1% SDS) and incubated at 37˚C for 3 h. The DNA was precipitated with ethanol, centrifuged and resuspended in 12 μl of TE buffer. For each sample, 2 μl of DNA solution were reamplified under the same conditions described above and the PCR product was standard sequenced by automated capillary sequencing (Macrogen Europe, The Netherlands).
To identify the closest taxon represented by a single band, each sequence was compared with those available in the Ribosomal Database Project (RDP; Maidak et al., 1997) and subjected to BLAST analysis using the National Center for Biotechnology Information database [20].
2.6. Statistical Analysis
2.6.1. Cluster Analysis
Similarity scores between the different PCR-SSCP fingerprinting from the samples were performed using the Jaccard correlation coefficient. The cluster analysis and dendrogram generation were carried out with the Phoretix 1D, TotalLab software (Phoretix International, United Kingdom).
Non metric Multi Dimensional Scaling (n-MDS; PAST software version 1.34 [21]) was used to analyze the fingerprintings. The software calculates a score of the goodness of fit for data points, named stress; when the stress value is lower than 0.2 the representation of the relationships between samples is acceptable.
2.6.2. NPMANOVA
The non-parametric multivariate ANOVA (NPMANOVA) was used to determine significant differences between SSCP banding profiles groups [22] using PAST software version 1.34 [21].
2.6.3. Shannon-Wiener Index
The SSCP bacterial profile represents the fingerprint of one sample (one station, one season) and shows the presence/absence of each taxon. The image analysis software assesses the presence or the absence of each band and its intensity, and quantifies the fingerprint of each lane. On this basis, fingerprints can be compared to each other. The Phoretix 1D, TotalLab (Phoretix International, UK) software carries out a density profile, detecting the bands, and calculating the relative contribution of each band to the total band intensity in each lane, after subtracting a rolling disk background value. This density profile was used to determine the Shannon-Weaver Diversity Index (H’) for each line.
3. Results
3.1. Abiotic Factors
In the three ponds, temperature and salinity show a clear seasonal cycle, while pH remains mostly constant (Table 2). Temperature varies seasonally, the lowest values are found in December (3˚C - 5˚C) and the highest in June (26˚C - 31˚C). Salinity values are always higher in Alberobello and Piscinula ponds, than in Didattico. In the ponds Alberobello and Piscinula the lowest values are found in March (13 - 23) and the highest in June/September (43 - 55), respectively. In the Didattico pond, the lowest salinity value is found in March (6.5), the highest in September (22). Salinity varies in ponds according to differences in the ratio of precipitation to evaporation. The yearlong rainfall rate is reported in Table 2. Depending on the low rainfall rate in summer, a minimum water level is reached in all ponds during the summer/autumn season. Particularly, due to the sloping gradient of the Alberobello pond, Station 2 remains almost completely dry from July until the autumn rains (the photograph of the dry site is in the supplemental material). Dryness favors anoxic conditions and slight acidification; as a result, in the Alberobello Station 2, pH drops to 6.1 in September. Differently pH values in the Alberobello Station 3 and in Piscinula pond (both Stations), range annually between 7.7 and 8.8. In the Didattico pond, pH ranges annually between 8.2 and 9.0.
3.2. Bacterial SSCP Profiles Analysis
Alberobello and Piscinula showed similar fingerprints (NPMANOVA, n.s.), while Didattico fingerprints are significantly different to both (NPMANOVA, p < 0.05; Figure 2). Alberobello and Piscinula reached the highest diversity in June (H’ between 2.18 and 2.59; Table 3), while their lowest diversity was found in the period from
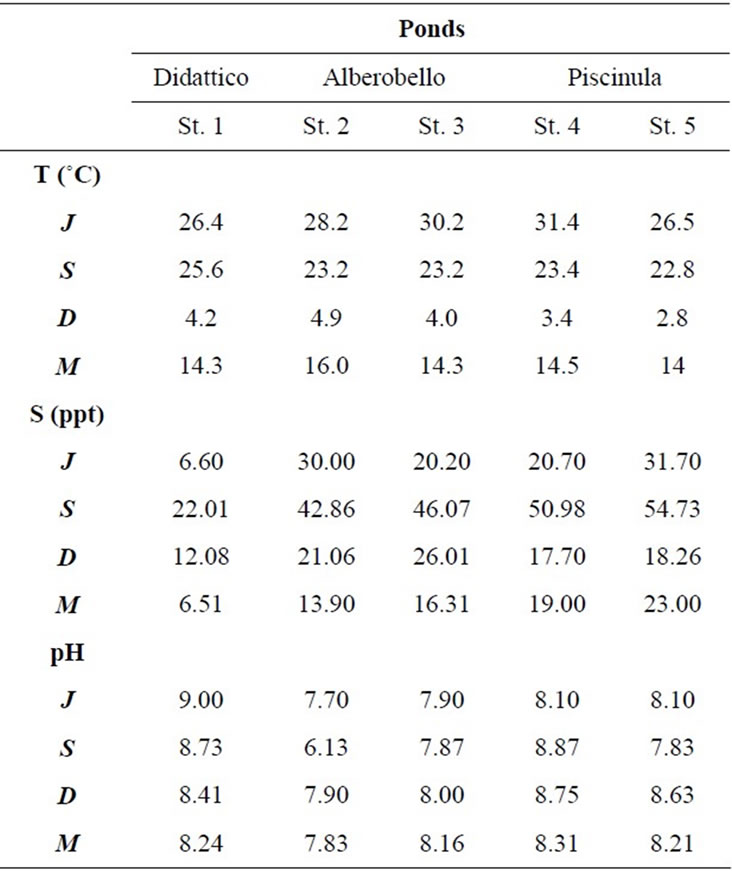
Table 2. Temperature, salinity, and pH values in the five sampling stations from July 2009 to March 2010 (J = July, S = September, D = December and M = March).
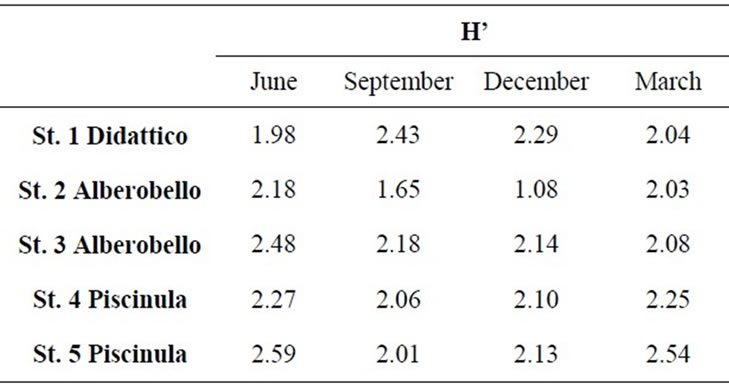
Table 3. Diversity of bacterial component, as Shannon Index (H’), from SSCP fingerprints of samples collected in the five sampling stations from June 2009 to March 2010.
September to December (H’ between 2.01 and 2.18; Table 3). Didattico reaches the highest diversity from September to December (H’ from 2.43 to 2.29; Table 3), while lower values were found in June and March (H’ from 1.98 to 2.04; Table 3). To confirm the similarities between Alberobello and Piscinula, the fingerprint patterns of the four stations were further analyzed by cluster analysis and n-MDS. The results depicted in Figure 2(b) show how the two ponds cluster together in three groups according to the seasons.
One cluster includes all June samples, the other the September ones and the last group includes March and December samples.
 (a)
(a) (b)
(b)
Figure 2. (a) Cluster analysis of SSCP profiles from the three ponds (in the different sampling stations and seasons). Each sample is identified by a 3 letters code: the 1st letter represents the site (D = Didattico, A = Alberobello, P = Piscinula), the 2nd the sampling station (1 = St. 1, 2 = St. 2, 3 = St. 3, 4 = St. 4, 5 = St. 5) and the 3rd the season (J = June, S = September, D = December, M = March). (b) nMDS analysis of SSCP profiles from Alberobello and Piscinula, in the different sampling stations and seasons. Each sample is identified by the same 3 letters code as in Figure 2(a). Colour circles highlight grouping: June (yellow), September (red), March and December (together, green).
3.3. Sequence Analysis of Selected Bacterial SSCP Bands
The more intense bands in the bacterial SSCP gels were re-amplified and sequenced to identify the prevalent microbial taxa, to the order level. In Alberobello and Piscinula, the prevalent populations belong mainly to Rhodobacterales (α-Proteobacteria) and Flavobacteriales (Bacteroidetes); in Didattico, they belong to Burkholderiales (β-Proteobacteria).
4. Discussion
The yearlong dynamics of the microbial assemblages from three ponds (Alberobello, Piscinula and Didattico) of the Macchiatonda Natural Reserve wetlands (Rome, Italy) has been studied. Alberobello and Piscinula are salty ponds close to the waterline, exposed to marine ingressions and receiving no freshwater input, other than occasional rainfall. The Didattico pond, located more inland, is always less salty. The bacterial communities in the three ponds, analyzed by SSCP, differ between ponds and seasons, mainly driven by both temperature and salinity.
The digital analyses of the bacterial community profiles, the Shannon Index and the dominant bacterial populations (16S sequencing of the more intense bands) are similar in Alberobello and Piscinula and cluster in three groups by season. The first group encompasses the samples collected in June (high salinity), the second those obtained in September (very high salinity), and the last one the samples of March-December (low salinity). In the salty ponds the highest diversity values were found in June, whereas in September and December the diversity was lower. A dramatic reduction of diversity was found in September at Station 2 (in Alberobello) due to the almost complete drying up of this site in the summer months (high temperature and no rainfall), which favored anoxic conditions and acidification.
The entire set of results was different for Didattico, the less salty pond, in which the highest diversity was observed in September, along with the highest salinity values.
The identification of the more intense SSCP bands further confirms the differences in the community composition between Alberobello/Piscinula and Didattico. In fact, the most common bacteria in the first two ponds belong to the order Rhodobacteriales, frequently found in shallow sea coastal waters [23,24] whereas in Didattico, the main populations belong to Burkholderiales, an order commonly found in fresh water ponds, rice paddies, etc. [25-28].
Our results agree both with the observation of Wu et al. [29], which stated that salinity plays a key role in the control of the bacterioplankton community at the regional scale, and with the observation of Wang et al. [8], which found an increase in microbial richness at increasing salinity in freshwater and saline systems. These results are consistent with the hypothesis that salinity is a dominant environmental force for prokaryotic community composition [30-35].
The pivotal role of salinity in shaping bacterial community can be highlighted by plotting the bacterial diversity (H’ index) of all samples (three ponds and four seasons) against the corresponding salinity value. The relationship between salinity and H’ is represented by an inverted U-shaped curve, as drawn in Figure 3. Species diversity varies along the salinity gradient reaching maximum diversity at concentrations between 20 and 30; otherwise, diversity decreases at both lower and higher salinity concentrations. The two outliers correspond to the dry and acidified condition of Alberobello Station 2 (September and December).
The U-shaped curve we found represents a non-linear relationship of salinity-diversity in agreement with literature data. In fact, in freshwater systems the microbial diversity is known to be lower than in marine ones [36], while in hypersaline systems the microbial diversity decreases with increasing salt concentration [37-41]. At intermediate salinity levels, the wider niche availability for both halotolerant species and limnotolerant species is responsible for the increase in taxon richness [29].
In the Macchiatonda wetland, the variation of diversity along the salinity gradient can be interpreted in the framework of the Intermediate Disturbance Hypothesis (IDH), as salinity poses limitations to the growth or the survival of microorganisms [42-45]. IDH has not been always able to correlate microbial dynamics to salinity: in fact, in some estuaries [46,47] and in the Baltic Sea [48] the microbial diversity remained constant along a salinity gradient. However, these results refer to ecosystems characterized by different dynamics (estuaries or seas) that cannot be compared to the standing waters of the ponds in Macchiatonda.
5. Conclusions
The Macchiatonda Natural Reserve is a Site of Community Importance (SIC) where both peculiar vegetation and highly diversified migratory and sedentary avifauna can be found [11].
This wetland is regarded as a relic ecosystem, as it is representative of the biodiversity once present along the entire coast, which nowadays has been irretrievably destroyed by land drainage. European actions have been carried out both to restore this wetland habitat [12] and to avoid its regression and the subsequent dystrophic effects that could affect both the riparian flora and the hosted avifauna.
In this study, we demonstrated that neighboring basins at different salinity differ in microbial community composition and dynamics. Our data highlight the role of salinity in shaping the bacterial assemblages. In fact, molecular analyses illustrated the differences in the composition of the bacterial assemblage between ponds and seasons. The clear-cut differences between the ponds of Alberobello/Piscinula and Didattico confirm salinity as a
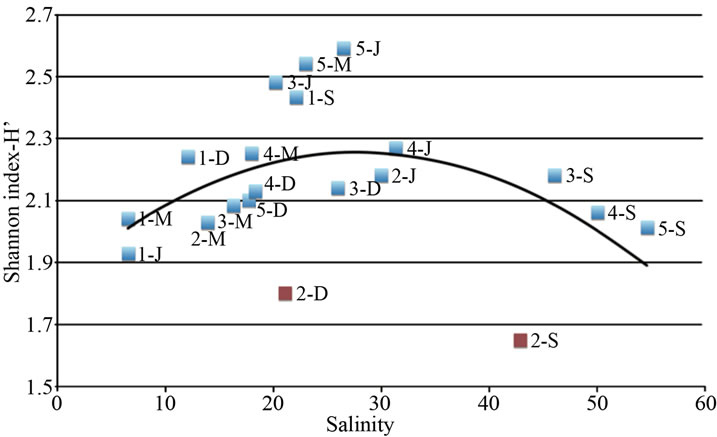
Figure 3. Relationship between species diversity (as Shannon Index, H’) determined by the image analysis on the fingerprint of each sample (one station, one season) and salinity determined in the different sampling stations and seasons. Two outlayers are found (Alberobello Station 2 September and December), corresponding to dry and acidified condition of the station.
driver of bacterioplankton seasonal diversity.
6. Acknowledgements
This work was supported by “Fondazione CARICIV (CAssa di RIsparmio di CIVitavecchia)” 2009 and 2010 research or scholarship grants to MCT and LM, respectively, by commitment of the Comune di Santa Marinella (Rome, Italy).
Thanks are due to Phoretix International, UK, for the trial use of Phoretix 1D, TotalLab.
The authors are grateful to all the Macchiatonda Natural Reserve Rangers and to the entire Tor Vergata laboratory staff, which pleasantly and efficiently helped the Authors during all the phases of the work, in particular thanks are due to Astrid Mejia and Alice Rotini who revised and edited the manuscript. Authors are also grateful to Federica Tamburi for her help in drawing and handling figures.