Antibody to MyoD or Myogenin Decreases Acetylcholine Receptor Clustering in C2C12 Myotube Culture ()
1. Introduction
Skeletal muscle development is guided by myogenic regulatory factors including MyoD (myf3), myogenin (myf4), myf5, and MRF4 (myf6). This family of basic helix-loop-helix transcription factors binds to the E-box found in the promoters or enhancers of many muscle-specific genes which results in high levels of transcription [1-5]. Experiments with knockout mice helped establish the temporal expression pattern of the myogenic regulatory factors. MyoD and myf5 are essential for myoblast identity [6-8], while myogenin is essential for myoblast differentiation [9,10]. MRF4 does not appear to be essential for myogenesis, but instead is highly expressed in adult skeletal muscle fibers [11-15]. While single null mutations of MyoD, myf5, and MRF4 are not lethal [6,7,16], the null mutation for myogenin results in severe muscle deficiency due to inadequate secondary muscle fiber development, and subsequent neonatal death [9,10,17].
Using C2C12 cell culture, western blots revealed that MyoD was expressed in proliferating myoblasts and myotubes, while myogenin was expressed in myotubes only, and MyoD increased myogenin gene expression [18]. Skeletal muscle cell cultures, such as the C2C12 cell line derived from mouse hindlimb, provide simplified systems for studying myogenesis as well as the development of the postsynaptic component of the neuromuscular synapse [19,20].
During development of the neuromuscular synapse both the concentration and location of acetylcholine receptors (AChRs) on the skeletal muscle cell surface is regulated [21], resulting in a mature neuromuscular synapse with a concentration of AChRs that is 1000 times as great as that found extrasynaptically [22]. AChRs aggregate and co-localize with a large number of other molecules, including a muscle specific kinase (MuSK) [23] and rapsyn [24,25]. Indeed, MuSK is essential for the signaling events that precede neuromuscular synapse formation [26-29] and rapsyn is essential for the formation of AChR clusters during neuromuscular synapse formation [30]. In addition to increasing myogenin gene expression, MyoD also targets MuSK and rapsyn gene expression, while myogenin targets rapsyn but not MuSK gene expression [18]. Moreover, myogenin activates genes for AChR subunits [31,32]. This suggests that myogenic regulatory factors like MyoD and myogenin may be intricately linked to the development of the postsynaptic component of the neuromuscular synapse.
Cultured myotubes cluster AChRs spontaneously and respond to application of motor neuron derived agrin with an increase in the frequency of AChR clusters [33,34]. Agrin was first isolated because of its ability to cluster AChRs in cell culture [35], and plays a major role in assembly of the postsynaptic component of the neuromuscular synapse [36]. Agrin binds to low-density lipoprotein receptor-related protein 4 (Lrp4) [37,38] to stimulate tyrosine phosphorylation of MuSK [28] and the consequent signaling pathway that includes the AChR β subunit and leads to increased AChR clustering [39,40]. In addition, AChRs are required for the agrin-induced aggregation of MuSK at the neuromuscular synapse [41].
Using an immortalized rat muscle cell line, RNA interference experiments revealed that myogenin expression was necessary for robust spontaneous AChR clustering [42]. Our objective was to use the C2C12 cell culture model to test the hypothesis that both MyoD and myogenin were required for agrin-induced AChR clustering and the fusion of myoblasts into myotubes. We report that antibody to either MyoD or myogenin decreases the frequency of agrin-induced AChR clustering without affecting myotube formation. We conclude that agrin-induced AChR clustering requires both MyoD and myogenin.
2. Materials and Methods
2.1. Cell Culture Maintenance
C2C12 myoblasts were derived from mouse hind limb [19,20], and are commonly used for skeletal muscle cell culture experiments. They are ideal for studying acetylcholine receptor (AChR) clustering and myoblast fusion to form myotubes. For normal maintenance of C2C12 cell culture, myoblasts were first plated in growth medium (GM) on 10 cm plates at approximately 20% confluence. GM consists of Dulbecco’s modified Eagle’s medium (DMEM) plus 20% fetal bovine serum, 0.5% chick embryo extract and 100 U/ml penicillin. GM was replaced daily, and myoblast cultures were split into new plates at approximately 60% confluence. For formation of myotubes, myoblasts were plated in GM on 22 × 22 mm cover slips that had been flamed in 200-proof ethanol and placed in 6-well plates. GM was replaced daily. After 48 hours in GM, myoblast cultures typically reached 80% confluence, and cultures were then switched to differentiation medium (DM). DM consists of DMEM plus 2% horse serum and 100 U/ml penicillin. DM was replaced daily as myoblasts fused to form myotubes, and cultures were maintained for 72 hours in DM. The incubator was maintained at 37˚C under 8% carbon dioxide and 100% humidity.
2.2. MyoD and Myogenin Expression in Cell Culture
Some C2C12 cell cultures were fixed each day cells grew on 22 × 22 mm cover slips in GM and DM. Cover slips were rinsed three times with phosphate buffered saline (PBS), fixed for 10 minutes with 2% paraformaldehyde in PBS, rinsed three times with PBS, incubated for 10 minutes with 0.2% Triton X-100 in PBS, rinsed three times with PBS, and then incubated for 60 minutes with 5% bovine serum albumin (BSA) in PBS as a blocking agent. Cover slips were then incubated for 60 minutes with a mouse monoclonal primary antibody to MyoD (Santa Cruz Biotechnology sc-71629) or myogenin (Santa Cruz Biotechnology sc-12732) at 1:10 in the BSA blocking agent, rinsed three times in PBS, and then incubated with a TRITC anti-mouse fluorescent secondary antibody (Molecular Probes) at 1:200 in the BSA blocking agent. After rinsing three times in PBS, cover slips were dehydrated in cold methanol for 5 minutes at −20˚C, and mounted on microscope slides in Vectashield Mounting Medium for Fluorescence (Vector Laboratories). Fluorescent staining was visualized with an IX70 Olympus inverted microscope under the 20× objective (yielding a total magnification of 200×), and fluorescent images were captured as high-resolution JPG files with an Olympus camera with Magnafire digital imaging software. MyoD and myogenin expression was determined by counting fluorescent and non-fluorescent nuclei and calculating what percentage of nuclei was fluorescent each day in GM and DM. Nuclei were counted from images captured as JPG files for each day in GM and DM.
2.3. Endo-Porter Use in Cell Culture
To verify the ability of Endo-Porter (Gene Tools) to increase intracellular antibody, some cell cultures were treated with 1.00 μg/ml antibody for MyoD and 6 μM Endo-Porter at 24 hours in GM and fixed at 48 hours in GM, while other cell cultures were treated with 1.00 μg/ml antibody for myogenin and 6 μM Endo-Porter at 48 hours in DM and fixed at 72 hours in DM. Antibody and Endo-Porter were added 24 hours prior to fixation to maximize the possibility of visualizing increased intracellular antibody. These cell cultures were compared to others that were treated with antibody alone for the same time period. The Endo-Porter concentration used was recommended by the manufacturer as allowing optimal cell access with minimal cell damage. Cover slips were rinsed three times with PBS, fixed for 10 minutes with 2% paraformaldehyde in PBS, rinsed three times with PBS, incubated for 10 minutes with 0.2% Triton X-100 in PBS, rinsed three times with PBS, and then incubated for 60 minutes with 5% BSA in PBS as a blocking agent. Cover slips were then incubated with a TRITC antimouse fluorescent secondary antibody at 1:200 in the BSA blocking agent. After rinsing three times in PBS, the cover slips were dehydrated in cold methanol for 5 minutes at −20˚C, and mounted on microscope slides in Vectashield Mounting Medium for Fluorescence. Fluorescent staining was visualized with an IX70 Olympus inverted microscope under the 20× objective (yielding a total magnification of 200×), and fluorescent images were captured as high-resolution JPG files with an Olympus camera with Magnafire digital imaging software.
2.4. Experimental Manipulations with Antibody for MyoD or Myogenin
C2C12 cell cultures were either maintained as controls or were exposed to antibody for MyoD or myogenin or both, with new antibody added each time the media was changed beginning when cells were first plated on 22 × 22 mm cover slips. Antibody concentrations 0.001 μg/ml, 0.01 μg/ml, 0.10 μg/ml, 1.00 μg/ml, and 2.00 μg/ml were tested for the ability to decrease agrin-induced AChR clustering. To optimize intracellular antibody, media with 6 μM Endo-Porter was used for the first 24 hours in GM. This is much earlier than the experiments performed to verify that Endo-Porter could increase intracellular antibody, and was intended to minimize any potential effect of Endo-Porter on later myotube formation or AChR clustering. A consequence could be that this early treatment led to less Endo-Porter available each subsequent day when antibody was added to cell culture. Cultures were exposed to 10 ng/ml agrin (R&D Systems) for the last 16 hours of 72 hours in DM to induce AChR clustering.
2.5. Acetylcholine Receptor Clustering Assay
AChRs were labeled by the binding of α-bungarotoxin conjugated to tetramethyl rhodamine (Molecular Probes) [43]. Cultures were incubated in the toxin-containing medium for 30 minutes at 37˚C to label AChRs after 72 hours in DM. Cover slips were rinsed three times with PBS, fixed for 10 minutes with 2% paraformaldehyde in PBS, rinsed three times with PBS, dehydrated in cold methanol for 5 minutes at −20˚C, and mounted on microscope slides in Vectashield Mounting Medium for Fluorescence. For some experiments the mounting medium contained 4’6-diamidino-2-phenylindole (DAPI) to visualize nuclei. Nuclei were counted from images captured as JPG files for each day in GM and DM. Fluorescent staining was visualized with an IX70 Olympus inverted microscope under the 20× objective (yielding a total magnification of 200×), and fluorescent images were captured as high-resolution JPG files with an Olympus camera with Magnafire digital imaging software. Bright clusters of AChRs were observed on all aspects of myotubes in fluorescent images. The frequency of AChR clustering was determined by using an algorithm developed for Cell Profiler [44]. AChR clusters were counted from images captured as JPG files from cover slips. These data were utilized to assay agrininduced AChR clustering after exposure to antibody for MyoD or myogenin or both. Comparisons of control cultures with cultures exposed to antibody were analyzed by Student’s t-test to determine statistically different results at p < 0.01.
2.6. Cell Profiler Algorithm
Each grayscale image was analyzed using Cell Profiler’s object identification algorithm. The threshold used in the algorithm was defined as the minimum fluorescent intensity that a pixel must display to be counted as part of a cluster. Experimentation with the threshold revealed that a minimum brightness of 30% best defined a pixel with enough fluorescence to be counted as part of a cluster, and this threshold was used for all analyses. To ensure objectivity and consistent quantification, the threshold and all other settings were kept constant across all groups and images. The diameter range for identifying an AChR cluster was set at 4 - 150 pixels (2.93 μm - 109.95 μm). Contiguous pixels meeting both the intensity and size requirements were counted as parts of AChR clusters. The total clustered pixels per image were converted to AChR clusters as percentage of field, to reflect what percentage of the pixels in an image were counted as containing clustered AChRs. Analysis of data trends via unpaired t-tests were completed using GraphPad Prism.
2.7. Myotube Formation Index
Cell cultures were visualized with an IX70 Olympus inverted microscope under the 20× objective (yielding a total magnification of 200×), and representative phase contrast and DAPI images were captured as high-resolution JPG files with an Olympus camera with Magnafire digital imaging software. These JPG files were utilized to quantify myotube formation by modifying a myoblast fusion index paradigm [45-48]. In brief, the number of nuclei in myoblasts (defined as cells with one or two nuclei) and myotubes (defined as cells with three or more nuclei) were counted after 72 hours in DM. Only nuclei obviously in myotubes were counted as such. All nuclei for which a designation was difficult were grouped with the nuclei in myoblasts. This method biased the data toward fewer nuclei in myotubes for both control and experimental groups. A total of five pairs of images (phase contrast and DAPI) were analyzed for control cultures, cultures exposed to 1.00 μg/ml antibody for MyoD, cultures exposed to 1.00 μg/ml antibody for myogenin, and cultures exposed to 1.00 μg/ml of both antibodies. For each image, nuclei were determined to be either in a myotube or not prior to being counted. The myotube formation index was then calculated as nuclei in myotubes divided by total nuclei in the image and reported in Table 1.
3. Results
The results reported here demonstrate that antibody to either MyoD or myogenin during the specific time period when myoblasts fuse to form myotubes decreases the frequency of agrin-induced acetylcholine receptor (AChR) clustering without affecting myotube formation.
3.1. MyoD Expression Peaks during Myoblast Proliferation while Myogenin Expression Peaks during Myotube Formation
MyoD and myogenin expression were determined bycounting fluorescent and non-fluorescent nuclei and calculating what percentage of nuclei were fluorescent each day in GM and DM. MyoD expression was highest in GM and myogenin expression was highest in DM (Figure 1). Nuclei were counted from 50 images captured as JPG files for each day in GM and DM. Representative images were chosen that had MyoD or myogenin expression consistent with the percentages calculated each day in GM and DM, and then assembled into Figure 2. Percentages of fluorescent nuclei were as follows: 38% MyoD and 8% myogenin at 48 hours in GM, 48% MyoD and 36% myogenin at 24 hours in DM, and 5% MyoD and 47% myogenin at 72 hours in DM (data not shown).
3.2. Intracellular Antibody to MyoD or Myogenin Increases When Applied with Endo-Porter
To verify the ability of Endo-Porter to increase intracellular antibody, cell cultures were treated with antibody to MyoD and Endo-Porter at 24 hours in GM and fixed at 48 hours in GM. Other cell cultures were treated with antibody to myogenin and Endo-Porter at 48 hours in DM and fixed at 72 hours in DM. In both cases a TRITC fluorescent secondary antibody was used to localize the primary antibody. These cell cultures were compared to others treated with antibody but without Endo-Porter for the same time period. Antibody and Endo-Porter were added 24 hours prior to fixation to maximize the possibility of visualizing increased intracellular antibody. Fluorescent images were captured as high-resolution JPG files with an Olympus camera with Magnafire digital imaging software. Intracellular antibody to MyoD or myogenin was greatly increased when applied with Endo-Porter when compared with antibody application alone (Figure 3). Virtually all intracellular antibodies were observed in cytoplasm, with little or no antibody in nuclei. In fact, nuclei were so devoid of antibody that the location of nuclei was readily apparent as dark ovals amidst the cytoplasmic staining.
3.3. Antibody to Either MyoD or Myogenin Decreases Agrin-Induced AChR Clustering
AChRs cluster spontaneously with a baseline frequency on C2C12 myotubes and this clustering is increased with

Table 1. Myotube formation index. Each pairing of control or antibody treatment was a separate experiment. Percentage of nuclei in myotubes was calculated from counts of nuclei in myotubes and myoblasts. Treatment with anti-MyoD, anti-myogenin, or both did not alter the percentage of nuclei in myotubes, but antibody to myogenin may decrease myoblast viability.

Figure 1. During skeletal muscle development, proliferating myoblasts express a high level of MyoD and a low level of myogenin. As myoblasts fuse into myotubes they express a high level of myogenin and a low level of MyoD.
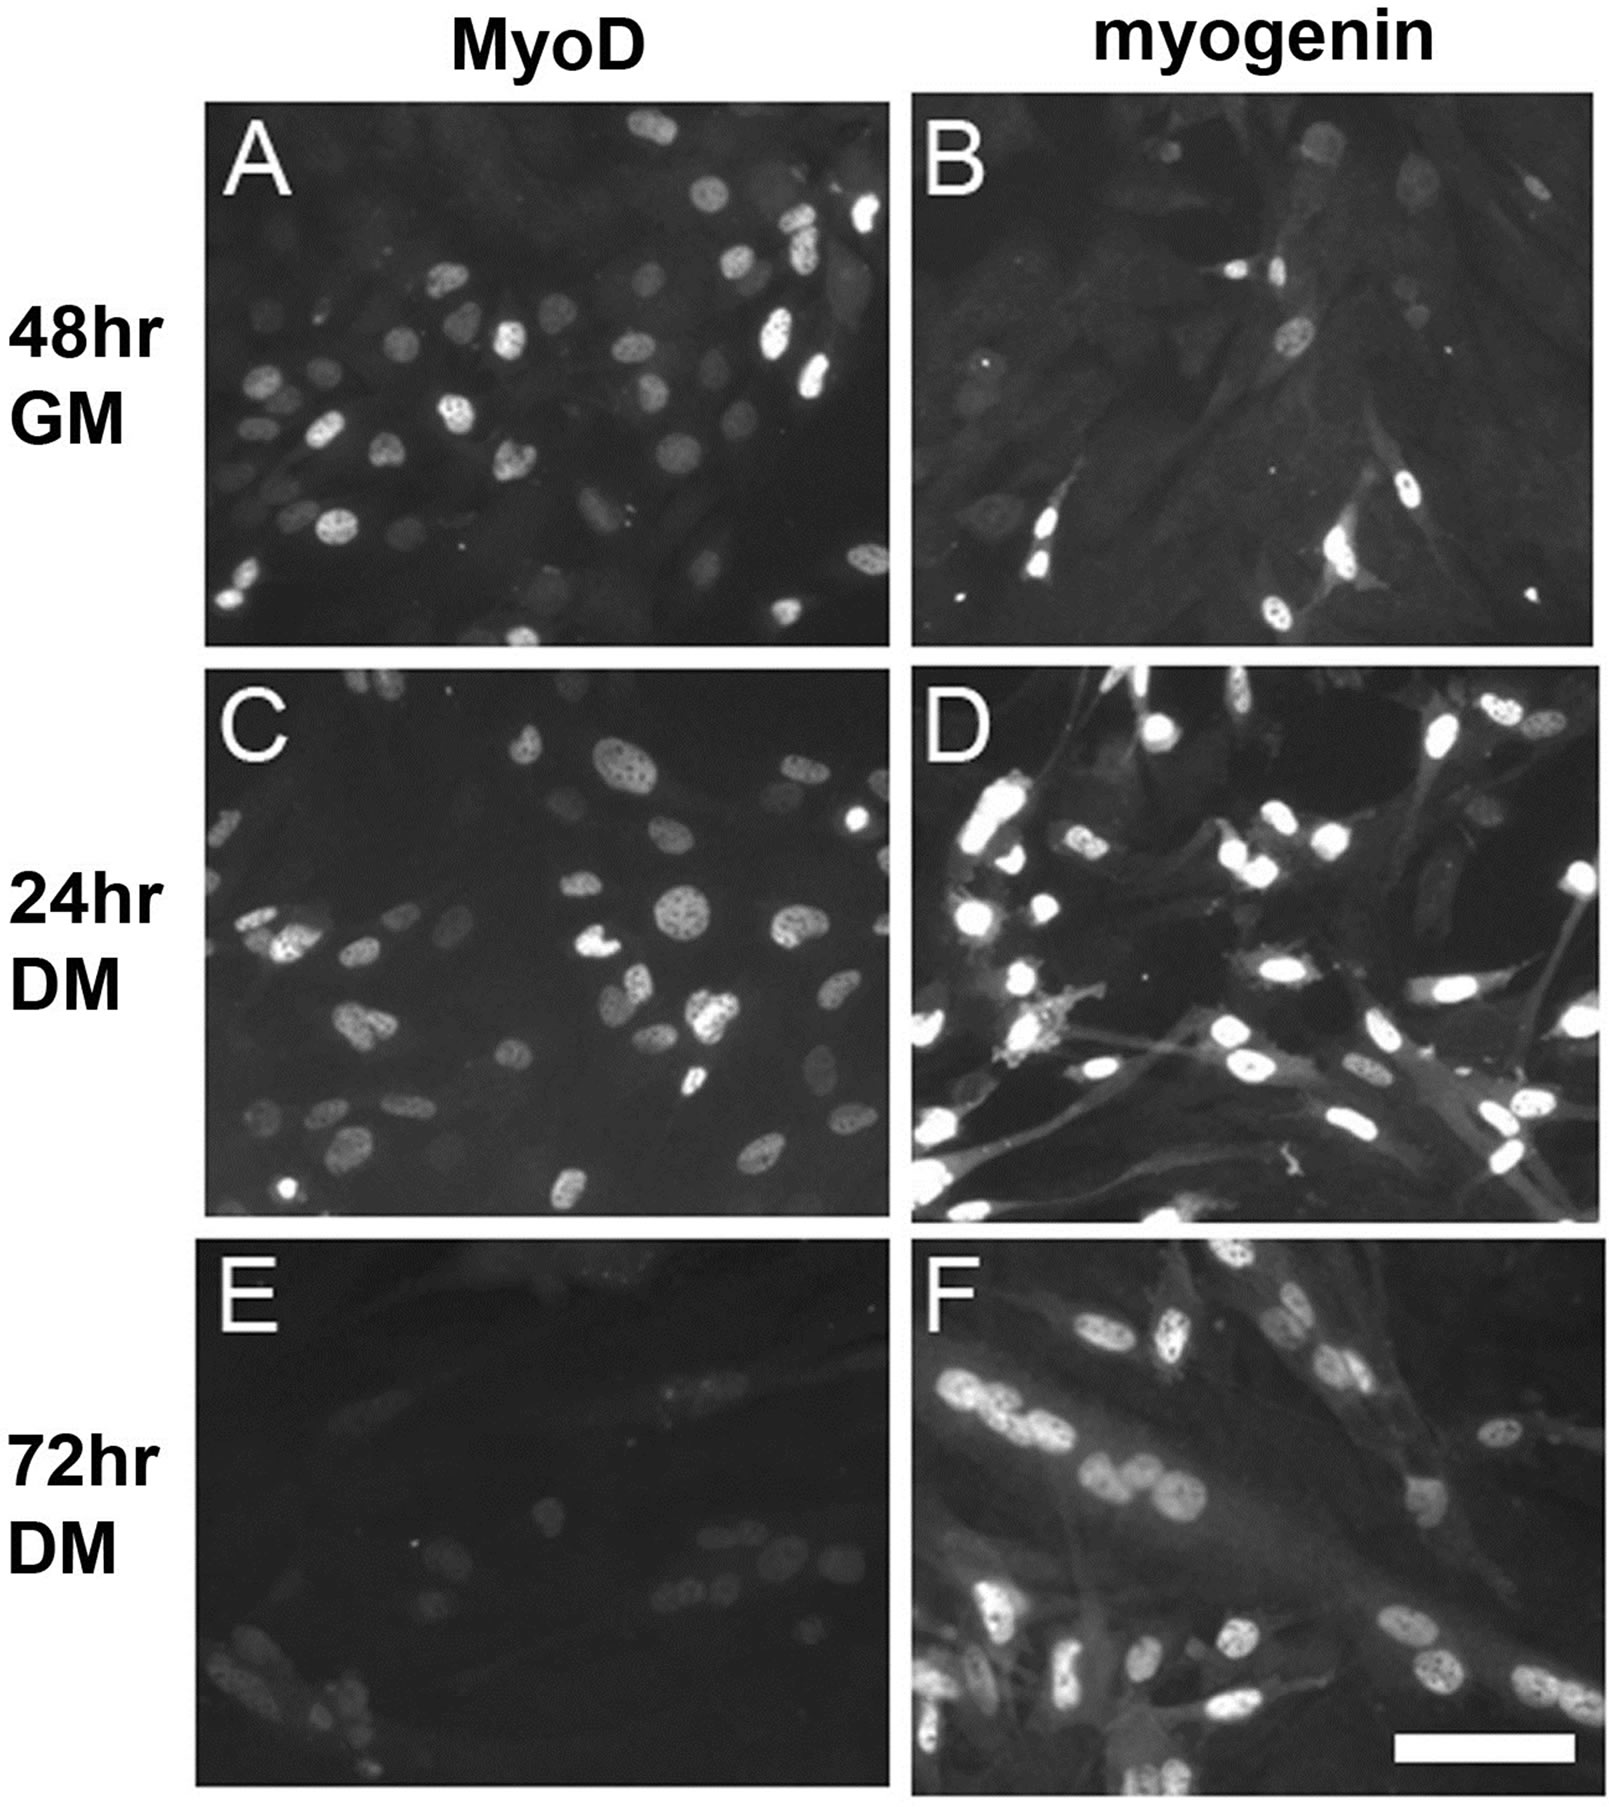
Figure 2. Fluorescent images were captured showing MyoD ((A), (C), (E)) or myogenin ((B), (D), (F)) expression in C2C12 skeletal muscle cell culture at the following time points: 48 hours in GM ((A), (B)), 24 hours in DM ((C), (D)), and 72 hours in DM ((E), (F)). MyoD is observed in more nuclei at 48 hours in GM. Myogenin is observed in more nuclei at 72 hours in DM. GM = growth medium, DM = differentiation medium. Scale bar = 100 μm.
agrin treatment [33,34]. C2C12 cell cultures were switched from GM to DM at 80% confluence, 10 ng/ml agrin was added for the last 16 hours in DM, and myotubes were examined for AChR clustering after 72 hours in DM. AChRs in clusters were quantified by analyzing fluorescent images captured at 72 hours in DM with Cell Profiler software, using a method previously optimized and reported [44]. Cell Profiler counted the total clustered pixels per image. We converted that data to AChR clusters as percentage of field. We had previously used human counts of the number of AChR clusters per image which did not account for the size of the clusters. Images were captured from agrin-induced cultures that were untreated by antibody or treated daily with antibodies to MyoD, myogenin, or both. All control and experimental

Figure 3. Fluorescent images were captured showing AntiMyoD ((A), (B)) or Anti-myogenin ((C), (D)) localization in C2C12 myoblasts or myotubes when treated with 1.00 μg/ml antibody alone ((A), (C)) or 1.00 μg/ml antibody with 6 μM Endo-Porter (B,D). Anti-MyoD was added at 24 hours in GM and myoblasts were fixed at 48 hours in GM. Antimyogenin was added at 48 hours in DM and myotubes were fixed at 72 hours in DM. In both cases a TRITC secondary antibody was used to localize the primary antibody, with fluorescence indicating presence of MyoD or myogenin. Anti-MyoD and Anti-myogenin enter cells in much greater concentration when applied with Endo-Porter, and are observed primarily in cytoplasm. Ab = antibody. Scale bar = 100 μm.
cultures were treated with Endo-Porter when the cells were first plated in GM. This is much earlier than the experiments performed to verify that Endo-Porter could increase intracellular antibody, and was intended to minimize any potential effect of Endo-Porter on later myotube formation or AChR clustering. A consequence could be that this early treatment led to less Endo-Porter available each subsequent day when antibody was added to cell culture. For antibody to MyoD, concentrations as low as 0.01 g/ml decreased agrin-induced AChR clustering relative to untreated cultures, using Student’s t-test at p < 0.01 (Figures 4(A) and 5). For antibody to myogenin or the combination of antibodies to MyoD and myogenin, a concentration of 1.00 μg/ml was necessary


Figure 4. AChRs in clusters were quantified by analyzing fluorescent images captured at 72 hours in DM with Cell Profiler software. Images were captured from agrin-induced cultures that were untreated by antibody (control cultures) or treated daily with Anti-MyoD (A); Anti-myogenin (B); or both Anti-MyoD and Anti-myogenin (C). All cultures were treated with Endo-Porter when the cells were first plated in GM. The histograms reveal that daily treatment of 1.00 μg/ml of either antibody is sufficient to decrease agrin-induced AChR clustering relative to control cultures, using Student’s t-test at p < 0.01. (*) statistically decreased from 0.00 μg/ml. (**) statistically decreased from 0.01 μg/ml. (***) statistically decreased from 0.10 μg/ml.

Figure 5. Examples of fluorescent images captured from agrin-induced cultures that were untreated by antibody (control cultures) (A), or treated daily with 1.00 μg/ml Anti-MyoD (B), 1.00 μg/ml Anti-myogenin (C), or 1.00 μg/ml Anti-MyoD and Anti-myogenin (D). Images were captured at 72 hours in DM. The fluorescent areas are clusters of AChRs. Scale bar = 100 μm.
to decrease agrin-induced AChR clustering relative to untreated cultures, using Student’s t-test at p < 0.01 (Figures 4(B) and (C), Figure 5). Further experiments comparing 1.00 μg/ml with 2.00 μg/ml revealed that the higher concentration further decreased agrin-induced AChR clustering with antibody to MyoD but not with antibody to myogenin (Figure 6). Each graph in a figure presents the data from a single experiment, and only data within a single experiment is compared. Human counts of the number of AChR clusters per image were also conducted for the images used for data collection for Figures 4 and 6. Similar differences in the effect of antibodies were calculated, with 1.00 μg/ml of either antibody sufficient to decrease agrin-induced AChR clustering relative to untreated cultures (data not shown). Experiments were also performed using antibodies to MyoD and/or myogenin without using Endo-Porter. In those experiments results were inconsistent (data not shown).
3.4. Antibody to Either MyoD or Myogenin Has No Effect on Myotube Formation
Myotube formation was quantified by modifying a myoblast fusion index paradigm [45-48]. In brief, the number of nuclei in myoblasts (defined as cells with one or two nuclei) and myotubes (defined as cells with three or more nuclei) were counted after 72 hours in DM. Only nuclei obviously in myotubes were counted as such. All nuclei for which a designation was difficult were grouped with the nuclei in myoblasts. This method biased the data toward fewer nuclei in myotubes for both control and experimental groups. Control cultures were


Figure 6. AChRs in clusters were quantified by analyzing fluorescent images captured at 72 hours in DM with Cell Profiler software. Images were captured from agrin-induced cultures that were untreated by antibody (control cultures) or treated daily with Anti-MyoD (A) or Anti-myogenin (B). All cultures were treated with Endo-Porter when the cells were first plated in GM. The histograms reveal that daily treatment with 2.00 μg/ml Anti-MyoD decreased agrin-induced AChR clustering greater than 1.00 μg/ml Anti-MyoD, while 2.00 μg/ml Anti-myogenin decreased agrin-induced AChR clustering similar to 1.00 μg/ml Anti-myogenin, using Student’s t-test at p < 0.01. (*) statistically decreased from 0.00 μg/ml. (**) statistically decreased from 1.00 μg/ml.
compared with cultures exposed to 1.00 μg/ml antibody for MyoD, or 1.00 μg/ml antibody for myogenin, or both, in separate experiments. Each pairing of control or antibody treatment was a separate experiment, combining data from multiple culture plates. With antibody to MyoD the number of cells and the percentage of nuclei in myotubes were similar to control. With antibody to myogenin or both MyoD and myogenin, the percentage of nuclei in myotubes was similar to control, suggesting that myotube formation was unaffected. However, the number of cells (and thus nuclei) was decreased by antibody to myogenin or both MyoD and myogenin, suggesting that myoblast viability may be decreased (Table 1). If so, this could contribute to the decrease in agrininduced AChR clustering resulting from antibody to myogenin.
4. Discussion
The results reported here demonstrate that treatment with antibody to MyoD or myogenin during the specific time period when myoblasts fuse to form myotubes decreases the frequency of agrin-induced acetylcholine receptor (AChR) clustering without affecting myotube formation. We conclude that agrin-induced AChR clustering requires both MyoD and myogenin.
Previously it was reported that RNA interference of myogenin expression in an immortalized rat muscle cell line decreased the number of spontaneous AChR clusters per nuclei by approximately three-fold, and decreased the percentage of muscle fibers with agrin-induced AChR clusters by approximately four-fold [42]. However, the percentage of muscle fibers with AChR clusters was identical with or without agrin treatment. Moreover, the data regarding agrin-induced AChR clustering did not include AChR clusters per nuclei or other more standard measures. We used the C2C12 cell culture model to test the hypothesis that both MyoD and myogenin are required for agrin-induced AChR clustering. We analyzed the images captured from control and treatment groups with two different methods. First, we used a standard method that counted the number of AChR clusters per image. Second, we used the software program Cell Profiler to determine the total clustered pixels per image, and then converted that data to AChR clusters as a percentage of field. This second method allowed us to calculate how many AChRs were clustered, rather than just counting how many clusters of AChRs were present. Regardless, with both methods we saw a consistent decrease in agrin-induced AChR clustering by antibody to MyoD or myogenin, with 1.00 μg/ml of either antibody being sufficient. By using antibodies rather than RNA interference we could directly test the effect of decreased protein function without the potential confounders that may arise with disruption of normal RNA function.
Skeletal muscle development is guided by myogenic regulatory factors including MyoD and myogenin. These transcription factors are produced in the cytoplasm but bind to DNA in the nuclei of cells to activate or inhibit transcription of specific genes. In the experiments reported here, some cell cultures were treated with antibody to MyoD or myogenin after cell fixation, and then treated with a fluorescent secondary antibody. In those cultures, MyoD and myogenin staining was concentrated in the nuclei of myoblasts or myotubes. Other cell cultures were treated with antibody to MyoD or myogenin while still in differentiation medium, fixed, and then treated with a fluorescent secondary antibody. In those cultures, MyoD and myogenin staining was limited to the cytoplasm of myoblasts or myotubes and was not observed in nuclei. This may reflect the difficulty of antibody or antibody-bound MyoD or myogenin to reach the nuclei in cell culture, possibly due to size or charge. Thus, any antibody-bound MyoD or myogenin visualized with fluorescent staining was limited to the cytoplasm. For the experiments investigating agrin-induced AChR clustering or myotube formation, with antibody to MyoD or myogenin added to cell cultures over multiple days, the antibodies most likely bound to targets in the cytoplasm and prevented them from reaching cell nuclei and affecting gene transcription.
MyoD activates genes involved in synaptic function, including the muscle specific kinase (MuSK) and rapsyn. Interestingly, myogenin also activates the rapsyn gene but not the MuSK gene [18]. Furthermore, myogenin activates genes for AChR subunits [31,32]. This may reflect a role for MyoD earlier in differentiation involving MuSK and rapsyn, and a role for myogenin later in differentiation involving rapsyn and AChR but not MuSK. In the data reported here, 1.00 μg/ml of antibody to myogenin was required to decrease agrin-induced AChR clustering, with no further decrease at 2.00 μg/ml. In contrast, there was a dose response to antibody to MyoD that began at 0.01 μg/ml and continued through 2.00 μg/ml, with increasing concentrations of antibody further decreasing agrin-induced AChR clustering. This may reflect a MyoD-specific role in MuSK expression, where decreased MyoD decreases MuSK expression which then decreases agrin-induced AChR clustering. Low-density lipoprotein receptor-related protein 4 (Lrp4) serves as an agrin receptor that forms a complex with MuSK and mediates MuSK activation by agrin [37,38]. Specifically agrin binds to the N-terminal region of Lrp4 and stimulates the association between Lrp4 and the first immunoglobulin-like domain in MuSK [49]. In response to agrin binding Lrp4, MuSK is tyrosine phosphorylated [28], beginning a signaling cascade that includes the tyrosine phosphorylation of the AChR β subunit [39,40]. Suppression of Lrp4 expression attenuates agrin binding activity, agrin-induced MuSK tyrosine phosphorylation, and agrin-induced AChR clustering [38]. The agrin/ MuSK interaction to increase AChR clustering may be decreased when antibody to MyoD decreases MuSK gene activation. Alternatively, using antibody to decrease the amount of MyoD may decrease agrin-induced AChR clustering by decreasing myogenin expression, with myogenin more directly driving AChR clustering and presumably synapse formation. The myogenin gene is activated by MyoD during myogenesis [18].
Myogenin appears to be required for late but not early events in myogenesis. First, myogenin is not required for myotome formation or the appearance of myoblasts [17]. Second, MyoD initiates expression of early genes but requires combined activity with myogenin to initiate expression of late genes. In contrast, myogenin inefficiently activates genes in the absence of MyoD but acts synergistically with MyoD on a set of genes normally expressed late in the program of myogenic differentiation [50]. Third, overexpression of myogenin in transgenic mice elevates mRNA and protein levels of all five AChR subunits, while reducing MyoD protein levels [51]. Fourth, mice with a mutation in the myogenin gene have severe muscle defects resulting in perinatal death [17]. Finally, myogenin null mice die at birth due to a lack of secondary muscle fiber development [9]. The amount of myogenin antibody used in our experiments was insufficient to affect myotube formation, but was sufficient to decrease agrin-induced AChR clustering and may decrease myoblast viability. This may reflect a difference in myogenin sensitivity between AChR clustering and myotube formation. More importantly, since myogenin activates genes for AChR subunits [31,32], antibody to myogenin decreases the number of AChRs available for clustering in response to agrin.
5. Acknowledgements
This work was supported in part by the Office of Research and Sponsored Programs at Midwestern University, which provided intramural funding, as well as providing a Summer Fellowship for Matthew K. Ball. In addition, David H. Campbell and Paul R. Standley were supported by funding provided by the A.T. Still University Strategic Research Initiative.
NOTES