Quantification by Signal to Noise Ratio of Active Infrared Thermography Data Processing Techniques ()
1. Introduction
Non-destructive testing (NDT) of materials using infrared thermography enable to quickly and reliably analyze them, regardless of size or shape, without permanently altering their physical, chemical or mechanical properties. Non-destructive testing using active infrared thermography provides information on material, structure, physical and mechanical properties and discontinuities and defects present on the analyzed specimen [1]. This information is obtained from analyzing the resulting thermograms; this analysis has three phases: pre-processing, processing and analysis of results [2,3]. The selection of the processing techniques that will be used depends on the objectives and needs of the study. This paper is focused on the automation of the comparative study of the techniques processing thermographic sequences obtained in non-destructive testing using active infrared thermography. This automation process is based on the quantification of goodness through the signal to noise ratio (SNR) of some of the main processing techniques (DAC, PPT, PCT, TSR, PhAC, Skewness and Kurtosis) employed in thermal sequence analysis [4-6].
2. Processing Techniques
There is a large number of image processing techniques in NDT using active infrared thermography; their application depends on the characteristics and objectives of the study. Most of the algorithms of the different processing techniques have been created for pulsed active thermography testing since it is the most employed technique. However, adapting and modifying the algorithms, they can be applied to the other existing techniques. These techniques can be mainly classified in three groups: techniques using thermal contrast [6], techniques based on transforms [3] and techniques using statistical methods [7,8]. Some of the main techniques of these groups will be explained below.
2.1. Thermal Contrast
Differential Absolute Contrast (DAC)
Processing technique using differential absolute contrast (DAC) was developed as a solution for the limitation of the absolute thermal contrast technique, which is defined by the difference between the temperatures of a defective area Td and a soundarea Tsa [9], where the obtained results depend on the need to prior locate a soundarea. Processing technique using differential absolute contrast is based on the one-dimensional solution of Fourier’s diffusion equation for a pulsed thermal wave (Dirac delta function). The application of this processing technique enables to model the time evolution profiles of the specimen surface temperature, obtaining the values of the thermal energy transferred in each point of the surface and reducing the effects of the non-uniform heating on the surface. The limitation in the selection process of t’ is removed with the automation method designed for this technique (IDAC) [3].
2.2. Transforms
2.2.1. Pulsed Phase Thermography (PPT)
Pulsed phase thermography is a processing technique for image sequences captured by active infrared thermography that enables to change from time domain to frequency domain [10] the signal of the thermal response of the sequence, that is one-dimensionally defined, on the base of discrete Fourier transform (DFT), Analyzing the time evolution of the image sequence using PPT, one-dimensional Fourier transform is applied to each pixel of the image sequence, obtaining two new image sequences: amplitude and phase. Image sequences of amplitude and phase are symmetrical about the frequency f = 0 Hz, making redundant the half of the resulting data, which enables to reduce the calculation time necessary for processing. Among the sequences resulting from applying PPT, the phase sequence or phasegram should be highlighted since this component is the less affected one by the effects of signal degradation [11] and enables to estimate the depth of the defects existing in the specimen. The calculation of the defect depth is given by the blind frequency, where, on the base of the phase contrast definition, the defect phase and the soundarea curves cross.
2.2.2. Principal Component Thermography
Processing technique for thermal image sequences using principal component thermography (PCT) is based on reducing the information from the singular value decomposition to compactly extract spatial and temporal information of the image sequence using orthogonal empirical functions or EOF [12]. Before applying decomposition, the 3D-matrix of the image sequence is transformed in a 2D matrix. Each sequence image is transformed from 3D to 2D. The columns contain the temporal dimension and the rows contain the spatial dimension, so the complete sequence will be a 3D-matrix (Nx × Ny × Nt with Nt = total number of images). In the matrix A decomposition, U columns represent the empirical orthogonal functions (EOF) describing the spatial variations, and VT columns represent the main components of the temporal variations.
2.3. Statistical Techniques
2.3.1. Signal Reconstruction
Processing techniques based on statistical methods include signal reconstruction from polynomials or TSR, used especially in noise filtering and data reduction [2]. This technique has its origin in the Fourier’s one-dimen-
sional heat-transfer equation on a semi-infinite surface that has been previously subject to thermal excitation (Dirac delta) [3]. This equation models the evolution of the surface temperature of a non-defective pixel in its logarithmic scale in line with slope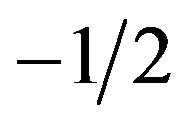 . The thermal evolution of a pixel can be modeled using a polynomial of degree N, as follows:
 (1)
(1)
So, image sequence information is reduced to the number of the coefficient of regression of the polynomial used in the reconstruction.
2.3.2. Skewness
The processing technique using skewness enables to summarize the whole sequence in one image (skewgram), containing the third central moment values or skewness of the thermal evolution of each pixel [7]. So the goodness of the data adjustment is determined in reference to a specific type of distribution, highlighting the presence of possible defects and inhomogeneities of the specimen.
2.3.3. Kurtosis
As the previous technique, the Kurtosis-based processing technique enables to gather in one image (kurtogram) the image sequence information containing the values of the forth statistical moment (kurtosis) of the thermal evolution of all the pixels of each image of the original sequence [8].
The fourth statistical moment is defined as the measurement that reflects the degree in which distribution reaches a peak, providing information on the height of the distribution related to the value of its standard deviation. According to the derivative of a standard distribution, kurtosis (K) value is classified in: mesokurtic (standard distribution with K = 0), leptokurtic (high degree of peakedness, K > 0) and platykurtic (low degree of peakedness, K < 0) [5]. Applying this processing technique, it is possible to estimate kurtosis values for each pixel, creating a kurtogram with the information of the location of eventual surface defects and their thermal diffusivity.
2.4. Hybrid Technique
Phase Absolute Contrast (PhAC)
The hybrid processing technique using Phase absolute contrast (PhAC) combines three different processing techniques: phase absolute contrast, pulsed phase thermography and thermographic signal reconstruction. Phase absolute contrast calculation comes from the phase sequence obtained from PPT; a filtering by TSR has been previously applied to this sequence to reduce the signal noise (a polynomial of degree 5 was employed in this case). Due to the symmetry with respect to the frequency f = 0 Hz that the phase sequence presents, the half of the data are subtracted, which simplifies the further processing, where the differential absolute contrast is applied to the resulting sequence using as reference the thermogram previous to the appearance of the first defect. Figure 1 shows the differences in the evolution of the thermal response when applying these techniques to a synthetic sequence modeled with the software ThermoCalc® with 6 defects (air) at the same depth (see Figure 2). As seen in Figure 1, the results obtained with PhAC enable to increase the level of contrast between a defective area and a soundarea, which allows a better identification and analysis of the existing defects of the specimen (see Figure 2).
3. Analysis and Results
3.1. Signal to Noise Ratio
Signal to noise ratio analysis applied to each processing technique mentioned above enables to determine which algorithm is more appropriate, depending on the applica-
 (a)
(a)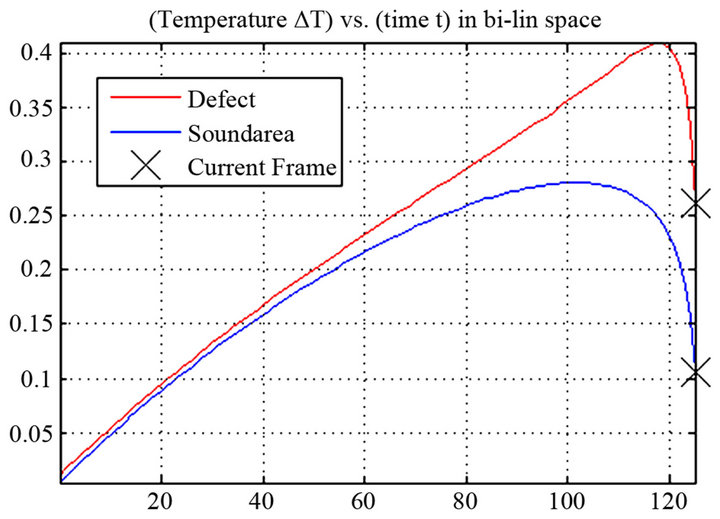 (b)
(b)
Figure 1. Evolution of the thermal response for phase (a) and phase absolute contrast (b) calculation.
 (a)
(a)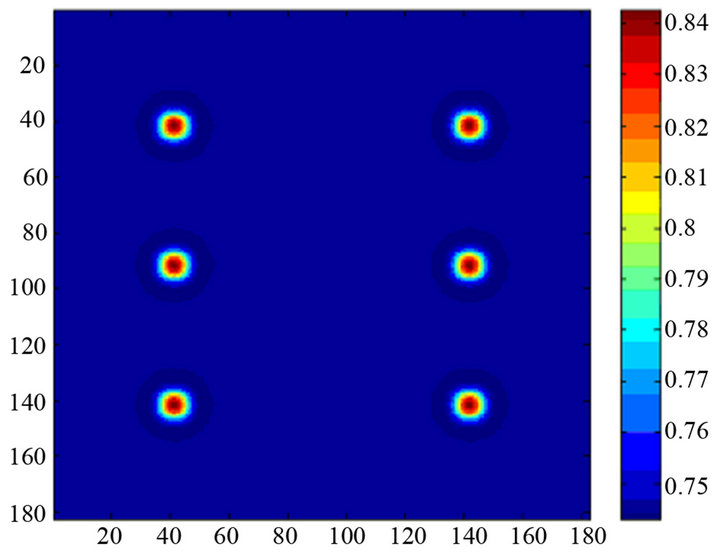 (b)
(b)
Figure 2. Thermograms resulting from phase (a) and PhAC (b) calculation.
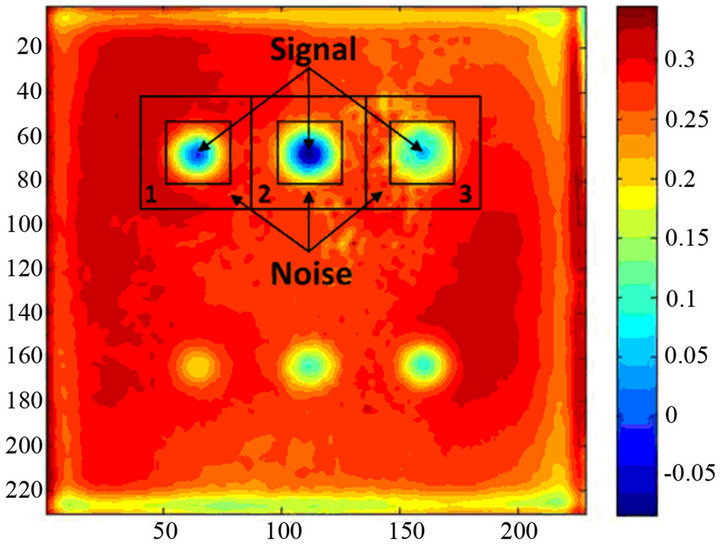
tion. SNR describes the contrast between a defective area and its neighbourhood, establishing a dynamic range measured in decibels (dB). For this purpose, two areas for each defect are selected: an area in the defect that will be considered as “signal” (sarea) and an area around the defect defined as “noise” (narea) (see Figure 3). The calculation of the SNR value comes from:
 (2)
(2)
where σ is the standard deviation of the noise and Sareamean and Nareamean are the average values of each area, respectively [13].
The automatic quantification method, which is based on signal to noise ratio analysis applied to the processing techniques of the images mentioned of the previous sections, is independent of how the defect appears in the material. The defect can appear colder or hotter than its neighbourhood, but it does not affect to the result due to the absolute value calculation.
3.2. Results
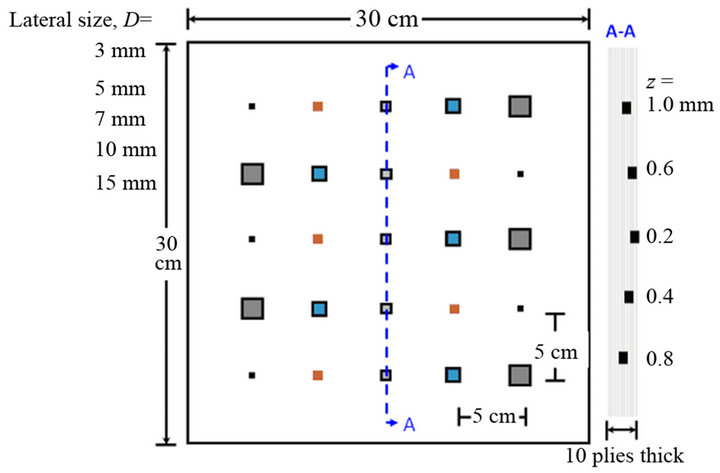
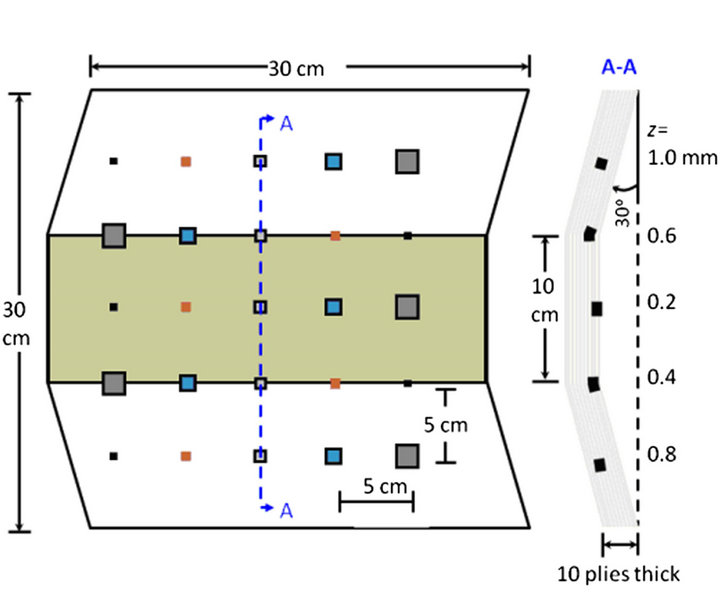
The quantification analysis using signal to noise ratio was applied to the results obtained when using the selected image processing techniques (DAC, PPT, PCT, TSR, PhAC, Skewness and Kurtosis) in four specimens (see Figures 4 and 5). The three CFRP (carbon fiber) and the PLEXI014 (plexiglas) specimens were tested in reflection through pulsed thermography using two high power flashes (6.4 kJ) during 5 ms. The process of heat transfer on material was captured by an IR camera (3 - 5 µm) at frequency of 157 Hz. Figure 4 shows the geometry of flat specimens and Figure 5 shows the geometry of curve (a) and trapezoidal (b) specimens and the distribution of the defects in each of them.
For the image sequences with more than a thermogram, the thermogram with the higher number of identified defects and providing as much information as possible regarding the composition of the plate was selected. The thermograms selected for the specimen CFRP006 are: the thermogram obtained at 1s when applying DAC, the ones obtained by Kurtosis and Skewness, the EOF3 through PCT, the thermogram obtained at the frequency of f = 53 Hz when applying the PhAC, at 0.1 Hz to the amplitude sequence and at 0.3 Hz to the phase sequence, and the thermogram formed by the coefficients of the fifth order derivative obtained from TSR with a polynomial of degree 5. The thermograms selected for the specimen CFRP007: DAC (thermogram at 1.4 s), PCT (EOF3), PhAC (at f = 63 Hz), PPT in amplitude (at f = 0.1 Hz) and phase (at f = 0.1 Hz) and TSR (fifth order derivative). The thermograms selected for the specimen CFRP008 are: DAC (thermogram at 0.7 s), PCT (EOF3), PhAC (at f = 42 Hz), PPT in amplitude (at f = 0.1 Hz) and phase (at f = 0.1 Hz) and TSR (fifth order derivative). The thermograms selected for the specimen PLEXI014 are:
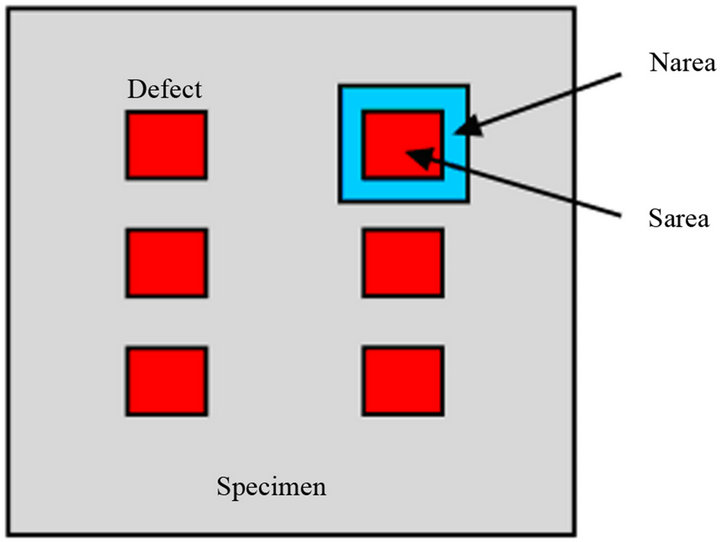
Figure 3. Selection of areas for SNR calculation.
 (a)
(a) (b)
(b)
Figure 4. Squematic representation and defects location for flat specimens CFRP006 (a) and PLEXI014 (b).
DAC (thermogram at 1.3 s), PCT (EOF3), PhAC (at f = 43 Hz), PPT in amplitude (at f = 0.1 Hz) and phase (at f = 0.1 Hz) and TSR (forth order derivative). Figure 6 shows the areas selected for the quantification calculation using signal to noise ratio. In both types of specimens (CFRP and PLEXI014), xy configurations were employed for the defects and XY configurations (Figure 6(c)).were used for the noise; the dimensions of the areas depended on the dimensions of the defects in each case. The defects are listed from left to right. Table 1 shows the SNR values resulting from applying the processing techniques, and the selected defects in each specimen. As can be noted, SNR values enable to quantify the defect identification when applying the processing techniques to each specimen, which also depends on their configuration since the defects with less depth from the material surface and the bigger defects can be more easily identified. So, in the case of CFRP specimens, where the analyzed defects are at the same depth but have different dimensions, the values of SNR parameter depend on the dimension and vary from ND (in the case of unidentified
 (a)
(a)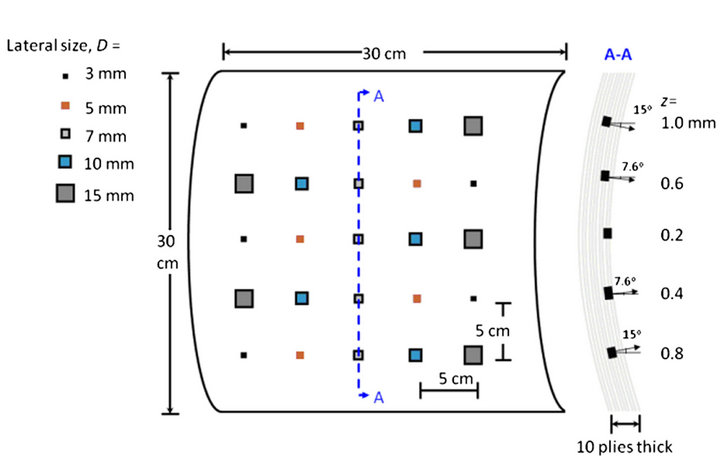 (b)
(b)
Figure 5. Squematic representation and defects location for specimens CFRP007 (a) and CFRP008 (b).
 (a)
(a) (b)
(b)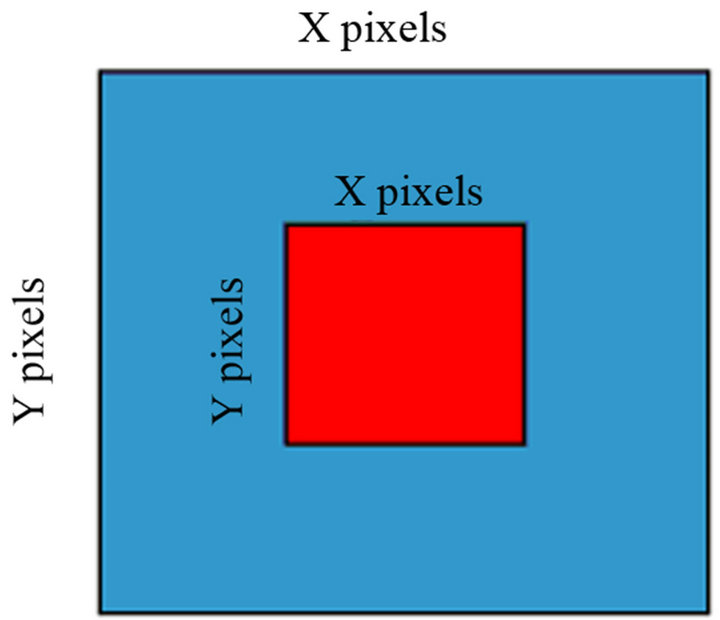 (c)
(c)
Figure 6. Representation of the areas selected for the quantification analysis of the specimens CFRP (a) and PLEXI014 (b) and their configuration (c).
defects) and SNR < 0 (in the case of smaller defects) to SNR > 0 (for bigger and better identified defects). In the case of the specimen PLEXI014, the values of the SNR parameter depend on the defects depth, where the deeper ones have a worse signal to noise ratio (SNR < 0) and in some cases, depending on the applied processing technique, they will not be detected (ND) and the less deep ones will provide better results (SNR > 0).

Table 1. SNR values obtained. Identified defects are shaded (SNR > 0).
4. Conclusion
On the basis of the results obtained using the analysis of quantification of the selected processing techniques applied to several specimens of different configurations, we conclude that the automatic identification of defects or discontinuities depends on the defects and discontinuities characteristics, so these results vary depending the processing methods that are employed. After assessing the number of detected defects (SNR > 0) and their configuration in each case, the processing method that provides better results to automate, is the Principal Components Thermography (PCT) using EOF3.