Discussion Measurement Models and Algorithms of the Wind Vector Field Based on Satellite Images ()
1. Introduction
A variety of detection tools provide various means to obtain information for basic theoretical research. Wind vector generated due to atmospheric motion can also be obtained through a variety of detection tools. To detect wind vector in addition to the use of traditional wind vane, anemometer (such as the windmill anemometer, thermal anemometer, acoustic anemometer and laser anemometer), obtained directly, but also through other means, such as weather balloons, radars and satellites’ sounding data.
The meteorological satellite remote sensing since the 1960s is a major breakthrough for meteorological observation. The satellite imageries information it provides cannot be compared to any previous detection means on time and space continuity. The meteorological satellite imageries have played an extremely important role in the research about mastering the atmospheric circulation, medium and long-term weather forecasts and severe weather science. A method for observing atmospheric circulation is to mark wind vector on the satellite image. The magnitude and direction of the wind vector is decided by moving speed of the cloud. The wind vectors where there are no clouds or clouds unstable are defined as zero wind vectors. Defined by the movement of the clouds, the wind vector is called cloud track wind. The meteorological department already has some methods to computing cloud track wind based on the changes of the satellite cloud. Such method is also called cloud motion wind. Izawa and Fujita [1], Hubert and Whitney [2] took advantage of movie animation technology to intuitive judgment the movement of clouds by the visible screen, resulting in the cloud motion wind vector. This manual identification method is obvious anthropogenic factors greatly, not very accurate, time-consuming and laborintensive. End lich [3] and Wolf [4], using pattern recognition techniques respectively, calculate cloud track wind according to find some characteristic quantities of the clouds. Leese [5] and Smith [6] use infrared brightness temperature cross-correlation coefficient method to cloud track wind.
The main purpose of this paper is as follows: At first, obtain Infra-red satellite wind image by using the geostationary meteorological satellite. Then, according to the adjacent times image data and its characteristics obtained by the infra-red satellite wind image, establish measurement models and algorithms to describe the actual wind vector field as accurately as possible.
Determine a two-dimensional wind vector need four indicators: The latitude and longitude of the starting point and direction of the wind vector (unit: mass angle from clockwise direction of true north) and size (unit: m/s). This article gets the two-dimensional gray-scale matrix data obtained by the geostationary meteorological satellite scanning. Zhang Qingshan [7], Wang Guanghui [8] and Ni Zhan [9] have done a lot of research for the actual positioning of the satellite cloudthe conversion of visual field coordinates and the ground coordinates. Those provide a great help for researching the cloud track wind in this article. According to analyze the feature of the clouds in the image, we can binarization processing to the cloud pictures using threshold method and extract the characteristics of clouds. Then, establish matching model for the clouds image, use Infrared brightness temperature cross-correlation coefficient method to get the maximum correlation coefficient between the target module and the tracking module, and get the start and end of the wind vector. Then we can take advantage of the spherical triangles of the law of cosines to determine the magnitude and direction of the wind vector. Finally, we analyze and discuss the feasibility of the model according to a case.
2. Extraction of the Feature Clouds
Use by the movement of the clouds to strike a wind vector, we must first extract the clouds. Satellite cloud picture is a picture which is made up of the covered clouds and the earth’s surface features obtained by meteorological satellite’s top-down observations. It is drawn with grayscale data which are converted from the temperature data over the earth detected by infrared detector on geosynchronous satellite. Earth is the sole source of the detected temperature. If the sky is cloudless, the detected temperature can be regarded as the temperature of the surface of the earth; where there are clouds, the detected temperature is relatively low. And the cloud is higher the temperature is lower; the detected temperature can be seen as the temperature of the clouds area. According to the conversion between the gradation value and the temperature we can know that the gray value is greater the temperature is lower. Therefore, we can know where the grey value is larger is the clouds covered.
Extract morphological characteristics of satellite clouds image, we need to separate clouds from satellite image. There are many methods to extract the clouds [10,11], the most commonly is threshold method a gray value is selected as the threshold value to binarization-processing the original image.
For easy and fast calculation, we can de fine the mean value of the gray value as the threshold, defined as follows:
 (1)
(1)
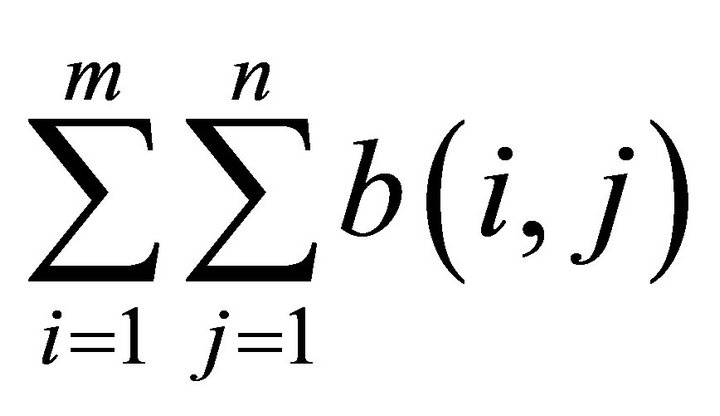
where in the sum of the gray values is . The total number of the gray value is mn.
In this article, we extract cloud mass in accordance with 16 × 16 pixels for a region. When the mean of the gray values of the selected area is greater than the threshold, we think there are clouds and we can calculate the wind vectors continue. However, when the mean of the gray values of the selected area is less than the selected threshold, we can treat this area as cloudless regions. Consider this place as zero wind vectors area.
When all the clouds are extracted, the next step is to match clouds.
3. The Cloud Image’ Module Matching
3.1. Correlation Coefficient
In the tracer cloud object module’s tracing algorithm of the ventilation system, which module identification factor is of ten used is the correlation coefficient between the target module and the tracking module, and satisfactory results has been achieved. According to the research of Wang Zhenhui et al. [12], this paper utilizes the correlation coefficient OC of the original dot pitch to achieve the module matching, which is defined as follows:
 (2)
(2)
In the expression,  and
and  respectively mean pixel intensity matrix which come from two different modules to be compared. And
  is the correlation coefficient of the original dot pitch between
 whose reference position is
  and
and  whose reference position is
 . Use
. Use  as recognition factor in the producing process of the wind vectors. In addition, we can use it as a control condition in the quality control of the wind vector to make the wind vector in a higher reliability on the continuity and uniqueness when we conduct the multiple-factor general editing for the generated cloud motion wind.
3.2. Matching Algorithm
In this case, we set the Matching window of the Pixel block size to 16 × 16 pixels and the search range is limited to 64 × 64 pixels. The steps are as follows:
1) Take two consecutive geostationary satellite cloud images, interval between 0.5 h to 1 h.
2) We determine a sampling point A in wind vector field of the first cloud map. The point A is the starting position for the wind vector. Then we can get a sample module T it is a 16 × 16 pixels module with A as the center (Figure 1).
3) Find the probed area S it is a 64 × 64 pixels module with A as the center in the second cloud image.
4) In the second cloud image, scan the target template T over the probed area S, pixel by pixel. Calculate the correlation coefficient OC once T moves one pixel. So we need to calculate a total of 64 × 64 correlation coefficients. It indicates that the similarity of those two areas is the largest when the value of OC is the maximum of all. Therefore, we choose the position as the ending of the vector where OC is the maximum in the second image. By now, the position of a wind vector is determined (Figure 2).
5) Match as described above for the next sampling point until the end of the matching.
We can use the MATLAB software for the specific operation.
4. Wind Vectors’ Calculation
Determining a two-dimensional vector requires four indicators: The latitude, longitude of the starting point, direction (unit: measured angle from true north clockwise) of the wind vector and size. After the above module match, we have come to the beginning and end of the wind vector. Next, we have to calculate the size and direction of the wind vector. Set the initial position of the tracer cloud as A and the end position as B. Point A and B is marked on the sphere (Figure 3). Because points A, B,
and vertex C compose a spherical triangle, so we can seek the magnitude and direction of the wind vector in accordance with the law of cosines of the spherical traingles.
Spherical triangles of the law of cosines [13]: Any side of the spherical triangle cosine equal to the other on both sides of the cosine of the product of plus this on both sides of the sine and cosine of the angle even multiplied.
Calculated as follows:
First of all, the row and column coordinates of A, B can be converted into Latitude and longitude coordinates through the conversion of visual field coordinates and the ground coordinates. It was made a detailed description in reference [9] (see Figure 4).
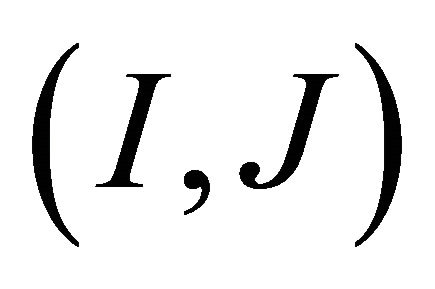
As shown above: Infrared detector is located at S. And P is an arbitrary sampling point on the Earth. Q(I, J) is sub-satellite point coordinates. OQ = a and ON = b are the semi-major and semi-minor axes of the ellipsoid. We can obtain the conversion Formula (3).

(a) S0(b) S1
Figure 2. Matching process.

Figure 3.The displacement of the schematic of A and B.
 (3)
(3)
where
 ,
,  ,
, .
.
So we can get that the longitude and latitude of the point A are  and
and , and the longitude and latitude of the point B are
  and
and .
.
We can see the earth as a uniform sphere. Earth’s radius is R. So in the Spherical triangle ACB, according to the law of cosines we have:
 (4)
(4)
And considering

Then we can get
 (5)
(5)
This is equivalent to
 (6)
(6)
In addition,  , wind speed for the wind vector can be obtained as
 (7)
(7)
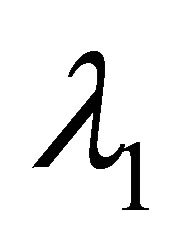
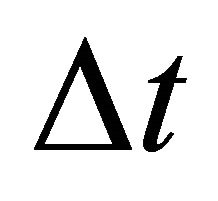
Among them,  is the time difference through the point A to the point
 .
.
And wind direction is
 (8)
(8)
5. A Numerical Example
Two gray-scale matrix obtained by the existing Chinese FY-2 satellite which is located at 0˚N latitude and 86.5˚E longitude, IR1_2100.mat and IR1_2130.mat, respectively indicated One day at 21:00 and 21:30 2288 × 2288 gray value matrix. Given the distance between synchronous satellite and the center of earth is 42,164,000 m. Earth can be regarded as an ideal sphere. The radius of the earth is 6378136.5 m. The detection scans by the stepping angle of 140 micro-arcs.
Calculation range is: 40 degrees south latitude to 40 degrees north latitude, 46 degrees to 126 degrees east longitude.
At first, the satellite cloud image is drawn with the data of gray value matrix IR1_2100.mat and IR1_2130.mat in MATLAB, as shown in Figure 5. Then, according to the method described herein, we add the wind vectors into the satellite cloud map, shown in Figures 6 and 7.
As can be seen from the above clear that it basically draw the wind vector at the nonzero wind vector area and the directions of the arrows roughly agree with the clouds moving trend. About the size of the wind speed, for instance, the wind speeds of typhoon located at the lower right corner are around 20 (m/s). It is generally consistent with the weather of the time.
6. Conclusion
Cloud motion wind map reflects the strength and direction of wind very well. It can be generalized as the important reference for the long-term weather forecasts in meteorology. It is also playing an important role on mastery atmospheric circulation and indicating disastrous weather. This article has completely described the whole process of calculating cloud motion wind by the use of the theory of analytic geometry and MATLAB computing software. The method is simple, fast, and easy to operate and promote. Using relevant meteorological data, we present intuitive and basically consistent with the actual cloud motion wind map. However, the window size of the clouds this algorithm selected is limited to 16 × 16 pixels. And the search scope is limited to 64 × 64 pixels. But in practical application, fixed window size and search scope do not completely extract the feature information of images. Missing information reduce the quality of the pixel block matching. Therefore, it has limitations. In order to improve the quality of the pixel block matching, we can consider abolishing the limited window size and search scope. Design the effective method which can adaptively determine the window size and the search range. Because errors exist in both the cloud map matching process and the cloud motion wind calculating process, how to reduce these errors and make the accuracy of the results to a further improvement and enhancement is our work that we need to continue research.
NOTES