Determination of caprine serum albumin in milk using bromocresol green dye ()
1. INTRODUCTION
Although the physiological function of milk serum albumin is unclear, increased serum albumin levels can be used as an indicator of mammary gland health status. Bovine serum albumin-immunoglobulin complex in milk has been linked to immune defense reactions occurring during early stages of udder infections [1]. Similar findings have also been reported for caprine [2]. Indicator dyes such as methyl orange, coomasie blue, Cu (II)-arsenazo K, bromophenol blue, bromocresol purple (BCP) and bromocresol green (BCG) have been previously used to determine serum protein concentrations in domestic animals and humans [3-5]. However, different dyes have shown varied degree of specificity, sensitivity and suitability for specific serum proteins [6]. Other researchers have utilized the same approach to determine serum albumin concentration in bovine milk [1,7,8]. To date no similar assays have been developed to determine serum albumin in caprine milk. Caprine serum albumin in milk had been previously quantified using single radial immunodiffusion assay [9], and enzyme-linked immunosorbent assay [2]. However, the measurement of the ring-shaped precipitates using a video camera system and the 20 to 22 h incubation of plates in a moist box makes the SRID procedure tedious, time consuming and cumbersome for rapid screening of milk samples [9]. Furthermore, the lack of commercially available antibodies still limits the use of ELISA for determining serum albumin in milk. The dye-binding method is commonly used to determine serum proteins because of its simplicity and rapidity but is often criticized for overestimating albumin concentration. The dye-binding technique is characterized by an ionic interaction between positively charged albumin and negatively charged dye molecules at acidic pH. Factors such as optimal pH, ionic strength of buffer, sample preparation, dilution rate, incubation time and interfering proteins affect the accuracy of the technique [1,10]. This work intends to describe a colorimetric method for measuring CSA in milk using a dye-binding technique.
2. MATERIALS AND METHODS
2.1. Bromocresol Green (BCG) Dye Stock Solution
All reagents were of analytical grades and purified water from Milli-Q system was used throughout the experiment. The BCG stock solution was prepared by mixing 4 ml of 10.4% NaOH, 0.50 g of BCG dye (Sigma Chemical Co. St. Louis, MO. USA), 10 ml of Tween 20, 30 ml of 85% lactic acid and then completed to 11 ml with deionized water and the pH was adjusted to 4.0 by drop-wise addition of 0.1 N NaOH. Bromocresol green stock solution was stored in closed amble bottle at 4˚C and remained stable for 3 months. The BCG working solution was obtained by further dilution with deionized water (1:5) before addition to whey. An equal portion of 0.05% citric acid and 0.09% bisodium hydrogen phosphate was mixed to constitute a buffer (pH 6.5), to simulate the milk serum phase.
2.2. Instrumentation
EL×800TM Absorbance Microplate Reader (Bio-Tek Instruments Inc, Vermont, USA) and SynergyTM HT Multi-Detection Microplate Reader (Bio-Tek Instruments Inc, Vermont, USA) were used in the study. The readers had wavelength range of 380 to 900 nm, dynamic range of 0.1 to 4.0 optical density and a reading speed of 12 seconds (regular mode), 8 seconds (single wavelength rapid mode) and 13 seconds (dual wavelength rapid mode).
2.3. Sample Preparation
Whey was separated from milk by acid precipitation using acetic acid and sodium acetate followed by centrifugation at 2000 × g, for 15 min at 21˚C [11]. Supernatant (whey) was further defatted by centrifugation for another 15 min at the same speed and then stored at −20˚C until analysis. Skim milk was prepared by centrifugation at 2000 × g for 30 min at 4˚C.
2.4. Caprine Serum Albumin Standard Curve
Purified lyophilized caprine albumin (Sigma Chemical Co. St. Louis, MO, USA) was dissolved in a citric acid buffer to prepare CSA standard. The CSA standard curve was daily prepared by diluting 8.0 mg/ml CSA standards to 6.0, 4.0, 2.0, and 1.0 mg/ml with deionized water. One ml of BCG working solution was then added to 200 μl of each diluted standard, incubated for 3 minute at room temperature and absorbance was read at 640 nm against a blank (deionized water). The optical density of blank was subtracted from standards values to obtain real sample optical density. The CSA standard curve was obtained by plotting absorbance values of standards against logarithm of their respective albumin concentrations and the CSA concentrations in milk samples were calculated from the linear equation of the curve.
To assess the stability of the developed method, standard curves were consecutively generated 10 times within 2 weeks and the relative standard deviation (RSD) of the measured absorbance in 4 replicates at each calibration point on 10 curves (range of 0.1 to 8 mg/ml) was determined.
2.5. Assay Validation
The repeatability and reliability of the BCG method was evaluated by performing repeated measurements on milk samples (n = 8) within one day at different dilutions using same reagents and assay performed under same analytical conditions. Hundred micro liter of acid-precipitated whey (1:4 dilutions with deionized water) was used for all samples. The variability of the method was further tested by repeating assay on 10 duplicates of milk samples (n = 4) for 4 successive days under the same conditions to assess between batch variations. In a parallel approach, assay was performed on milk samples (n = 4) at different dilution rates to assess how parallel the responses were to the standard curve.
2.6. Spiking and Recovery
Caprine milk samples (n = 8) were spiked with albumin standards at concentrations of 1.0, 2.0, 3.0, and 4.0 mg/ml. The spiked milk samples were analyzed by the modified BCG assay. The quantitative recovery of added CSA were calculated and expressed as percentage CSA recovered divided by amount added.
2.7. Assay Application
Individual milk samples (n = 53) from 6 healthy Saanen goats (same age and parity) in early lactation were collected weekly over a period of 70 days and assayed for CSA to test the utility of the developed BCG assay. To further test the utility of the proposed BCG method and to correlate CSA with milk constituents, individual milk samples (n = 74) were collected from lactating Saanen goats at three different stages of lactation and were tested for milk serum albumin. Animals were 1 to 9 years old with an average milk production of 1000 liters per goat (300 days of lactation). Milk samples were also analyzed for somatic cells, fat, protein and lactose using a Milko Scan Infrared analyzer (Model: Foss 4000, Foss Food Technology, Denmark) calibrated for caprine milk. Total solids, casein, and whey were determined according to the procedures of [11] with the exception that N in milk and whey was determined using TruSpec Nitrogen Determinator (Model: 630-100-200 Leco Corporation, USA).
2.8. Statistical Analysis
All validation studies were repeated two times and all measurements were carried out at least in duplicates. Repeatability, reproducibility, averages, standard deviations, coefficients of variation and correlation coefficients were determined using Microsoft Excel 2003. Caprine serum albumin data were analyzed as repeated measures using PROC MIXED procedure of SAS [12] with the following model:

where Yij = the observations for the dependent variables, μ = overall mean, Di = the effect of ith days in milk, Gj = the random effect of jth goat, Di*Gj = the effect of interaction between days in milk and goat, eij = the residual error.
Normality of distribution for serum albumin was assessed using the Shapiro-Wilk test. Multiple comparisons of the serum albumin concentrations were made using Scheffe’s Test. Effects of sample pre-treatments and incubation time were tested using the Student’s t-test. Differences were considered significant at p < 0.05. Values of SCC were log transformed before statistical analysis to enhance linearity. Pearson correlation coefficients between CSA and other milk components and their associated probabilities were determined using PROC CORR of SAS [12].
3. RESULTS AND DISCUSSION
3.1. Dye-Binding Assay
The quantitative parameters for the determination of milk CSA using the proposed BCG method are summarized in Table 1. The proposed BCG assay showed acceptable linearity, accuracy and precision for the determination of CSA in milk. For routine screening of milk samples for serum albumin, the BCG assay can be a simple and rapid alternative. However, immunological methods (e.g. SRID and ELISA) may be more suitable for confirmatory serum albumin test owing to their sensitivity and specificity. However, the preparation of antibodies and long incubation time makes SRID and ELISA time consuming and technically demanding. In our proposed assay, the run time for a sample was less than 5 minutes after sample preparation.
3.2. Caprine Serum Albumin Standard Curve
A typical standard curve used in the assay development is presented in Figure 1. A linear relationship was obtained when absorbance values were plotted against
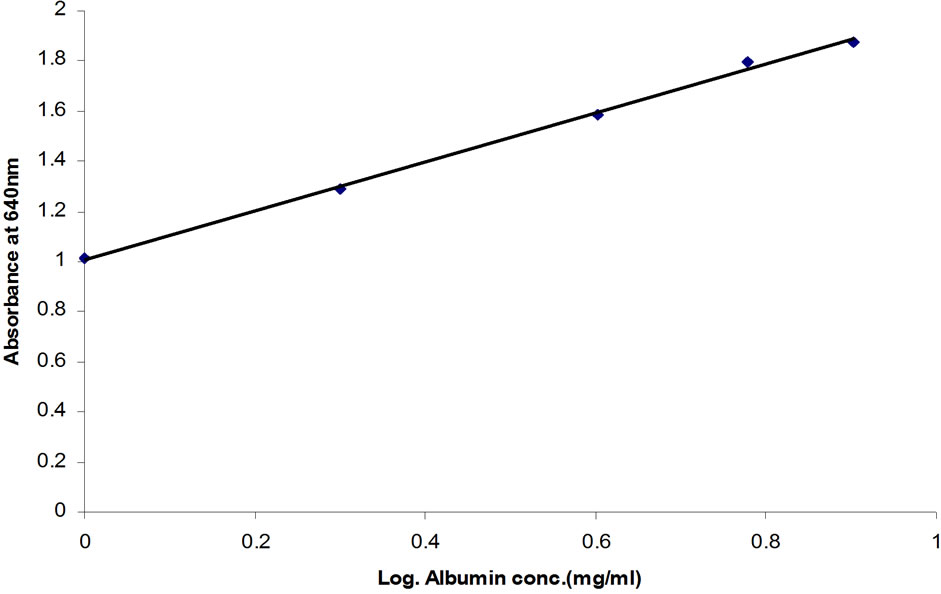
Figure 1. Caprine serum albumin (CSA) standard curve—Absorbance plotted against logarithm of CSA concentration (R2 = 0.9979).
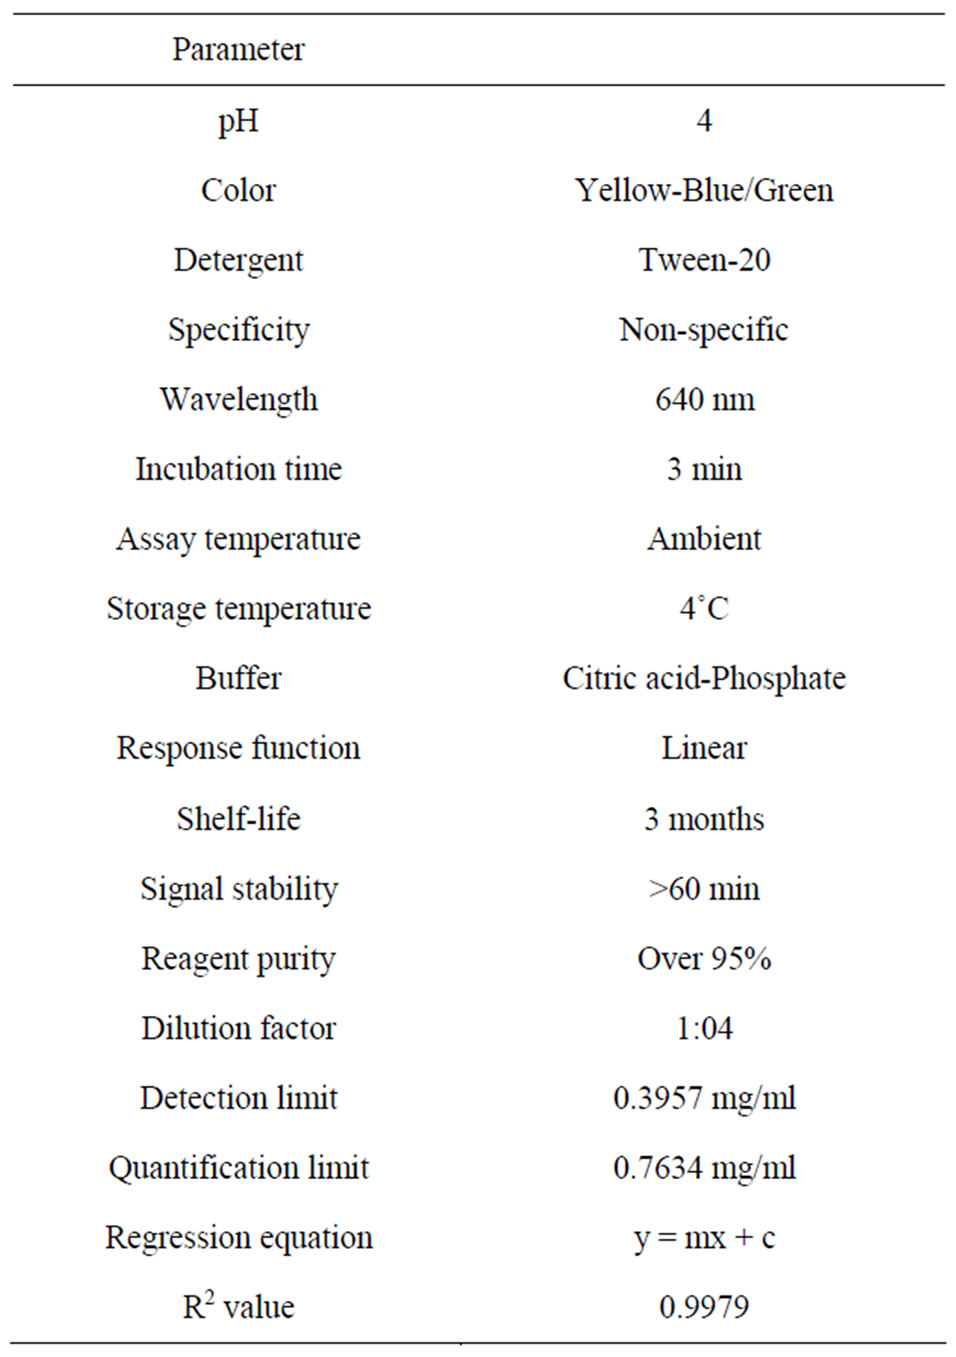
Table 1. Quantitative parameters for the determination of caprine serum albumin using bromocresol green dye.
the logarithm of CSA concentration (0.1 to 8.0 mg∙ml−1) and the correlation coefficient for the linear equations exceeded 0.99. Parallel results were obtained when diluted whey samples were assayed using the BCG method (Figure 2). The residual standard deviation of measured absorbance in 10 standard curves at each calibration point was within 10%. Purified lyophilized caprine albumin was used as a standard to prevent overestimation of the results. In our study, a combination of citric acid and sodium phosphate provided a buffer system suitable for use as a diluent. Other studies have used the Jennes and Koops buffer, pH 6.7, in preparing BSA standard for BCG method [1]. However, this involves the addition of several chemicals [13]. The calibration of the BCG assay is therefore best performed in a buffer at natural pH of milk (i.e. 6.3 to 6.7, [1]). The use of dairy-based diluents for caprine albumin standard in this study resulted in incomplete recovery of albumin (data not shown). In line with our results, the dispersion of bovine albumin standards in dairy-based diluents reduced analytical recovery of BSA from spiked milk and overestimated BSA concentrations [1]. This confirms a high degree of similarity in the biophysical properties of BSA and CSA in milk.
3.3. Effects of Sample Treatments on the Determination of Caprine Serum Albumin in Milk
Effects of sample preparation on the accuracy of the BCG method are presented in Table 2. Validation of the BCG assay showed that CSA is best estimated from whey substrate after acid precipitation and double centrifugation to remove fat and cells. The CSA values in our study were found to higher (p < 0.05) in skim milk than in whey. In agreement with our findings, Lieske et al. [1] obtained higher BSA values in skim milk than in whey. Higher CSA values in skim milk may be due to interference from natural milk proteins.
Serum albumin may bind with fatty acids interfering with the accuracy of the assay when whey is used [14,15]. There was no detectable color change when BCG assay was performed on undiluted skim milk. It appeared that
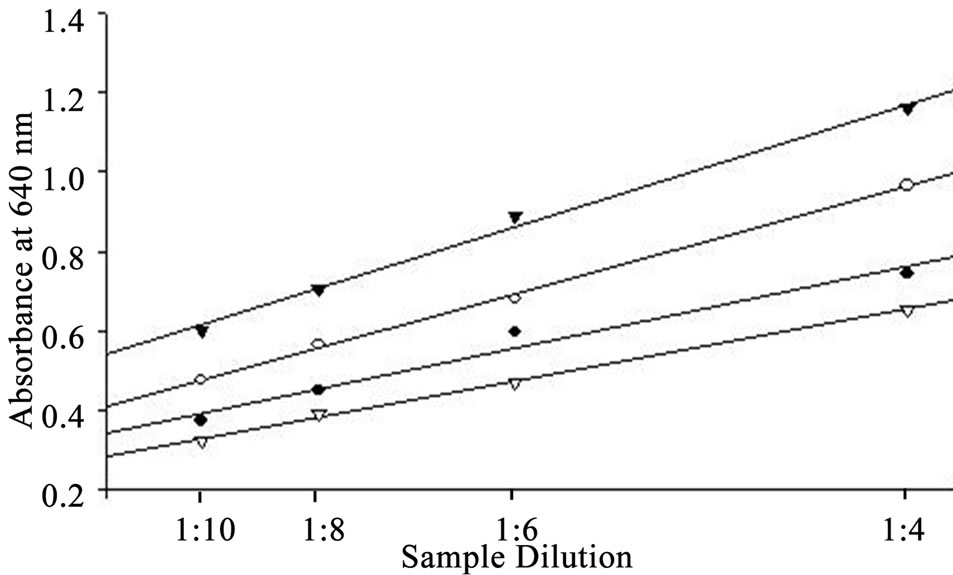
Figure 2. Curves for dilutions of whey samples parallel to the standard curve.
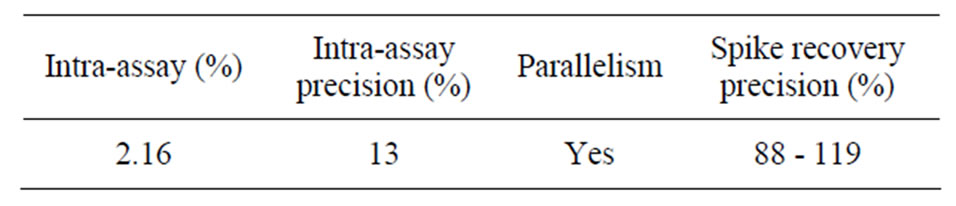
Table 2. Accuracy and precision of the BC method.
the determination of CSA was best in whey, however, different CSA values in diluted and undiluted whey substrates indicated the need for further investigations. Following repeated measurements of CSA at different dilutions and pH adjustment, a dilution factor of 1:4 proved sufficient to obtain reliable CSA estimates. Pre-dilution of whey with deionized water did not produce conformational re-arrangement of whey proteins. However, dilution effects were accounted for in the calculation of CSA values.
Further results in our study showed no evidence of coprecipitation or co-sedimentation of CSA with casein during acidification. However, previous studies with bovine milk suggested that BSA may partially precipitate with casein during acidification due to the proximity between the isoelectric points of serum albumin and caseins [15]. However, whey samples prepared by acid precipitation or ultracentrifugation have been reported to contain similar amounts of BSA when enzyme immunoassay was used [16]. In general, the opaque nature of milk and its turbidity makes treatment necessary before analysis.
3.4. Effects of Incubation Time on Bromocresol Green Dye-Binding Assay
There was no significant difference in CSA concentration when absorbance was read 3 or 60 minutes after incubation. However, the non-specific binding of the BCG dye to immunoglobulins in milk was minimized by shortening the incubation time to 3 minutes. Webster [17] showed that the binding of BCG to albumin occurred in less than 30 seconds after the dye addition. However, color intensity increased with time due to the binding of BCG to serum globulin. Serum albumin values for cattle, sheep and horses obtained after 10 min incubations were significantly higher than those obtained by the immediate BCG reaction [3]. Overall, serum albumin reacts faster with BCG dye than globulins. The formation of CSA/dye complex (color development) over time depends on the immune defense reactions in the mammary gland from which milk is collected, the concentration of immunoglobulins in milk and on the protein-protein interactions between CSA and immunoglobulin’s [1]. However, these interferences may be minimized by the separation procedures and thermal treatments applied to milk before the actual analysis.
3.5. Spiking and Recovery
The analytical recovery of added CSA was 89.15% ± 7.6% (Table 2) and was lower than the recovery previously reported for BSA using BCG method (98.8% ± 1.5%; [1]). However, the mean recovery in our study falls within the range (80% to 110%) recommended by AOAC [11] for substances greater than 0.1 mg/ml. The residual standard deviation for all measurements was within 10%. Response to the additions of CSA was linear and the correlation coefficient between the CSA recovered and added was 0.97 ± 0.02. The good recovery of albumin suggests minimal interference from other serum or milk proteins and confirms the colorimetric assay as a reliable technique to quantify CSA. This also suggests minimal molecular and structural changes of serum albumin when binding with dye and further proves that serum albumin is completely dispersed in the dye and ready to react with the BCG reagent. On the other hand, the incomplete recovery of added CSA at certain concentrations may be due to the aggregation of CSA with the natural immunoglobulin in milk [1].
3.6. Caprine Serum Albumin Concentrations in Milk during Early Lactation
Intra-assay (2.6%) and inter-assay (12%) coefficients of variations in our study (Table 3) were within acceptable limits required to validate a bio-analytical method [11] and demonstrated that the proposed BCG assay can generate reproducible results. The relatively high inter-assay precision is likely due to molecular-structural changes of CSA in the dye [1]. After re-validation, the proposed BCG method was used to measure serum albumin in milk samples collected from lactating goats. Concentrations of CSA in milk collected from goats in early lactation (7 to 70 days in milk) ranged between 0.31 and 0.52 mg/ml (Figure 3). The CSA values in our study agree with those of Sordillo et al. [18], Belewu and Adewusi [19] and Leitner et al. [20] who reported values ranging between 0.26 and 0.56 mg/ml for healthy goats.
Concentrations of CSA declined (p < 0.05) rapidly between day 7 and day 17 in lactation and remained stable between day 17 and day 66. Serum albumin concentration in milk of healthy animals is usually very low and it enters the milk from the systemic fluid by leaking through the epithelial tight junctions [21]. During lactation, the tight junctions do not allow blood constituents other than small ions to pass between the epithelial cells [22]. However, tight junctions may become leaky during colostrogenesis when the gland transit from involution to lactogenesis and at late lactation during physiological change from lactation to involutio resulting in increased paracellular transport [18]. High intramammary pressure induced by cessation of milking at late lactation may also rupture blood-milk barrier, thereby increasing paracellular permeability [22]. Serum albumin concentration in milk also increases during inflammations in the mammary gland [23].
The relatively high CSA concentration at day 7 in our study may be due to the residual effect from parturition during which the tight junction is leaky allowing the movement of blood solutes and leukocytes into the gland and closes back at the beginning of lactation [24]. This is consistent with the findings of Sordilo et al. (1984) in which CSA gradually declined from 0.64 mg/ml at day 7 to 0.23 mg/ml at day 30 of lactation. Similar decline has also been reported for milk BSA [9,18].
3.7. Relationship between Caprine Serum Albumin and Milk Constituents
Caprine serum albumin concentrations in milk, SCC and milk composition of Saanen goats (n = 73) are presented in Table 4. Caprine serum albumin concentration averaged 0.32 ± 0.16 mg/ml, and ranged between 0.18 and 0.32 mg/ml. The mean value agrees with those reported for healthy goats (0.279 ± 0.022 mg/ml; [2]). Somatic cell counts in caprine milk in our study averaged 1,414,750 cells/ml (Table 4), which is within the values reported for healthy goats [25,26]. A high SCC is considered normal in caprine milklikely due to the shedding of cytoplasmic particles and epithelial cells into milk during milk secretion [26]. However, caprine milk with SCC above 2,000,000 cells ml−1 may be considered subclinically mastitic [2].
The positive association between CSA and SCC (Table 5) could be attributed to the leakage of serum protein from the interstitial fluid into milk during leukocyte transmigration [27]. The negative correlation between lactose concentration and CSA (Table 5) is likely due to the reduction in lactose biosynthesis [28] and/or to the passage of lactose from milk to the blood via leaky tight junctions [24]. Similar relationships between milk serum albumin and SCC have been reported for caprine,
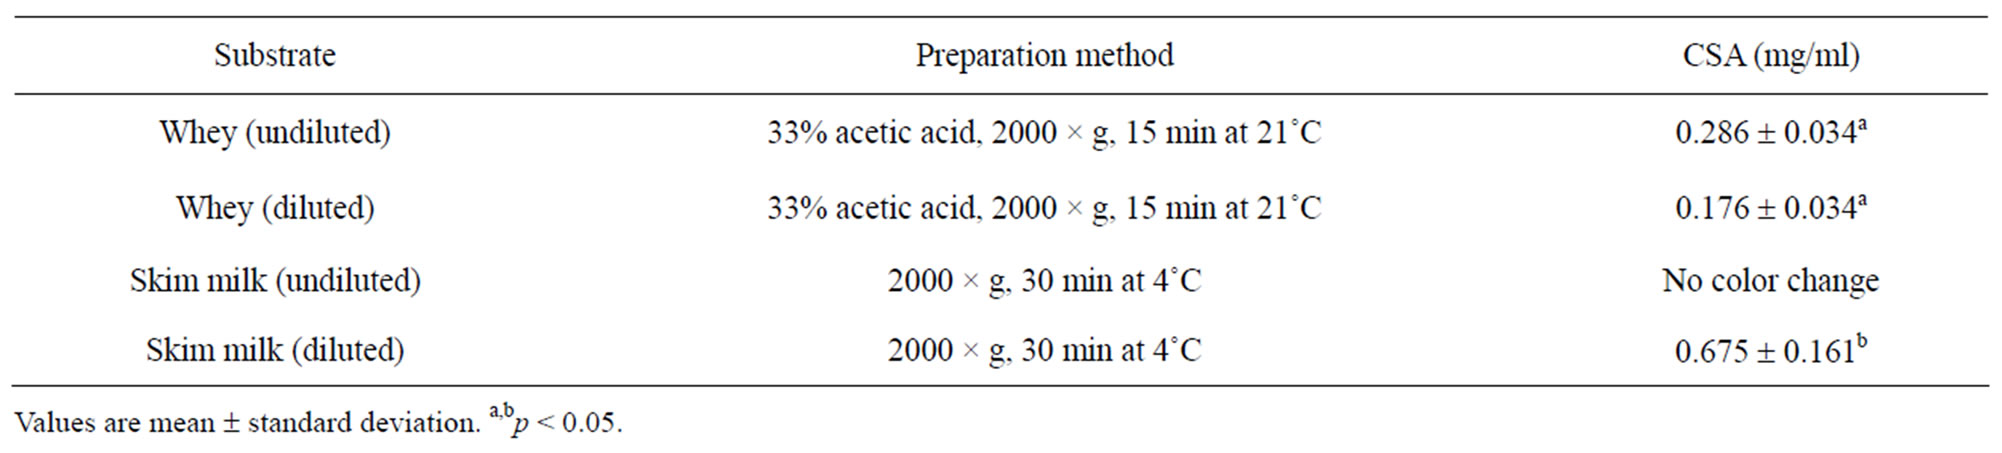
Table 3. Effects of sample preparation on the accuracy of caprine serum albumin (CSA) in milk.
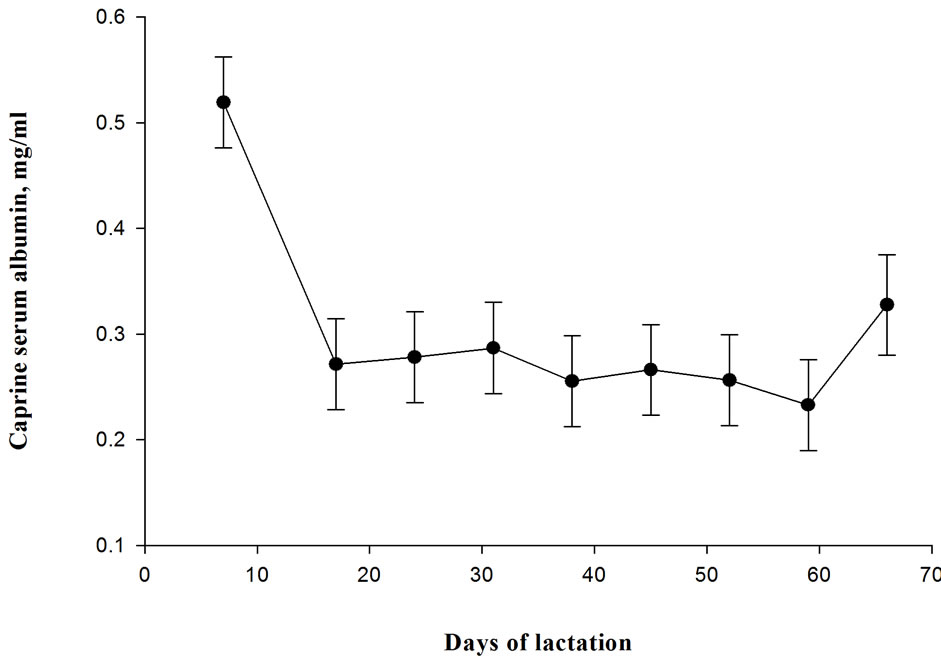
Figure 3. Caprine serum albumin (CSA) concentrations in lactating goats’ milk. Values are means ± standard error of the mean. n = 6 goats at each time.
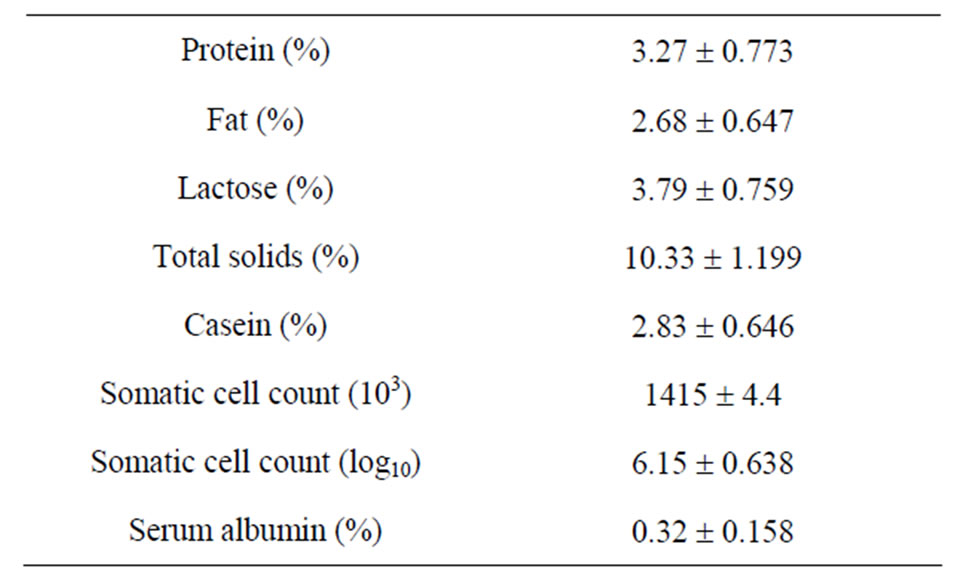
Table 4. Average (±SD) milk composition of Saanen goats (n = 73).
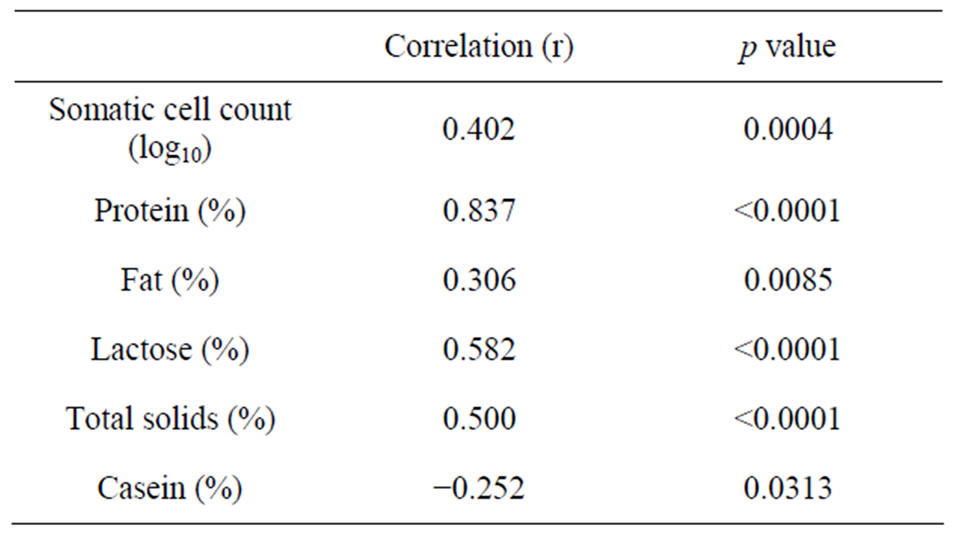
Table 5. Relationships between milk caprine serum albumin and milk components.
ovine and bovine [2,20,29]. The negative association between casein and CSA concentrations (Table 5) in our study may be due to reduced secretion and increased proteolysis of caseins by blood-borne protease such as plasmin (Politis et al., 1992) [30].
4. CONCLUSION
The described BCG assay shows a high degree of accuracy and precision and can be used as a routine technique for the determination of serum albumin concentrations in caprine milk under various physiological conditions. However, sample pre-treatment, pH of dye, ionic strength of buffer, incubation time and dilution rate are the critical factors in the procedure. Application of the assay in determining milk CSA revealed that milk of healthy goats contains 0.31 to 0.52 mg/ml. CSA serum albumin concentrations in milk tend to be high at the beginning of lactation, decline gradually and remain relatively stable in mature milk. The positive association between CSA and SCC can be attributed to the leakage of serum protein.