The Role of Myc and the miR-17~92 Cluster in Histone Deacetylase Inhibitor Induced Apoptosis of Solid Tumors ()
1. Introduction
In recent years histone deacetylases (HDACs) have emerged as promising targets for therapeutic intervention to reverse aberrant epigenetic modifications associated with cancer [1]. As a result, intense effort has focused on the development of histone deacetylase inhibitors (HDACi’s) for cancer therapy. By preventing the deacetylation of histones and other proteins, these agents modulate chromatin structure and regulate global gene expression [2]. Several HDACi’s differ in chemical structure and capacity to inhibit the activity of class I, II, and IV HDACs with various efficiencies [3] have been developed. Vorinostat (SAHA) was the first HDACi to demonstrate efficacy in the clinic and was FDA approved for use in refractory cutaneous T cell lymphoma (CTCL) [4]. LAQ824 is another similar HDACi with broad HDAC inhibitory activity that is in early-phase clinical trials [5]. SAHA and LAQ824 both target HDACs 1, 2, 3, 5, 6, 7, 9, and 10, however LAQ824 also inhibits HDAC 8 and 11.
Cancer can develop from a combination of epigenetic and genetic dysfunctions resulting in deregulated gene expression [6]. Indeed, global hypo-acetylation of histone H4 is a hallmark of human tumors [3] and may play a role in the silencing of tumor suppressor genes which contribute to tumorigenesis. Inhibition of HDACs could therefore allow for the restructuring of the aberrant cellular machinery of tumors and the restoration of a “normal” epigenetic state as a result of increased expression of proteins responsible for cell cycle arrest, differentiation, and apoptosis [3].
C-Myc (Myc) is an oncogene commonly over-expressed in many human cancers [7,8] that plays a critical role in the regulation of cell proliferation [9], differentiation [10], and apoptosis [11]. Its importance is further emphasized by the fact that it is the only oncogene that can potently induce tumorigenesis in its wild-type form in transgenic animal models [12]. Myc is known to regulate the transcription of many genes to elicit its pleiotropic effects including small non-coding RNAs known as microRNA (miRNA) which have recently emerged as important components of the Myc target gene network.
MicroRNAs (miRNA) are a class of 20 - 25 nucleotide-long RNAs that modulate gene expression at the post-transcriptional level by mediating mRNA translational repression and/or RNA degradation [13]. They play a critical role in many cellular processes and their expression is aberrant in cancer where they can act as either tumor suppressors or oncogenes [14]. The miR- 17~92 cluster (miR-17~92) was one of the first oncogenic miRNA clusters to be identified and is frequently amplified or over-expressed in human cancers [15,16] where it has been shown to promote cell cycle progression and proliferation [15], inhibit apoptosis [17,18] and senescence [19], and induce tumor angiogenesis [20]. Located at 13q31.3, it is a polycistron encoding six mature miRNAs (miR-17, miR-18a, miR-19a and miR- 19b-1, miR-20a, and miR-92a-1) which are transcribed as one common primary transcript. MiR-17~92 is the primary target of the genomic amplification 13q31 that occurs in lymphoma and several other tumor types [21] and can also be directly activated by the proto-oncogene Myc [22]. It induces tumor growth by repressing the expression of several pro-apoptotic proteins including E2F1 [23], PTEN [18,24], p21 [25], and Bim [17,26].
Although favorable responses to HDACi’s as single agents have been shown in hematological malignancies, very little efficacy has been demonstrated in solid tumors. Predictive biomarkers are useful in the clinic as an indicator of which patients are more likely to respond to a particular treatment. For instance, HR23B, a protein important for proteasome degradation, was recently found to be a potential predictive biomarker for HDAC inhibitor-induced apoptosis [27]. However, there is a critical need for additional predictive biomarkers to increase the responsiveness to HDACi in patients with solid tumors. Recently several studies have demonstrated a critical role for Myc in HDACi-mediated cellular death [28-30]. To expand upon these findings and determine the role that Myc plays in solid tumors, we compared the efficacy of two HDACi’s, SAHA and LAQ824, in cells with high or low levels of Myc. Interestingly, we found a significant difference in response between the two cell types and also highlighted a novel mechanism of HDACi-induced cell death which could be leveraged in patients with solid tumors expressing high levels of Myc.
2. Materials and Methods
2.1. Cell Lines, Tissue Culture and Reagents
SW620, AU565, MDA-MB-231, MCF-7, Calu-6, SW948, COLO205, HCT-116, H1975, H460, H1792, PC3, DU145, and A549 were purchased from American Type Culture Collection (ATCC, Manassas, VA) within a 4-year period. Cells were grown in the media and supplements specified by ATCC and maintained at 37˚C under a humidified atmosphere of 5% CO2 (except SW620 and SW948 which were kept in CO2 free conditions). Histone deacetylase inhibitors (HDACi’s) vorinostat (SAHA) and LAQ824 were purchased from Selleck Chemicals (Boston, MA).
2.2. miRNA/RNA Extraction
The miRNeasy mini kit (Qiagen, Valencia, CA) was used to extract both miRNA and miRNA according to the instructions provided by the manufacturer. Product purity and quality were monitored with a NanoDrop spectrophotometer (Thermo Fisher, Pittsburg, PA).
2.3. Quantitative Reverse Transcription Polymerase Chain Reaction (qRT-PCR)
cDNA reverse transcription was performed using ABI’s MultiScribe Reverse Transcriptase assays (Life Technologies, Grand Island, NY). RT-PCR was performed on ABI’s 7900HT fast real-time PCR system using ABI Taqman arrays for Bim, HMG2A, hsa-miR-18A, hsamiR-19A, hsa-miR-20A, actin (reference gene for Bim) and RNU6B (reference gene for miRs). The ΔΔCT method was used to calculate fold change relative to control.
2.4. Western Blotting
Western blot analysis of cell lysates was performed using standard procedures. Cells were lysed using RIPA buffer composed of a cocktail of protease and phosphotase inhibitors and PMSF (Sigma, St. Louis, MO). Cell lysates were sonicated and centrifuged to remove debris. Western blots were performed using primary antibodies to Bim (#2933) and cleaved Parp (#9541) (Cell Signaling, Boston, MA), c-Myc (#1472-1) (Epitomics, Burlingame, CA), Acetyl-H3 (#06599) and p21 (#05345) (Millipore, Billerica, MA), and Actin (#A5316) (Sigma-Aldrich, St. Louis, MO). Western blot images and densitometric analysis were performed on a LICOR Odyssey Infrared Imaging System and associated software.
2.5. GI50 Analysis
Growth studies were performed on cells treated for two days with DMSO or increasing concentrations of HDACi’s using the Cyquant assay (Life Technologies, Grand Island, NY) and a Biotek microplate reader. GraphPad Prism Software (San Diego, CA) was used to generate GI50 (the concentration of drug that causes 50% reduction in the proliferation of cancer cells) values.
2.6. Cell Cycle Analysis
After treatment, cells were resuspended in PBS and permeabilized by slowly adding to ice cold ethanol and incubating overnight at −20˚C. Cells were then washed twice with cold PBS and resuspended in a propidium iodide staining solution before analyzing on a BD FACS canto II flow cytometer. Cell cycle analysis was performed with FCS Express (DeNovo, Los Angeles, CA).
2.7. AntagomiR Transfection
Sixty nM antagomiRs for miR-18a, miR-19a, miR-20a, let7C (positive control), or a scrambled miR sequence (negative control) were reverse transfected into cells using siPORT transfection reagent (Life Technologies). Twenty-four hours after transfection, cells were collected and RNA was extracted using the miRNeasy mini kit as described previously.
2.8. Cell Growth Studies after AntagomiR Transfection
Following transfection of antagomiRs (see above), cells were stained with Hoechst stain and fixed in paraformaldehyde. Total cell number was assessed on the CellInsight high content platform (Thermo Fisher) after 0, 1, 2, or 3 days.
2.9. Myc siRNA
Fifteen nM of Myc smartpool siRNA or a non-targeting siRNA pool were transfected into cells using Dharmafect transfection reagent (Dharmacon, Lafayette, CO). Whole cell lysates and RNA were harvested twenty-four hours after transfection as described previously. For Myc siRNA GI50 experiments, cells were treated 24 hours after transfection and growth experiments were performed as described previously.
2.10. Statistical Analysis
Quantitative data from in vitro experiments are presented as mean +/− standard error from three independent experiments, and were analyzed with either the two-tailed Student’s T-Test or Analysis of Variance (ANOVA) test followed by a Tukey’s post-test using GraphPad Prism software. The Mann-Whitney nonparametric test was used to assess significant difference between the GI50 of HDAC inhibitors in Myc high and Myc low cells. A p-value less than 0.05 was considered significant.
3. Results
3.1. Solid Tumor Cells Expressing High Levels of Myc Are More Sensitive to HDACi
By genetically manipulating the expression of Myc in a rat fibroblast cell line model, Jiang et al. demonstrated that cells expressing higher levels of Myc were more sensitive to SAHA induced cell death [29]. To expand upon these studies and confirm this correlation in solid tumor cells, we first measured Myc expression in a panel of 14 cancer cell lines including 3 breast cancer (MCF-7, MDA-MB-231, and AU565), 5 lung cancer (H460, Calu-6, A549, H1975, and H1792), two prostate cancer (PC-3 and DU145) and 4 colon cancer (Colo205, SW620, SW948, and HCT116) cell lines. To assess the expression level of Myc in the cell lines, Western blots were performed using actin as a loading control (Figure 1(a)). Notably there were multiple bands associated with Myc that others have also observed [31] which may represent different splicing variants or post-translational modifications of the protein. Densitometry analysis was used to determine the intensity of all Myc bands relative to actin in order to graphically represent the blots. Interestingly, by arranging in order of increasing Myc levels, the cells grouped loosely together by cancer type with breast (except AU565) and prostate cancer falling at the lower end, lung cancer in the middle (except H460 and H1792), and colon cancer cells at the higher end of the Myc expression spectra (Figure 1(b)). We then calculated the median (0.178) of the Myc relative expression values for all 14 cell lines and used this to divide the cells into a Myc “low” (Myc relative expression < 0.178) and a Myc “high” (Myc relative expression > 0.178) group (Figure 1(b)). Cell viability assays were then performed on cells treated with a dose range of SAHA and LAQ824 for 48 hours to measure the GI50 (concentration of drug that causes 50% reduction in proliferation). Following a Mann-Whitney nonparametric test was used to statistically determine whether there was a significant difference in the GI50 between the Myc high and Myc low cells. The GI50 of both LAQ824 (Figure 1(c)) and SAHA (Figure 1(d)) was significantly lower (p-value < 0.05) in Myc high versus Myc low cells suggesting that solid tumor cells expressing higher levels of Myc are more sensitive to HDACi induced cell death.
3.2. Different Cellular Responses to HDACi Depending on Myc Expression Level
Since Myc plays an important role in proliferation and apoptosis, we hypothesized that there would be differences in the cellular response to HDAC inhibition depending on the expression level of Myc in the cell. To assess this, two representative Myc high (SW620 and AU565) cells and two representative Myc low (MDAMB-231 and MCF-7) cells were treated with DMSO, SAHA, or LAQ824 for 24 hours prior to analyzing apoptosis (using cleaved PARP) and cell cycle changes. Significantly more apoptosis was induced by HDACi treatment in Myc high cells as compared to Myc low
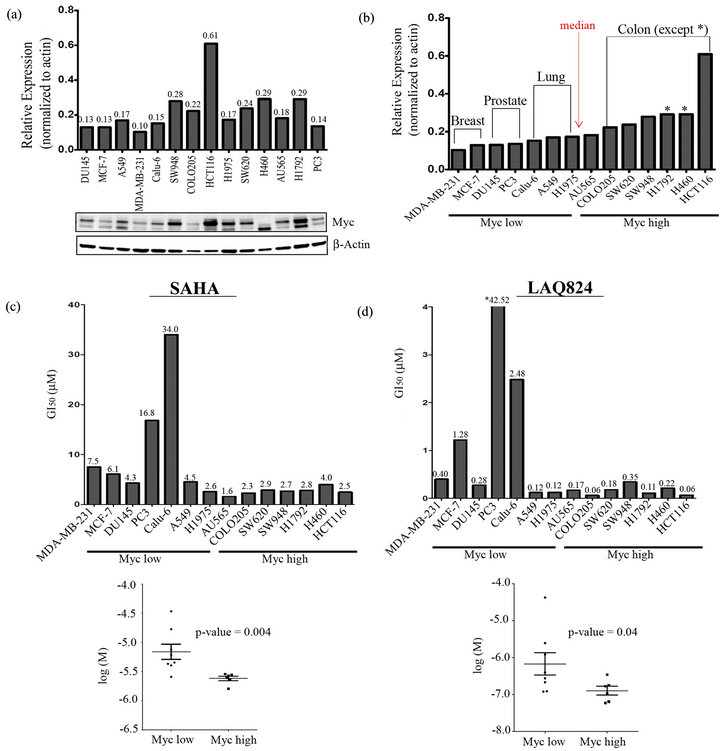
Figure 1. Cancer cells expressing high levels of Myc are more sensitive to SAHA and LAQ824. (a) Myc and β-Actin (loading control) were detected in whole cell lysates of 14 cell lines by immunoblotting. Densitometric analysis of Myc (normalized to β-Actin) was conducted using LICOR’s Odyssey Infrared Imaging System and associated software; (b) Bar graph from (a) with cells rearranged in order of increasing Myc expression. The median (0.178) of all 14 Myc relative expression values was used to divide the cells into a Myc “low” (Myc relative expression < 0.178) and a Myc “high” group (Myc relative expression > 0.178); (c) The GI50 of SAHA and (d), LAQ824 was measured in all 14 cell lines using Cyquant viability assays after 48 h treatment (3 independent experiments with 4 technical reps each) and GraphPad for analysis. The Mann-Whitney nonparametric test was then used to statistically determine whether there was a significant difference in the GI50 between “Myc low” and “Myc high” cells (p < 0.05).
cells as demonstrated by increased PARP cleavage and sub-G0 populations (Figures 2(a) and (b)). In contrast, with little increase in PARP cleavage or sub-G0 populations, HDACi induced G2-phase cell cycle arrest in Myc low cells. Together this data suggests that cells expressing high levels of Myc are more sensitive to HDACi due to an increased apoptotic response.
3.3. HDACi Treatment Reduces the Expression of the miR-17~92 Cluster
Several recent studies have demonstrated that treatment with HDACi’s result in reduced expression of the miRNA-17~92 (miR-17~92) cluster [32,33]. Since this cluster is oncogenic and a known target of Myc [22], it could potentially play a role in the cellular death mecha-

Figure 2. Cancer cells expressing high levels of Myc are more sensitive to apoptosis induced by SAHA and LAQ824. (a) and (b), Myc high (SW620 and AU565) and Myc low (MCF-7 and MDA-MB-231) cells were treated for 24 hours with DMSO, 1 µM LAQ824, or 10 µM SAHA. (a) After treatment, whole cell lysates were isolated and the expression of cleaved PARP and β-Actin (loading control) were detected by immunoblotting analysis. Two independent experiments and blots performed; (b) After treatment, cell cycle was analyzed on permeabilized cells stained with propidium iodide (PI) on the BD FACS canto II flow cytometer and representative histograms of analyzed data were generated with FCS Express. Cells in each phase are expressed as a percentage of total live cell population (stacked bar graphs) which includes all 3 technical replicates.
nism induced by HDACi. To determine if miR-17~92 was reduced by treatment with HDACi’s in our cells, we treated AU565, SW620, MDA-MB-231, and MCF-7 cells for 24 hours with DMSO, SAHA, or LAQ824 and measured its expression by qRT-PCR. Preliminary studies showed that the expression of miR-17, miR-19b, and miR-92 were not significantly affected by HDACi (data not shown). However, we did demonstrate that HDAC inhibition using SAHA or LAQ824 significantly reduced the expression of miR-18a, miR-19a, and miR-20a in all four cell lines (Figure 3).
3.4. Treatment with HDACi Decreases Expression of Myc, the Master Regulator of the miR-17~92 Cluster, and Induces Expression of the Proapoptotic Target Bim
Next we sought to determine how treatment with HDACi affects the expression of Myc and targets of the miR-17~ 92 cluster. To examine this, Western blots were per-

Figure 3. Treatment with SAHA or LAQ824 decreases expression of miR-18, miR-19, and miR-20. RNA was isolated from SW620, AU565, MDA-MB-231, and MCF-7 cells treated for 24 hours with DMSO or 1 µM LAQ824 or 10 µM SAHA. RT-PCR analysis was performed using ABI Taqman arrays for miR-18A, miR-19A, or miR-20A. RNU6B was used as a reference gene for normalization purposes. The ΔΔCT method was used to calculate relative expression compared to DMSO control. Graphs represent Mean ± SE for 3 independent experiments with 3 technical reps each. *denotes significant difference from DMSO (p < 0.05).
formed on lysates isolated from AU565, SW620, MCF-7 and MDA-MB-231 cells treated with DMSO or increasing concentrations of SAHA or LAQ824 for 24 hours. An increase in the expression of p21 and acetylated histone H3 (acetyl-H3), two well-known targets of HDACi’s, was used to demonstrate effectiveness of treatment. Both SAHA and LAQ824 induced a dose-dependent decrease in the expression of Myc in all four cell lines (Figure 4).
The miR-17~92 cluster has been shown to inhibit the expression of several targets which negatively impact cellular proliferation, including E2F1 [23], Pten [18,24] and Bim [17,26]. Although p21 is another target of the cluster [25], it is also directly induced by HDACi via epigenetic mechanisms. Although there was no change in the expression of either E2F1 or Pten with HDACi treatment (data not shown), there was a dose dependent increase in the expression of Bim in treated cells (Figure 4). The significant decrease in the expression of Bim and p21 in AU565 cells with 10 µM LAQ824 (relative to lower doses) was possibly due to excessive cell death. Interestingly, Bim induction was more potent (less HDACi needed for maximal induction) in Myc high SW620 and AU565 cells while p21 induction was more potent in Myc low MCF-7 and MDA-MB-231 cells. Since p21 is known to negatively regulate cell cycle progression [34] while Bim is one of the most potent pro-apoptotic proteins [35], these results again emphasize the different responses (apoptotic versus cell cycle arrest) induced by HDACi depending on the expression level of Myc in the cell.
3.5. Myc siRNA Inhibits the Expression of the miR-17~92 Cluster
To further support the idea that the cellular levels of Myc correlate to the expression of the miR-17~92 cluster, SW620 cells were transfected with Myc siRNA (or a scrambled siRNA control) and the expression of miR-18a, -19a, and -20a was measured by qRT-PCR. After transfection, there was a significant decrease in the expression of Myc and a concomitant decrease in the expression of all three miRs (Figures 5(a) and (b)). This confirms that Myc regulates the expression of the miR-17~92 cluster in these cell lines. Therefore its reduced expression with HDACi treatment may in turn result in decreased expression of miR-17~92.

Figure 4. Treatment with SAHA or LAQ824 decreases expression of Myc, the master regulator of the miR-17~92 cluster, and induces expression of the proapoptotic target Bim. Whole cell lysates were obtained from SW620, AU565, MDA-MB-231, and MCF-7 cells treated for 24 hours with DMSO or increasing concentrations (0.1, 1.0, or 10 µM) of SAHA or LAQ824. The expression of Myc, Bim, p21, Acetylated-Histone-H3 (Acetyl-H3), and β-Actin (loading control) were detected by immunoblotting analysis as described in Materials and Methods. Two independent experiments and blots performed.
sion of miR-17~92.
3.6. Myc siRNA Increases Sensitivity to HDAC Inhibitors
To demonstrate that Myc expression is directly correlated with HDAC sensitivity, Myc high SW620 cells were transfected with Myc siRNA (or a scrambled siRNA control) and then treated for 48 hours with increasing concentrations of LAQ824 and SAHA. Inhibition of Myc expression resulted in an approximate 2-fold increase in the GI50 of both LAQ824 (Figure 5(c)) and SAHA (Figure 5(d)) which confirms that Myc sensitizes cells to HDACi-induced cell death.
3.7. Inhibition of Members of miR-17~92 Induces the Expression of Bim and Inhibits Cell Growth
To determine if decreased expression of the miR-17~92 cluster could result in increased expression of the proapoptotic target Bim [17,26,36] in Myc high cells, SW620 cells were transfected with antagomiRs that block the activity of miR-18, miR-19, or miR-20 (or a scrambled control) and Bim expression was measured by qRT-PCR. Inhibition of the activity of any of the three miRs was sufficient to significantly induce Bim expression (Figure 5(e)). Co-transfection of antagomiRs of all three miRs did not alter Bim expression more than the transfection any single antagomiR alone (data not shown).
These results confirm that the miR-17~92 cluster inhibits the expression of Bim and thus a decrease in the expression of the cluster with HDACi treatment could result in augmented expression of Bim and a subsequent increase in apoptosis.
To determine if reduced expression of the miR-17~92 cluster could inhibit the growth of Myc high cells, SW620 cells were again transfected with antagomiRs to miR-18, miR-19, or miR-20 (or a scrambled control) and cell growth was assessed 0, 1, 2 and 3 days later. Although decreased growth was observed after inhibition of miR-18 and miR-19 activity, only inhibition of miR-20 activity resulted in a statistically significant decrease in cell growth at 3 days (Figure 5(f)). This suggests that although miR-20 is a critical regulator of growth in these cells, all three miRs may play a role in this process. HDACi’s are known to impact several factors that contribute to cell death (i.e. cell cycle arrest by induction of p21). However, these results point to another important mechanism of HDACi-induced cell death which results from reduced expression of both Myc and the miR-17~92 cluster and leads to enhanced Bim expression and apoptosis (Figure 6(b)).
4. Discussion
Currently there are several ongoing clinical trials aimed at testing the efficacy of various HDACi’s (as both single
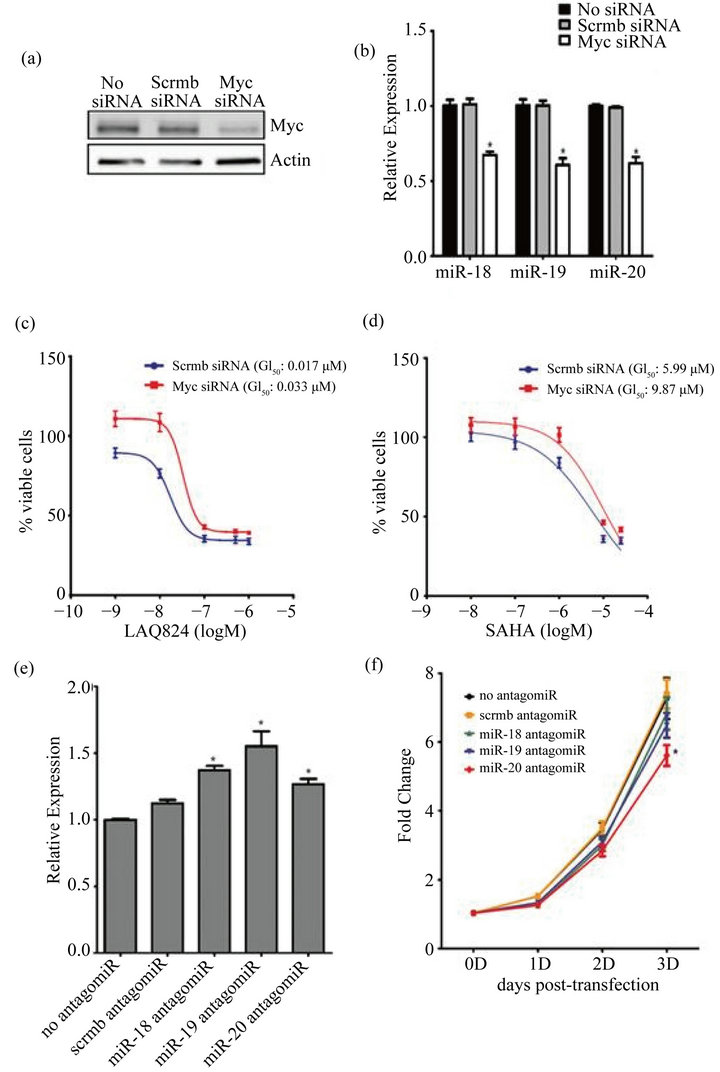
Figure 5. Inhibition of Myc reduces expression of the miR-17~92 cluster which induces Bim and inhibits cell growth. (a)-(d) Myc high SW620 cells were transfected with 15 nM of Myc smartpool siRNA or a non-targeting scrambled (scrmb) siRNA control for 24 hours; (a) whole cell lysates were harvested from transfected cells and Myc and β-Actin (loading control) expression were detected by immunoblotting analysis as described in Materials and Methods; (b) RNA was harvested from transfected cells and RT-PCR analysis was performed using ABI Taqman arrays for miR-18A, miR-19A, or miR-20A. RNU6B was used as a reference gene for normalization purposes. The ΔΔCT method was used to calculate relative expression as compared to no siRNA control; (c) and (d) Transfected SW620 cells were treated with increasing concentrations of LAQ824 (c) and SAHA (d) for 48 hours. GI50 was measured using Cyquant assays (2 independent experiments with 4 technical reps each) and GraphPad for analysis; (e) and (f) 60 nM antagomiRs for miR-18, miR-19, miR-20, and a scrambled miR sequence (scrmb antagomiR) were reverse transfected into SW620 cells; (e) 24 hours after transfection, RNA was collected and the expression of Bim was determined by RT-PCR. β-Actin was used as a reference gene for normalization purposes. The ΔΔCT method was used to calculate fold change relative to the no antagomiR control; (f) 0, 1, 2, or 3 days following transfection, cells were stained with Hoechst and fixed in paraformaldehyde. Total cell number was assessed on the cell in sight high throughput platform. Graphs represent Mean ± SE for 3 independent experiments with 3 technical reps each. *denotes significant difference from no antagmoiR or no siRNA control (p < 0.05).
and combination therapies) in patients with a wide range of tumor types (clinicaltrials.gov). However only two HDACi, SAHA (Vorinostat) and Romidepsin (depsipeptide), have been approved by the FDA and only for the treatment of cutaneous T-cell lymphoma (CTCL). Although favorable responses to HDACi’s as single agents have been shown in other hematological malignancies such as non-hodgkins lymphoma and acute myeloid leukemia, very little efficacy has been demonstrated in solid tumors. Our studies suggest that Myc expression may constitute a suitable biomarker for selection of patients with solid tumors that are likely to respond to HDACi.
A recent study in rat fibroblast cells has shown that Myc over-expressing cells were more sensitive to SAHA than cells devoid of Myc [29]. Our studies expand on these findings by confirming that Myc expression is an important indicator of sensitivity to HDACi’s in a variety of different solid tumor cell types and by demonstrating that the effect is not specific to SAHA but also occurs with other HDACi’s. Interestingly, we found a general pattern among the tumor cells that we tested with regard to Myc expression in specific cell types. The breast and prostate cancer cells tested had relatively low levels of Myc, while all four colon cancer cells had high levels of Myc. These results agree with past studies showing high Myc levels in approximately 70% of primary human colon tumors [37] and suggest that colon cancer patients may benefit most from HDACi treatment.
The divergent response to HDACi treatment between cells with high Myc levels versus those with low Myc is intriguing. In particular, the difference in the induction of Bim and p21 between the cell types is noteworthy. Apoptosis is thought to be an essential contributor to marked tumor regression upon treatment with cancer therapeutics [38] and Bim is one of its most critical mediators. On the other hand, although p21 is a potent negative regulator of the cell cycle, it can also be cytoprotective by enabling cells to survive in an arrested state during stressful conditions. Indeed, several studies have shown that the expression of p21 counteracts apoptosis which could inhibit the effect of cancer therapeutics [39-41]. Thus the balance between the expression of proapoptotic Bim and cytoprotective p21 could mean a real difference in the ability of a drug to slow the growth (cytostatic response) versus eradicate (cytotoxic response) the tumor. This was demonstrated in our studies when Myc low cells, which were more resistant to HDACi induced cell death, showed potent induction of p21 but less Bim induction and apoptosis, while the HDACi sensitive Myc high cells showed less p21 induction but heightened Bim induction and apoptosis.
In summary, our studies suggest a novel mechanism of HDACi mediated cell death which works together with those previously elucidated. In the untreated tumor, the expression of oncogenic Myc and in turn the miR-17~92 cluster is high (Figure 6(a)). This results in suppression of the master pro-apoptotic protein Bim, together with the epigenetic silencing of tumor suppressors such as p21, which allows for unrestricted tumor growth. By altering the acetylation status of chromatin and other non-histone proteins, HDACi modifies mechanisms that are detrimental to tumor growth. These include proteins involved in cell cycle arrest (p21, p53), apoptosis (XIAP), ROS induced cell death (TBP-2), angiogenesis (VHL and TSP1), and metastasis (RECK and TIMP1) [42]. How-

Figure 6. The role of Myc and the miR-17~92 cluster in HDAC induced cell death can be used to select patients who will respond to treatment. (a) In untreated tumors, tumor suppressors such as p21 are epigenetically silenced. In addition, Myc is highly expressed and drives the expression of the miR-17~92 cluster resulting in the inhibition of other tumor suppressors such as Bim. The net result is increased tumor growth; (b) Treatment with HDACi directly induces the expression of some tumor suppressors such as p21. In addition, results from our studies demonstrate that HDACi also work by reducing the expression of Myc which results in increased Bim-induced apoptosis.
ever, the results of our studies highlight a novel mechanism of HDACi-mediated cell death that results from decreased expression of Myc and the oncogenic miR-17~ 92 cluster and culminates in an increase in Bim-mediated apoptosis (Figure 6(b)). Although this mechanism occurs efficiently in cells expressing lower levels of Myc, we propose that cells with higher levels of Myc may be more addicted to this Myc driven pathway such that its inhibition with an HDACi would result in a greater impact on cell death. This was apparent from the enhanced Bim induction and apoptosis observed after HDACi treatment of the Myc high SW620 and AU565 cells compared to the Myc low MDA-MB-231 and MCF-7 cells. Interestingly however, MYC high and low cells showed a similar decrease in the expression of the miR-17~92 cluster upon treatment with HDACi. Although this suggests that other mechanisms may be involved in the regulation of Bim expression, the higher basal level of expression of miR-17~92 in cells with high versus low levels of MYC (data not shown) may make these cells more dependent on the Myc-miR-17~92-Bim network.
Together these results suggest a potential mechanism to overcome the discouraging results of HDACi in patients with solid tumors. By pre-selecting patients expressing high levels of Myc to receive HDACi treatment, it may be possible to obtain an improved success rate for this class of compounds. Furthermore, our studies suggest that colon cancer patients may benefit most from HDACi treatment due to their high expression of Myc. Preliminary studies from our lab and others (including the NCI-60 database (http://discover.nci.nih.gov)) also suggest that the miR-17~92 cluster is highly expressed in colon cancer cells. High expression of both Myc and the miR-17~92 cluster may allow for more addiction to the Myc-miR-17~92-Bim network and thus greater cell kill by HDACi. Follow-up studies in animal models and/or clinical trials are critical to confirm and expand upon these findings and are currently being pursued in our laboratories.