Spectral Investigations of Kiton Red-620 Doped Polymethylmethacrylate ()
1. Introduction
Laser materials are that type of substances in which the majority of atoms or molecules are in the excited energy states. Many solid, liquid, gaseous substances have been studied, including synthetic ruby crystal, helium-neon gas mixture and organic laser dyes, capable of continuous operation at a low power. Among all laser materials, the dye laser materials showed great impression due to the use of organic dye as the gain medium and their wide spectrum, which makes it highly tunable or to produce very short duration pulses. Organic dyes, due to their applications in tunable dye lasers and in other decorative purposes, play an important role in the vast area of materials science and technology. Dye laser materials have numerous applications in optics, electronics, photodynamic therapy, non-linear optics, dyes chemistry, materials processing, atmospheric and underwater sensing, local area communication networks, sensors [1-4], spectroscopy, birthmark removal, isotopes separation and industry [5] etc. A lack of toxicity and flammability, lower costs and, essentially, compactness would make them useful for medical applications or research work [6-8]. Laser materials, made by polymerization of laser dyes in the polymer host matrix, are an advanced class of materials with great deal of future promise for potential applications as high performance materials. In the present study, we use polymethylmethacrylate (PMMA) as a host matrix for laser dye doping due to their good transparency, resistivity, mechanical strength and optical homogeneity which play an important role to built up advanced optical materials.
Several research groups are engaged in the development and interpretation of these types of advanced materials. Fan Rongwei et al. [9] have reported the solid state dye lasers based on LDS 698 doped in modified polymethylmethacrylate. Schultheiss Slike et al. [10] have reported rhodamines in silica-zirconia materials. Scott J. Brian et al. [11] have reported mesoporous and mesostructured materials for optical applications. In the present study, the samples have been prepared with different concentrations of Kiton red-620 dye such as 0.36 × 10⁻⁴, 1.3 × 10⁻⁴, 2.2 × 10⁻⁴, 3.0 × 10⁻⁴ and 3.6 × 10⁻⁴ and 4.1 × 10⁻⁴ mol/L in polymethylmethacrylate matrix. The structural and optical characterizations of prepared samples were made using spectroscopic techniques such as FTIR, UV-visible and photoluminescence (PL). We have recorded the IR absorption spectra and fluorescence emission spectra at different concentrations of dye doped in PMMA matrix. Due to good transparency and homogeneity of laser dye in PMMA matrix and various other functional groups interaction between molecules and also shifting in absorption spectra with concentration of dye can explore the possibility of tunable dye lasers and luminescent materials for device fabrication.
2. Experimental Details
2.1. Chemicals and Chemical Doping
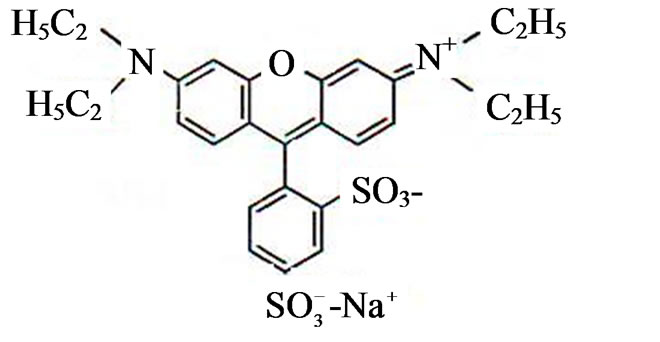
Perspex (PMMA) (Ruchi Enterprises Mumbai, India), Acetone (Spectrochem Pvt. Ltd., Mumbai, India), Kiton red-620 laser dye (Exciton Inc. Dayton, USA, M.W. 580.66 and structural formula C27H29N2O7S2Na).
The polymethylmethacrylate thin plastic films doped with Kiton red-620 dye have been prepared by dissolving perspex 17.0 g in acetone and stirring has been done about four days with the help of magnetic stirrer. Chemical doping of Kiton red-620 laser dye has been carried out by making solution of dye in acetone. The samples have been synthesized by adding dye solution with different concentrations into solution of perspex during polymerization process. The dye concentration in synthesized PMMA matrix varies as 0.36 × 10⁻⁴, 1.3 × 10⁻⁴, 2.2 × 10⁻⁴, 3.0 × 10⁻⁴, 3.6 × 10⁻⁴ and 4.1 × 10⁻⁴ mol/L. The resultant reaction mixture doped with Kiton red-620 dye was cast into flat bottom petridishes and put them in an oven at 42˚C for about 15 days so that the evaporation of acetone from the samples took place for completing the homogeneous incorporation of dye. The temperature was increased slowly upto 80˚C for 24 h for final ageing to achieve good physical and mechanical strength of prepared material in thin plastic film shape.

Kiton red-620
2.2. Characterization
Spectroscopic characterization is an essential tool which is useful to understand the optical properties and behaviour of interacting groups after doping of the synthesized materials. Prepared PMMA based thin plastic films on the basis of above reaction mechanisms have been characterized by IR spectroscopy using FTIR spectrophotometer (Nicolet 360). Kiton red-620 laser dye doped polymethylmethacrylate thin plastic films have been characterized optically using UV-visible spectrophotometer (Perkin Elmer Lambda). Fluorescence study of synthesized dye doped PMMA based materials have been performed using Fluorescence spectrophotometer (F-7000 FL).
3. Results and Discussion
3.1. FTIR Study
IR spectra of undoped and Kiton red-620 dye doped PMMA, exhibit several peaks as shown in Figures 1(a) - (c). To explain the effect of dopant we have taken FTIR spectra of polymethylmethacrylate at different dye concentrations such as 1.25 × 10⁻⁴, 3.6 × 10⁻⁴ mol/L. The absorption band in the region 3015 - 3010 cm–1 is mainly due to C-H stretching of PMMA. The main band in the region 1800 - 1000 cm–1 is associated with the combination of vibrations of CH3-CO2-C-CH3 network of polymethylmethacrylate. Region appears at about 1697 - 1650 cm–1 is due to stretching of C=O group. The absorption band appears at 1500 - 1430 cm–1 is due to C-H deformation of -CH3 group. The absorption band in the region 2843 - 2810 cm–1 is due to C-H stretching of C-O-CH3 group. The absorption band appears at 1459 - 1440
 (a)
(a) (b)
(b) (c)
(c)
Figure 1. FTIR spectra of PMMA (a) Undoped; (b) Doped with Kiton red-620, 1.25 × 10⁻⁴ mol/L; (c) Doped with Kiton red- 620, 3.6 × 10⁻⁴ mol/L.
cm–1 is due to C-H deformation of -CH2 group. The absorption band appears at 841 - 800 cm–1 due to stretching of C-C group. The absorption band appears 1395 - 1386 cm–1 is due to C-H deformation of C(CH3)2 group. It has been clear from the IR spectra of undoped and dye doped samples that the absorption band region 1800 - 1000 cm–1 becomes sharper as the concentration of dye increases in PMMA matrix and it may be due to the homogeneous dispersion of dye atoms/molecules in the PMMA matrix. It has been observed that the prolonged longed heat treatment of the samples at moderate temperature increases mechanical strength, abrasion resistance, transparency etc. which may be due to improvement in the bonding of PMMA network.
3.2. UV-Visible Study
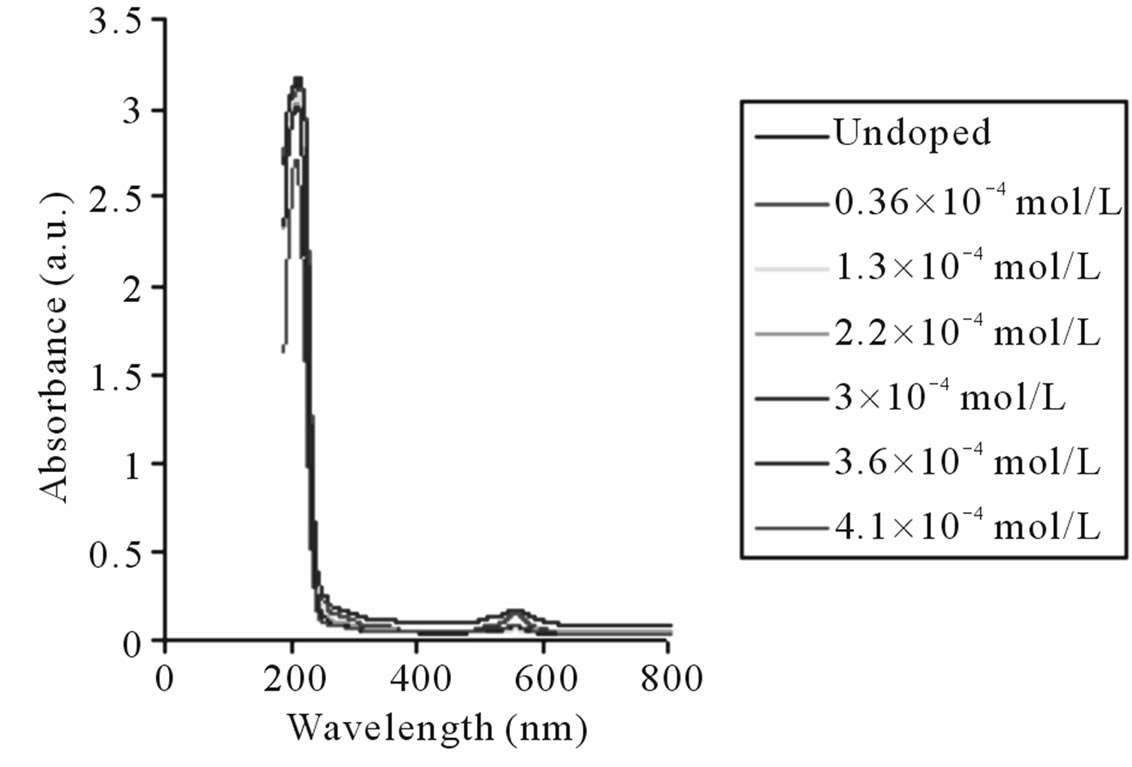
The absorption spectra of undoped and Kiton red-620 dye doped PMMA matrix are shown in Figure 2. The absorption spectra of undoped PMMA shows two peaks among which one peak is of higher intensity (at 214 nm)

Figure 2. Common Absorption spectra of undoped and dye doped PMMA with Kiton red-620.
and another one of lower intensity (at 559 nm). The concentration of doped dye varies as 0.36 × 10⁻⁴, 1.3 × 10⁻⁴, 2.2 × 10⁻⁴, 3.0 × 10⁻⁴, 3.6 × 10⁻⁴, and 4.1 × 10⁻⁴ mol/L in the formation of PMMA based materials. It has also been observed that during the processing/curing of doped PMMA films, there is some loss of dye concentration at high temperature that affects the sharpness of UV-visible spectra. It is observed that the absorption spectra of dye doped samples show similar behavior for different concentrations. The high intensity absorption peaks have been observed at 221, 220, 216, 215, 219 and 212 nm while low intensity peaks at 565, 562, 559, 563, 565 and 554 nm for corresponding concentrations. A slight shifting of absorption peaks occurred as the dopant has been incorporated in the PMMA based materials. This shifting may be due to the change in polarity of solvents, conjugation or auxochromic groups of organic dye atoms.
3.3. Photoluminescence Study
Figure 3(a) shows fluorescence emission spectra of undoped PMMA. It has been observed from the spectra that there is no sharp emission peak in the spectra. The emission spectra of Kiton red-620 dye doped PMMA based thin plastic films have been shown in Figure 3(b). The dye doping level varies as 0.36 × 10⁻⁴, 2.2 × 10⁻⁴ and 4.1 × 10⁻⁴ mol/L. The emission peaks of fluorescence spectra have been observed at wavelengths 582, 581 and 579 which lie in the visible region (Table 1). The intensity of peaks first increases, becomes maximum and then decreases with concentration of dye. The fluorescence intensity attains its maximum at the dopant concentration of 2.2 × 10⁻⁴ mol/L. This behavior may be due to the fact that the aggregation of Kiton red-620 dye atoms/molecules in the PMMA matrix started after a certain concentration.