1. Introduction
Ferrites have been the subject of extensive study because of their wide range of application from microwave to radio frequency and of their importance in understanding the theories of magnetism. Various substitutions have been incorporated to achieve desired electrical and magnetic properties. Useful frequency range of ferrite is limited by the onset of resonance phenomenon for which either the permeability begins to fall at a critical frequency or the losses rise sharply. Hence the knowledge of the frequency dependence of the initial permeability and loss is necessary. Cu-ferrite and Cu-containing ferrites form an interesting group of ferrites because of their typical electrical and magnetic properties and change in crystal structure on thermal treatment [1]. Zn-substituted Cu-ferrites have been commercially used for many years as high-frequency devices such as radio frequency coil, transformer cores, rod antenna etc. [2]. Some physical, magnetic and transport properties of Zn substituted in ferrite has been extensively studied by different researchers [3-6]. As this parameter plays an important role in technology, therefore we aim to study the effect of Zn2+ ion substitution on the magnetic properties such as Curie temperature, complex permeability spectra and low field hysteresis loop in Cu-Zn ferrite in this communication.
2. Experimental
The Cu-Zn ferrite with composition Cu1-xZnxFe2O4 (where x = 0.0, 0.1, 0.2, 0.3, 0.4, 0.5, 0.6, 0.7) were prepared by the standard ceramic technique. The mixture of powder oxides CuO, ZnO and Fe2O4 were dried and mixed according to their molecular weight. Intimate mixing of the materials was carried out using mortar and pestle and then ball milled for 6 hours and the slurry was dried and pressed into disc shaped sample. The disc shaped samples were pre-sintered at 850˚C for 4 hours. Final sintering of the sample was carried at 950˚C for 4 hours. The structure of the sample was confirmed by the X-ray diffraction method using PHILIPS X’Pert Pro X-ray diffractometer. Curie temperature measurement was performed by using WAYNE KERR impedance analyzer with a laboratory built oven and a thermocouple based thermometer. Complex permeability spectra of the toroid shaped samples was measured with 6500 B impedance analyzer at frequency range up to 15 MHz. Low field hysteresis loops were observed by B-H loop tracer at constant frequency f = 1000 Hz at room temperature.
3. Results and Discussion
3.1. XRD Analysis
The structural study is essential for optimizing the properties needed for various applications. A typical XRD pattern indicating (hkl) values of each peaks corresponding to the sample x = 0.1 of Cu1-xZnxFe2O4 is shown in Figure 1. The XRD pattern of the sample, showing welldefined reflection without any ambignity, exhibits the formation of single phase cubic spinel structure. Using XRD data, the lattice constant was determined by the Nelson-Riley extrapolation method [7]. The variation of the lattice constant “a” as a function of Zn content is shown in Table 1 which is found to increase linearly with increasing Zn content obeying Vegard’s law [8]. This increase in the lattice constant can be attributed to the ionic size difference as substituted by large ionic size Zn2+ (0.82 Å) with that of Cu2+ ions (0.73 Å) [9]. A similar linear variation has been observed in Zn-Mg [10], Li-Cd [11] and Cd-Zn [12]. Our experimental value of lattice constant of the Cu-ferrite is 8.365 Å which is near to the literature value of 8.380 Å [13].
3.2. Curie Temperature Measurement
High initial permeability is often a technological requirement of a ferrite at relatively low frequencies. The thermal variation of initial permeability, μi is shown in Figure 2 to find out the Curie temperature (Tc) for Cu-Zn ferrite samples in shape of toroid. In general, it was found that the initial permeability increases with increase in temperature, while it falls abruptly close to the Curie point. The sharpness of the permeability drop at the Curie point can be a measure of the homogeneity according to Globus et al. [14]. The present ferrites show good homogeneity as shown in Figure 2 where an abrupt drop
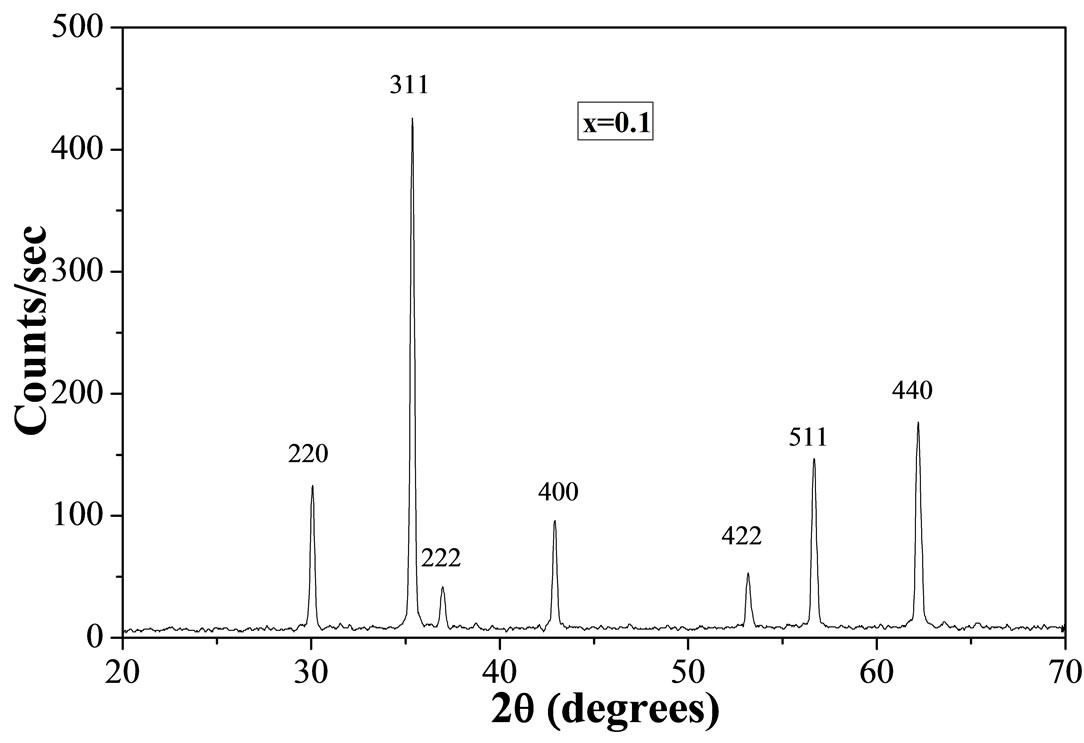
Figure 1. Typical XRD pattern of Cu1-xZnxFe2O4 for x = 0.1.
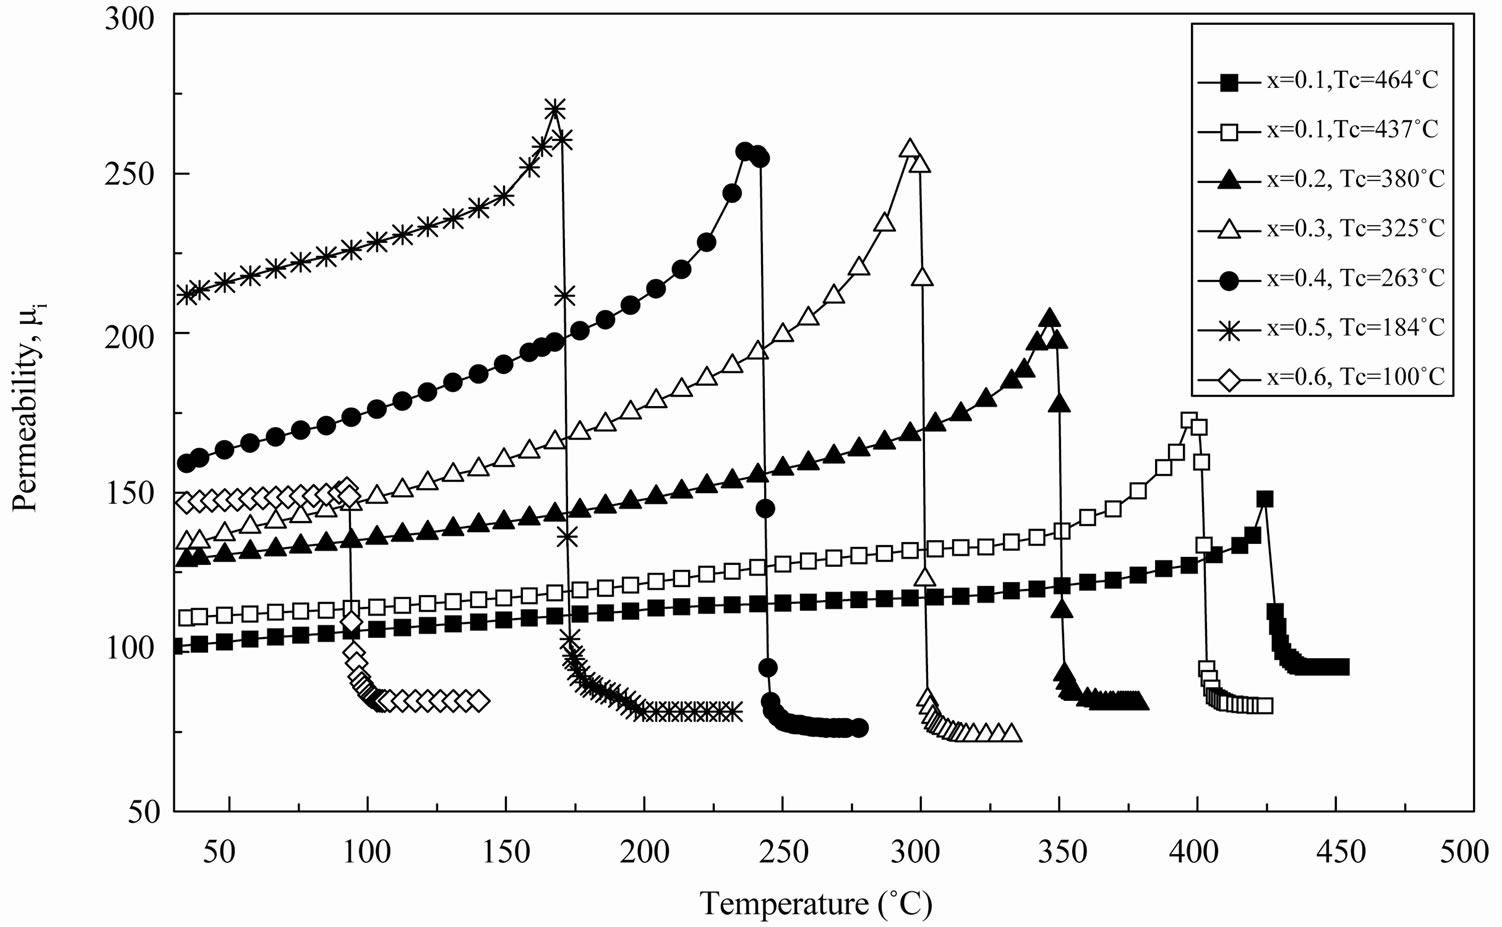
Figure 2. Initial permeability as a function of temperature.
in permeability occurs near the Curie point.
The variation of μi with temperature can be expressed as follows by Globus equation  where K1 is anisotropy constant, Ms is saturation magnetization and D is the average grain diameter. The K1 and Ms usually decrease with increase of temperature which disturbs the alignment of magnetic moments. But decrease in K1 with temperature is faster than that of Ms. When K1 reaches zero, μi attains its maximum value according to the Globus equation and then drops off a minimum near the Curie point. It is clearly seen that the curves show maximum μi just below Tc and sharp decrease in μi is fol lowed as the temperature is increased beyond Tc. Similar phenomena were observed in Li-Cu [15], Cu-Zn [16] and Mg-Cu-Zn [17]. Curie temperature, Tc of the sample with x = 0.7 has been determined from the temperature dependence of magnetization with an applied field 50 Oe using SQUID magnetometer since it is paramagnetic at room temperature (30˚C). Tc of this sample has been taken as sharp fall of magnetization and was found 20˚C. This type of magnetic behaviour with high content of non-magnetic such as Zn and Cd is generally observed in Ni, Li and Mg based ferrites [18,19].
The Curie temperature of a ferrite is a temperature at which the material becomes paramagnetic. Curie temperatures, Tc of the studied ferrite system has been determined from the mi-T curves where Hopkinson type of effect at the Tc has been observed with the menifestation of sharp fall of permeability. From Table 1, a deceasing trend is observed with increasing Zn content. The linear decrease of Tc with increasing Zn content may be explained by modification of the A-B exchange interaction strength due to the change of the cation distribution between A and B sites when non-magnetic Zn is substituted for Cu. Our experimental value of Tc for the Cu-ferrite is 470˚C which is in good agreement with the literature value of 455˚C [20].
3.3. Complex Permeability Spectra
Figures 3(a) and (b) show real (μ′) and imaginary (μ′′) parts of the complex permeability in the range 1 kHz to 15 MHz, μ = μ′ – jμ′′ of different composition sintered at 950˚C for 4 hr. Figure 3(a) shows for real part of initial permeability flat profile from 1 kHz to 15 MHz for the Zn content of x = 0.0 - 0.3. For the compositions x = 0.4 to 0.7, μ′ is constant up to 9 MHz beyond which it falls slightly. The decrease of permeability implies onset of ferromagnetic resonance [21]. The fairly constant μ′ values over a large frequency range show the compositional stability and quality of the ferrites prepared by solid state reaction. This is a desirable characterization for various applications such as broadband pulse transformers and wide band read-write heads for video recording.
In general, it is observed that the initial permeability remains almost constant up to certain lower range of frequency after which the initial permeability increases to a maximum value and then decreases slightly to a very low value. This phenomenon, known as dispersion of initial permeability, is attributed to either domain wall displacements or domain rotation or both of these contributions [22]. It is known that the permeability of polycrystalline ferrite can be described as the superposition of domain wall motion and spin rotation components. At the low frequency range of 10 kHz - 1 MHz, domain wall motion plays a predominant role in the magnetizing process and loss mechanism. The high permeability values at low frequencies show the dominant role played by domain wall motion. Increasing the frequency, the wall motion is damped and becomes out of phase with the excitation field. The similar phenomenon is found in Ni-Zn ferrites [23] and Li-Zn [24].
Figure 3(b) represents the imaginary part of initial permeability, μ′′ (loss component) of the samples. It is observed that μ′′ increases with increasing frequency and takes a broad maximum at a certain frequency. This feature is well known as the natural resonance. At the natural resonance, the imaginary permeability has a maximum value, shifted toward high frequency. The natural frequency of precession leads to the onset of resonance at lower frequency [25]. This leads to the onset of loss at lower frequency. The magnetic loss factor increases as

Table 1. Experimental results of Cu1-xZnxFe2O4 ferrites.
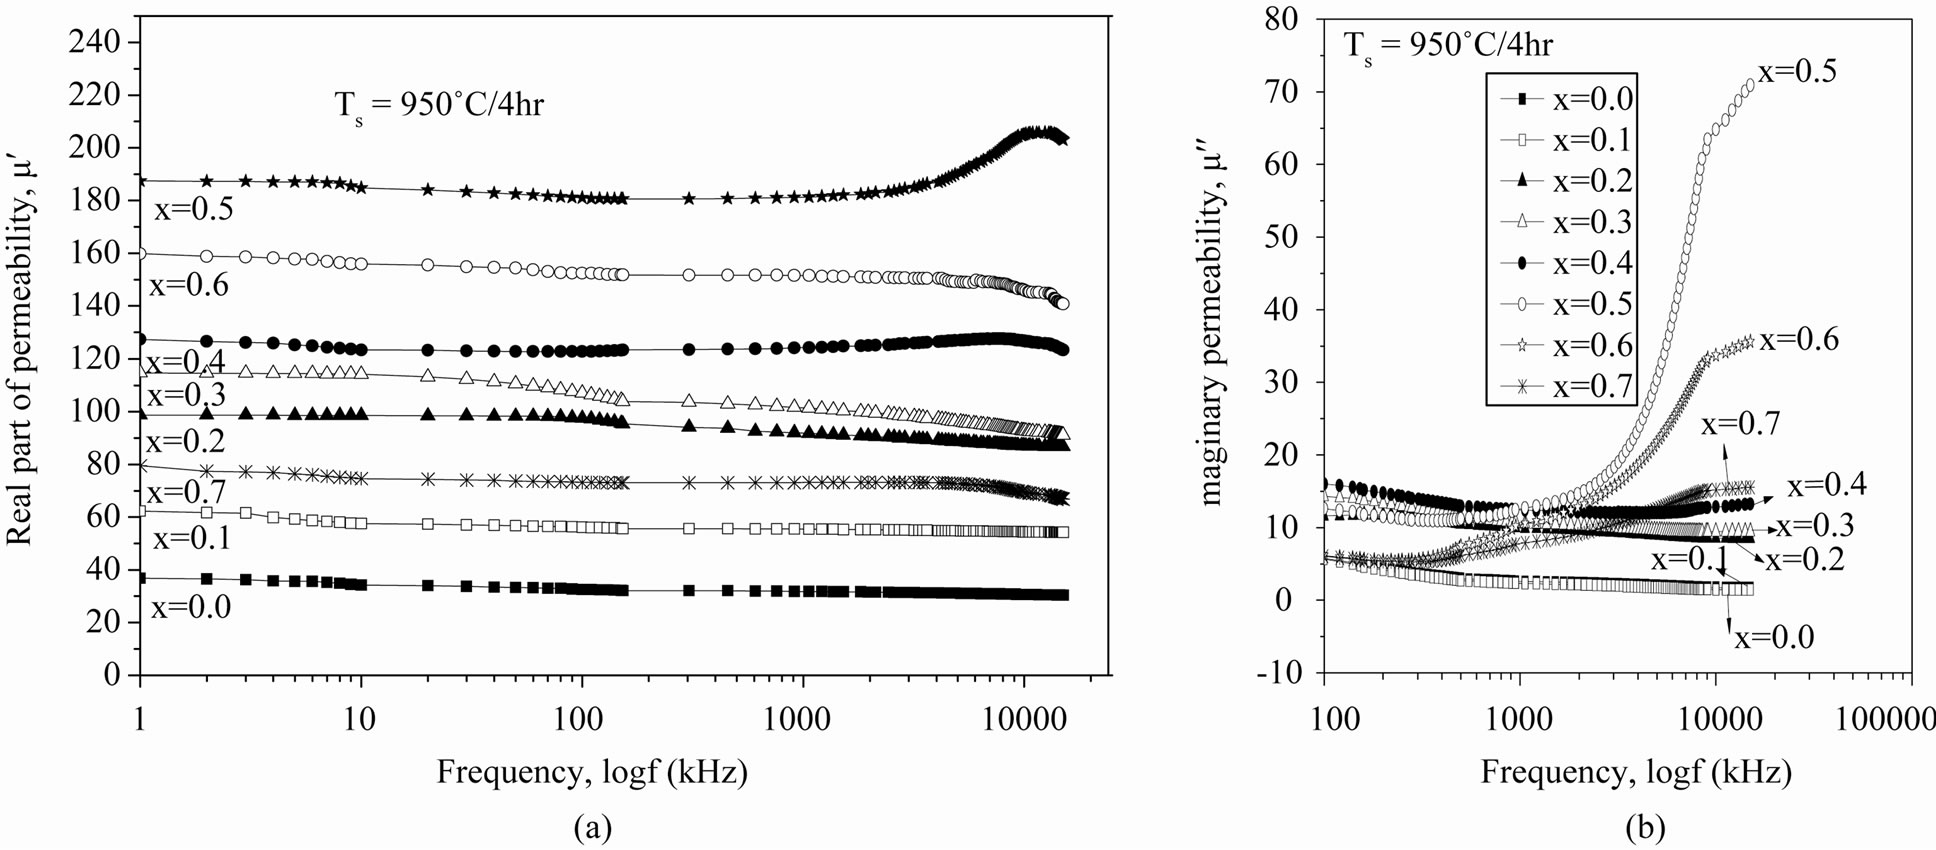
Figure 3. Variation of (a) real (b) imaginary part of the initial permeability.
the square of the frequency. Highest value of loss component of the complex permeability observes for x = 0.5 in the range of frequency under investigation.
3.4. Low Field Hysteresis Loop
The low field hysteresis loops of Cu-Zn ferrite at room temperature were measured at constant frequency of f = 1000 Hz by B-H loop tracer and presented in Figure 4. From the hysteresis curve, each loop clearly shows low coercivity, indicating that all the samples belong to the family of soft ferrites. The coercivity of magnetic material is the opposing magnetic field strength required to reduce remanent flux density, Br to zero. The retentivity or remanent flux density, Br value of magnetic material is the degree of residual magnetization when the saturation magnetic field (H) is reduced to zero. Figure 4 shows the decrease of corecivity (Hc) and hysteresis losses with Zn content. Saturation magnetic induction (Bv) and magnetic remanance (Br) increases up to x = 0.4 thereafter if decreases.
From Figure 5 it is evident that Hc is found a decreasing trend while μ′ is increasing. Hc has the highest value for x = 0.0 i.e. pure Cu-ferrite while lowest value of μ′. This behaviour can be explained by Brown’s relation [26]: Hc = 2k1/μoMs, where k1 is anisotropy constant. Again k1 is related with initial permeability (μ′) according to Globus [14] equation: μ′ = MsD/Ök1. With the increase of Zn content, the probability of Fe2+ formation decreases which is the responsible of the decrease of anisotropy and hence increase of μ′ in ferrites. Thus the decrease of Hc and increase of μ′ for Zn content indicates that k1 is dominant factor. Similar decrease of Hc was observed by Noorhana Yahya et al. in Mg-Zn ferrites [27] and by S. A. Mazen in Li-Cu ferrites [28].

Figure 4. Low field B-H loop of Cu-Zn ferrites.

Figure 5. Variation of coercivity, Hc and permeability, μ′ with composition, x.
4. Conclusion
The X-ray diffraction confirmed the single-phase cubic spinel structure of the samples. The lattice constant increases with the increase of Zn content obeying Vegard’s law. All the specimens show monotonic rise of μi with temperature and no other peak superimposed upon a general rise, as the Curie temperature is approached. This behaviour is similar to the behaviour of a single domain. The sharp decrease of μi at T = Tc indicates that the samples have high homogeneity according to Globus. The Curie temperatures show decreasing trend with the Zn substitution. Initial permeability shows good low frequency stability for the samples with x = 0.0 - 0.3 but the compositions with higher values of x ³ 0.3 obviously show relaxation resonance. Low field hysteresis loop shows a decreasing trend in corecivity and hysteresis loss with Zn contents due to increased magnetic softness.
5. Acknowledgements
The author (Shahida Akhter) is grateful to the “Bangabandhu Fellowship on Science, Information and Technology” fund of the People’s Republic of Bangladesh for granting her a Ph.D. fellowship for carrying out this work. She is also thankful to Bangladesh Atomic Energy Centre for extending experimental facilities to carry out this work.
NOTES