The histone deacetylase inhibitor trichostatin A induces cell cycle arrest and rapid upregulation of gadd45β in LS174T human colon cancer cells ()
1. INTRODUCTION
Eukaryotic transcription occurs as a result of complex interactions among a large number of proteins. Two types of chromatin modification, DNA methylation and histone post-translational modification, are essential for the recruitment of the protein complexes that regulate transcription [1]. Histone deacetylases (HDACs) are one of the prominent protein components that participate in transcriptional regulation. Eighteen human HDACs are classified into four main groups: class I (HDAC1-3, HDAC8); class II (HDAC4-7, HDAC9-10); class III (Sirt1-7); and class IV (HDAC11) [2]. HDACs are not merely catalytic enzymes; they associate with several corepressors, including Sin3 [3], SMRT, and N-CoR [4,5], and participate in transcriptional regulation. Inhibition of cellular HDACs often induces altered expression of several genes. The HDAC inhibitors induce cell cycle arrest or apoptosis in several cancer cell types, and are therefore of interest as a therapeutic agent for several malignant diseases [6,7].
The stress sensor genes of the growth arrest and DNA damage-inducible protein (gadd45) family have been implicated in various cellular stress responses that result in cell cycle arrest, DNA repair, cell survival, cell sensecence, or apoptosis [8]. Gadd45 family consists of gadd45α, gadd45β and gadd45γ. Gadd45 proteins function via a complex interplay of physical interactions with other cellular proteins, including proliferating cell nuclear antigen (PCNA), p21Waf1/Cip1, cyclinB1, p38, and the MAPK kinase kinase MEKK4. Dysregulated expression of gadd45 genes has been observed in several types of malignant diseases, including breast cancer, hepatocellular carcinoma, prostate cancer, and pancreatic cancer. Thus, it is suggested that gadd45 genes belong to a novel target class for cancer therapy [8,9]. However, the precise roles of gadd45 genes in malignant diseases remain unclear.
We previously reported that butyrate, which is an HDAC inhibitor of short-chain fatty acids, inhibits proliferation of the human colon cancer cell line LS174T by arresting the cell cycle; they also stimulate mRNA and protein production of MUC2 mucin [10]. Despite extensive research on the effects of HDAC inhibitors on cancer cells, the precise mechanisms by which HDAC inhibitors alter gene expression remain unclear. In particular, there have been few investigations of the correlation between HDAC inhibitors and gadd45 genes, especially in colon cancer cells [11]. Recently, gadd45β has been reported to be regulated by distinct stress-specific mechanisms in human RKO colorectal carcinoma cells [12]. The effects of HDAC inhibitors on gadd45 gene expression may vary in distinct cell culture conditions. Therefore, we examined the effects of the HDAC inhibitor trichostatin A (TSA), which is isolated from Streptomyces hygroscopicus [13] and inhibits class I and class II HDACs, on the time-dependent expression of gadd45 genes in the human colon cancer cell line LS174T.
We found that TSA treatment induced proliferative inhibition of LS174T cells by arresting the cell cycle at G0/G1 phase and increased gadd45β and gadd45α mRNA expression levels. The upregulation of gadd45β gene in LS174T cells was significantly increased at 15 min and peaked with a 15-fold increase 3 h after TSA treatment. The cell cycle inhibitor protein gene p21Waf1/Cip1 was also upregulated 3 h after TSA treatment. In contrast, expression of the p53 tumor suppressor gene was down-regulated 3 h after TSA treatment. These results suggest that early upregulation of gadd45β gene is an important event preceding the upregulation of p21Waf1/Cip1, down-regulation of p53, and subsequent inhibition of proliferation in TSA-treated LS174T cells.
2. MATERIALS AND METHODS
2.1. Cell Culture
The human colon adenocarcinoma line, LS174T, was purchased from the American Type Culture Collection (MD, USA). The LS174T cells were cultured in Minimum Essential Medium Eagle (MEM, Sigma Aldrich, Japan) supplemented with 10% fetal bovine serum (FBS, Cansera International, Canada), 1% non-essential amino acids (Invitrogen, USA), 100 U/ml penicillin (Gibco Oriental, Japan) and 100 μg/ml streptomycin (Gibco Oriental, Japan) in a 5% CO2 incubator. The adherent cells were subcultured every 3 - 4 days by treatment with a trypsinEDTA solution (Gibco Oriental, Japan).
2.2. Cell Proliferation Assay
LS174T cells were suspended in the culture medium using a syringe with an attached 26G needle to make a single-cell suspension before counting number. The cells (1 × 10⁴ in 0.1 ml) were precultured in a 96-well plate (Sumilon, Japan) overnight to allow them to adhere. Subsequently, various concentration of TSA (0 - 2.5 μM, Cayman Chemical, MI, USA) dissolved in dimethyl sulfoxide (DMSO, final 0.01%) was added to the wells in triplicate. The cells were cultured for additional 24 h. After the medium was removed, cells were incubated for 3 h with 0.1 ml of new medium containing 10 μl of the reagent of Cell Counting Kit-8 (Dojin, Japan). Absorbance at 450 nm was measured by a Microplate reader Model 550 (Bio-Rad, Japan).
2.3. Detection of Acetylated Histone
LS174T cells (1 × 10⁵ cells/ml) were precultured overnight and treated with 1 μM TSA for additional 24 h. The treated cells were lysed with standard SDS sample buffers. The sample proteins were separated on a 12.5% SDSpolyacrylamide gel by electrophoresis. Protein bands were then blotted onto a nitrocellulose membrane (Hybond ECL, Amersham Pharmacia Biotech, USA) by standard western blotting methods. Histone H1 and acetylated histone H3 were detected with a rabbit anti-histone H1 antibody (Santa Cruz FL-219, USA) and a rabbit antiacetylated-histone H3 antibody (Upstate #06-599, USA), respectively and an appropriate anti-rabbit IgG antibody conjugated with horseradish peroxidase (Promega W4011, USA). The enzyme reaction was detected by the previously reported method [10], using an ECL Western Blotting Detection Reagent (Amersham Pharmacia Biotech, UK) and a LAS-1000 Plus image analyzer (Fujifilm, Japan).
2.4. Flow Cytometry for Cell-Cycle Analysis
Cell-cycles were analyzed by the previously reported method [10]. Briefly, LS174T cells (5 × 10⁵ cells/ml) were precultured in complete medium (10% FBS) overnight, and then starved in incomplete medium (0.5% FBS) for 2 days. The cells were again cultured in complete medium supplemented with 1 μM TSA for additional 24 h. Cell nuclei were collected from the cells by treatment with 0.1% Triton X-100 and RNase A, and stained with propidium iodide. The stained nuclei were analyzed using a FACSCalibur flow cytometer with CellQuest software (Becton Dickinson, USA). For each sample, data were obtained through two gates, FSC vs SSC and FL2W vs. FL2A, to exclude emission of doublet nuclei. At least 10,000 nuclei were counted for each sample.
2.5. Detection of Apoptosis
LS174T cells (1 × 10⁵ cells/ml) were precultured overnight and treated with 1 μM TSA for additional 16 h. The apoptotic rate of treated cells was analyzed by a flow cytometer with a TACS Annexin V Biotin Apoptosis Detection Kit (Trevigen, USA) according to the manufacturer’s instructions. In another experiment, LS174T cells treated with 1 μM TSA for 24 h were fixed with 10% formalin, and stained with Hoechst 33,342 fluorescent dye (10 μg/ml, Invitrogen, USA). The stained cells were observed under a fluorescence microscope, BX51 (Olympus, Japan), with excitation at 365 nm and emission at 400 nm.
2.6. RT-PCR
Quantitative RT-PCR was performed by the previously reported method [10,14]. Briefly, cellular RNA was extracted from LS174T cells using a TRIzol reagent (Invitrogen, Japan). Total RNA concentrations were determined using a NanoDrop ND-1000 spectrophotometer (NanoDrop, USA). mRNA levels were measured using a real-time PCR LightCycler System V3 (Roche Molecular Biochemicals, Germany) and a QuantiTect SYBR Green RT-PCR kit (Qiagen, Japan). After one cycle of reverse transcription at 50˚C for 20 min and initial activation at 95˚C for 15 min, 45 cycles of PCR were performed with each cycle of 94˚C for 15 sec, 61˚C for 30 sec, and 72˚C for 45 sec. The PCR primers used are shown in Table 1. The identity of the PCR products was confirmed by nucleotide sequencing that was performed in the Biotechnology Center of Akita Prefectural University.
2.7. Enzyme Activity Assay of HDAC
The template is used to format your paper and style the text. All margins, column widths, line spaces, and text Nuclear fraction was separated from LS174T cells treated with 1 μM TSA for 24 h using a Nuclear Extraction Kit (Chemicon International, USA). After protein concentration was adjusted, enzyme activity of HDAC was measured with a HDAC Colorimetric Assay/Drug Discovery Kit (Biomol International, USA) according to the manufacturer’s instructions. Absorbance at 405 nm was measured by a microplate reader Model 550.
2.8. Statistics
Statistical significance was estimated by an unpaired Student’s t-test. The mean fold increases (average ± SD)

Table 1. The list and all sequences of primers used for PCR analysis.
against the each control are shown. Asterisks show the statistical probability, †p < 0.05 and **p < 0.001.
3. RESULTS
3.1. TSA Induces Proliferative Inhibition of LS174T Cells by Cell Cycle Arrest
The HDAC inhibitor TSA induces cell cycle arrest or apoptosis in several cancer cells. We examined the effects of TSA on the proliferation of LS174T cells. The cells were treated with various concentrations of TSA for 24 h. Cell proliferation was inhibited by TSA in a dosedependent manner, and almost ceased with 1 μM TSA (Figure 1). The cells treated with 1 μM TSA for 24 h showed accumulation of the acetylated histone H3, suggesting that TSA inhibited HDAC enzyme activity in the treated cells (Figure 2). Next, we measured the total HDAC enzyme activity in the nuclear fraction separated from the TSA-treated LS174T cells. The enzyme activity was reduced to 40.8% in the treated cells (Figure 3(a)). We then examined mRNA levels of the typical class I HDACs in the treated cells, namely HDAC1, HDAC2, and HDAC3. The HDAC2 mRNA level was signifycantly reduced, but no large difference in HDAC1 or HDAC3 mRNA levels was detected (Figure 3(b)). The downregulation of HDAC2 seemed to be preferentially induced in the TSA-treated LS174T cells.
Flow cytometry showed that the proportion of G0/G1 phase cells was increased in the TSA-treated cells (Figure 4(a)). Early apoptosis detected by the binding of annexin V was also induced in the LS174T cells treated with 1 μM TSA for 16 h (Figure 4(b)). Hoechst staining of the nuclei confirmed the phenomenon where only some cells were apoptotic and a substantial number of

Figure 1. Inhibition of LS174T cell proliferation with TSA treatment. Cells were treated in triplicate with various concentration of TSA for 24 h. Cell proliferation was measured by the Cell Counting Kit-8 with absorbance at 450 nm.

Figure 2. Accumulation of acetylatedhistone H3 in TSA treated LS174T cells. Cells were treated in triplicate with or without 1 μM TSA for 24 h. Cell proteins were separated and analyzed by standard western blotting methods. Histone H1 and acetylated histone H3 were detected with an anti-histone H1 antibody and an antiacetylated-histone H3 antibody, respectively. The mean fold increases of acetylated-histone H3/histone H1 are shown.

Figure 3. TSA effects on enzyme activity and mRNA level of HDACs in LS174T cells. (a) Cells were treated with or without 1 μM TSA for 24 h. Nuclear fraction was separated from the cells treated with TSA. Total enzyme activity of HDAC in nuclear fraction was measured with a commercial kit. Five samples were used in each treatment; (b) Cells were treated with or without 1 μM TSA for 24 h. mRNA levels of HDAC1, HDAC2 and HDAC3 were determined by RT-PCR. Eight samples were used in each TSA treated and no treated control.
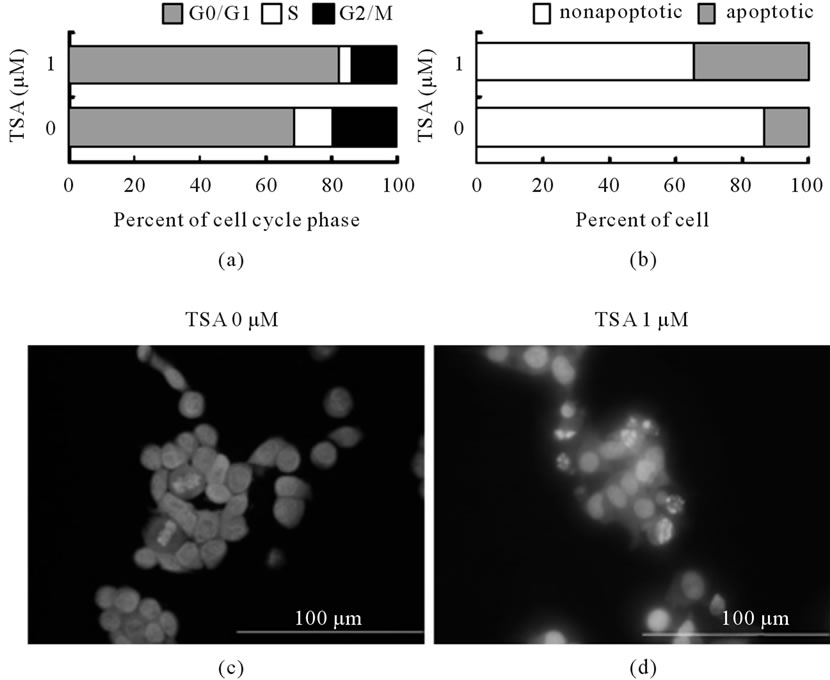
Figure 4. TSA effects on cell cycle and apoptosis in LS174T cells. (a) Cells were starved in incomplete medium, and then cultured in complete medium with 1 μM TSA for 24 h. Cell nuclei were collected, and stained with propidium iodide. The stained nuclei were analyzed by flow cytometry. Ratios of G0/G1 (grey), S (white) and G2/M (black) phases are shown; (b) Cells were treated with 1 μM TSA for 16 h. Apoptotic cells were analyzed by flow cytometry using an annexin V binding kit. Ratios of early apoptotic (grey) and viable (white) cells are shown; (c) Cells treated with 1 μM TSA for 24 h were fixed, and stained with Hoechst 33,342. Photographs were taken by fluorescence microscopy with ×400 magnification.
cells were nonapoptotic. Fragmentation of the nucleus was observed in treated cells, but many cells remained unfragmented after 24 h of TSA treatment (Figures 4(c), (d)). Therefore, a certain level of apoptosis was induced by TSA treatment, but the inhibition of the proliferation of LS174T cells induced by 1 μM TSA for 24 h was mainly due to cell cycle arrest at the G0/G1 phase.
3.2. TSA Induces Gadd45β and Gadd45α mRNA Expressions in LS174T Cells
Whether HDAC inhibitors affect the expression of gadd45 genes or not is an interesting question. We examined the time-dependent changes in gadd45 mRNA levels in LS174T cells treated with 1 μM TSA. Gadd45α mRNA was upregulated twoor three-fold after 3 h of TSA treatment (Figure 5(a)). A marked change in gadd45β mRNA expression was also observed. Upregulation of gadd45β mRNA expression was detected at 15 min, reaching an approximate 15-fold increase 3 h after TSA treatment (Figure 5(b)). The gadd45γ mRNA level was not changed during treatment, except for a slight increase at 24 h (Figure 5(c)). These results suggest that one of the characteristic effects of TSA may be early upregulation of gadd45β gene in LS174T cells.
3.3. TSA Modulates the Expression of Cell Cycle-Related Genes in LS174T Cells
The most common effect of TSA on cancer cells is the upregulation of p21Waf1/Cip1. p21Waf1/Cip1 expression is usually regulated by p53, which binds to the p21Waf1/Cip1 promoter. We examined the time-dependent effect of TSA on the expression of cell cycle-related genes in LS174T cells. Induction of p21Waf1/Cip1 mRNA was observed after 3 - 24 h in the TSA-treated cells. The p21Waf1/Cip1 mRNA level was increased more than threefold after 6 h (Figure 6(a)). However, the p53 mRNA level was decreased after 3 h in the TSA-treated cells (Figure 6(b)), suggesting p53-independent upregulation of p21Waf1/Cip1. The cyclin D1 mRNA level was also decreased after 3 h (Figure 6(c)). The proto-oncogene cMyc is overexpressed in many cancer cells, including colon carcinomas [15] and is critical for switching the p53- dependent response from cell cycle arrest to apoptosis [16]. Therefore, we examined time-dependent changes in c-Myc mRNA expression in TSA-treated LS174T cells. The c-Myc mRNA level was decreased after 1 h of TSA
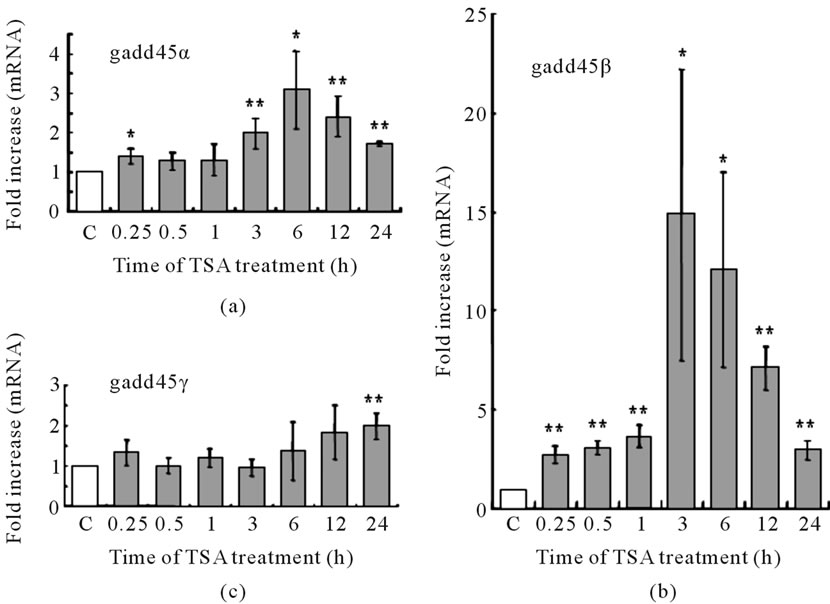
Figure 5. Time dependent mRNA levels of gadd45 family in TSA treated LS174T cells. Cells were treated with or without 1 μM TSA for indicated time. Six samples were used in both TSA treated and no treated control (C) at each time point. mRNA levels of (a) gadd45α; (b) gadd45β and (c) gadd45γ were determined by RT-PCR.
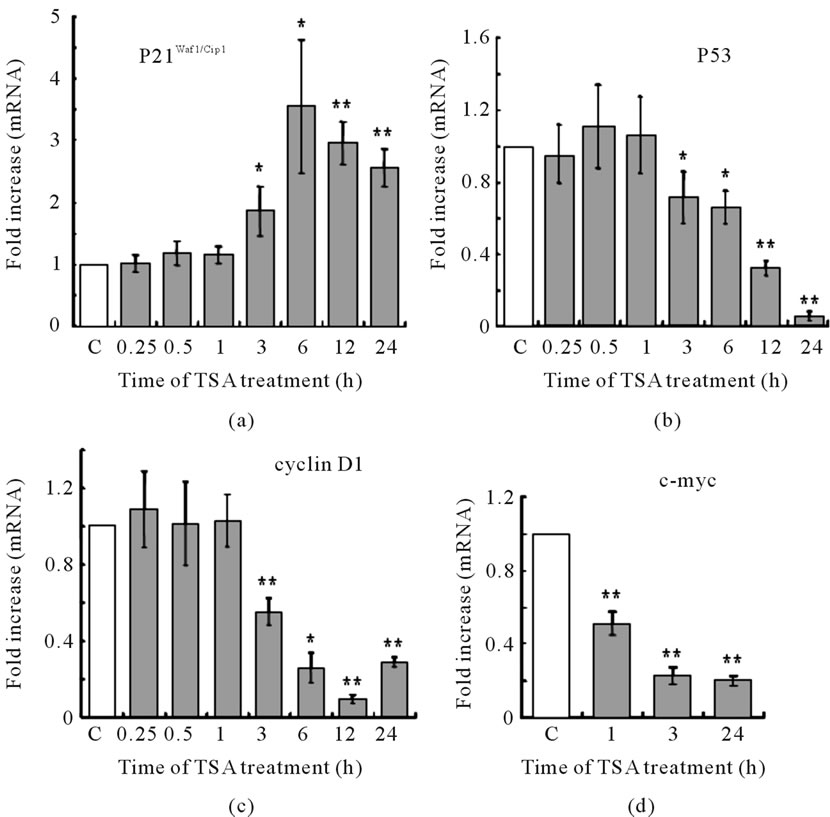
Figure 6. Time dependent effects of TSA on mRNA levels of some genes in LS174T cells. Cells were treated with or without 1 μM TSA for indicated time. Six or five samples were used in both TSA treated and no treated control (C) at each time point. mRNA levels of (a) p21Waf1/Cip1; (b) p53; (c) Cyclin D1 and (d) c-myc were determined by RT-PCR.
treatment (Figure 6(d)).
4. DISCUSSION
The most common effect of TSA on cancer cells is the Two theories have been proposed regarding p53 transcriptional activity in response to stress. One is the prebinding event theory that states that stress inducesp53 binding only to genes that need to be regulated. Another is the post-binding event theory that states that p53 binds most of its response elements and that post-binding events operate as filters to allow transcription of specific genes. Millau et al. have recently shown that the preand postbinding events act together to regulate adapted stress responses [17]. It has been reported that TSA causes p53 to switch oxidative-damaged cells from cell cycle arrest to apoptosis and promotes p21Waf1/Cip1 mRNA expression in HCT116 p53+/+ colorectal cancer cells [18]. Another report concerning p21Waf1/Cip1 expression has indicated that a novel zinc finger protein, Zac1, which acts as a transcriptional cofactor for p53, functions synergistically with p53 or TSA to enhance p21Waf1/Cip1 promoter activity by physically interacting with nuclear receptor corepressors in HeLa cells, suggesting that TSA-induced p21Waf1/Cip1 expression might be mediated through a p53- independent pathway [19-22].
HDAC inhibitors can induce cell cycle arrest or apoptosis in many cancer cells [6]. Inhibition of proliferation of LS174T cells was effectively induced by 24 h treatment with 1 μM TSA in our experiments. The inhibition was mainly due to cell cycle arrest and not apoptosis. LS174T cells are known to have functional wild-type p53 and mutated BAX genes [23] and may therefore be resistant to apoptosis induced by TSA. In our experiments, upregulation of p21Waf1/Cip1 expression was observed after 3 h of TSA treatment. However, p53 expression was downregulated after 3 h. These results suggest that the upregulation of p21Waf1/Cip1 is independent of p53 in LS174T cells (Figure 6). However, there still remains the possibility that both p53-independent and p53-dependent pathway are involved. To show more clearly, that the p21 is increased p53-independently, we must investigate the stability of the p53 protein. The stability of p53 is regulated by the oncoprotein Mdm2, which mediates p53 ubiquitylation and degradation [24]. In future work, we will investigate Mdm2 activity and the turnover rate and stability of p53 in TSA treated cells.
The gadd45 genes Gadd45 protein has been reported to physically interact with p21 protein and inhibits cell proliferation [25]. Our results, that the early upregulation of gadd45β gene precedes the upregulation of p21Waf1/Cip1, suggest that gadd45β induces the upregulation of p21 protein and cell cycle arrest (Figures 5(b), 6(a)).
We also found that the c-Myc mRNA level was downregulated after at least 1 h of TSA treatment. At that time, p21Waf1/Cip1 mRNA expression was not yet upregulated, although gadd45β mRNA expression was upregulated after 15 min of TSA treatment. We speculate that c-Myc downregulation may be involved in the p21Waf1/Cip1 upregulation induced by HDAC inhibition in LS174T cells. The c-Myc is highly expressed in many types of cancers [15,26]. The strong downregulation of c-Myc by TSA treatment suggests that TSA might useful for cancer therapy by c-Myc downregulation (Figure 6(d)).
The gadd45 family of stress sensor genes is implicated in various cellular stress responses that result in cell cycle arrest, cell survival, cell senescence, or apoptosis. Gadd45 proteins physically interact with some cell cycle-related proteins, including p21Waf1/Cip1; however, their detailed functioning, especially that of gadd45β remains unknown [8,9]. We found that gadd45β mRNA expression was upregulated after 15 min of TSA treatment and was increased approximately 15-fold at 3 h in LS174T cells. The TSA-induced modulation of gadd45β mRNA expression preceded the upregulation of p21Waf1/Cip1 and the downregulation of p53. These results suggest that the early upregulation of gadd45β gene is an important event in response to stress and that an interesting relationship exist between TSA and gadd45β.
These findings should encourage further studies of the precise mechanisms by which HDAC inhibitors alter gadd45 genes and the precise roles of gadd45 genes in malignant diseases.
5. ACKNOWLEDGEMENTS
This work was supported in part by a grant from the President-Sponsored Research Projects of Akita Prefectural University. We thank the staff of the Biotechnology Center in Akita Prefectural University for their help in DNA sequence analysis. We thank Professor Hiroetsu Wabiko of Akita Prefectural University for helpful discussions.
NOTES
#Corresponding author.