1. INTRODUCTION
The natural biopolymers, chitin and chitosan, are made up of β(1,4)-glycosidic linked 2-amino-2-deoxy-β-D-glucose and 2-acetamino-2-deoxy-β-D-glucose residue [1]. Depending on the degree of acetylation, each chitin/chitosan has the specific effectiveness. Chitin and chitosan have been applied in many biomedical applications [2] because of these substances are biodegradable and biocompatible [3-7].
However, there have to be some considerations for biomedical applications of chitin and chitosan such as the solvent systems of chitin and in vivo degradability of chitosan. Chitin can dissolve only in strong solvent systems and may be harmful to human if it is used in medical applications. Chitosan can easily dissolve in the dilute organic acid condition that is a reliable solvent for medical applications in human [8]. Moreover, one of the considerations on the chitosan and chitin in the biomedical application is degradation of those materials such as film, membrane, fiber and scaffold being used in human body. Degradation is concerned with enzymes in our body, which degrades these chitinous materials into small molecules of residues. Lysozyme is one of enzymes present in the human body that can hydrolyze the β(1-4) linkages between N-acetylglucosamine and glucosamine in chitosan and chitin according to the distribution of N-acetyl group [9,10]. Many researchers have reported the degradation of chitosan and chitin by lysozyme [9,11-16]. This enzyme has more degradation activity on chitin than chitosan because chitin has more N-acetyl glucosamine residues. Most of the studies determined the degradation of chitin and chitosan by study on the reducing sugar unit in the degradation medium, the molecular weight of hydrolysates in the degradation medium and the weight loss of chitin and chitosan [9,17,18]. However it has not been studied yet on the optimal conditions of the degradation of specific degree of acetylation of chitosan scaffold by lysozyme in vitro. Based on the above mentioned factors, the transferring of chitosan to N-acetylated chitosan (N-CTS) might be better solution for the medical application of these materials through consideration on safety. Moreover re-acetylated chitosan can also be easily degraded by lysozyme on the β(1-4) linkage of N-acetyl glucosamine.
There have been several studied reports for N-CTS using acetic anhydride as an acetylation agent [19-23]. In this study, N-CTS has been carried out with different methods to select the best method for the preparation of different DA% of N-CTS under the mild conditions and for the preparation of N-CTS scaffold with wide range of DA%. The characteristics of prepared scaffolds such as morphology of scaffold, stability of scaffold and water absorption properties were studied. Moreover, the N-CTS with highly re-acetylated scaffold was selected and studied the best conditions for the in vitro degradation of lysozyme on the N-CTS scaffold such as the degradation medium, pH, temperature, shaking (rpm), time of degradation and lysozyme concentration. Based on these results, the possible applications of scaffold are proposed.
2. MATERIAL AND METHODS
Crab chitosan (DA 18.7%) was obtained from Koyo Chemical Co., Ltd. and other materials were of analytical grade purchased from Wako Co., Ltd., Japan. The number average molecular weight (Mn) of original CTS was re-measured by GPC method.
2.1. Methods of Acetylation of Chitosan
Chitosan was acetylated by four different methods: method A, reported by Hirano et al., 1976; method B, modified the method A by Molly. S. S. et al., 2005; and method C and D, modificated from published methods in this research [21-23] (Table 1).
Method C: The chitosan solution was reacted with acetic anhydride for overnight. The reacted solution of method C1 was dialyzed with distilled water until neutral pH and lyophilized. The precipitate of method C2 and C3 were collected by centrifugation, washed with 70% acetone for three times and with distilled water up to neutral pH and then lyophilzed.
Method D: Chitosan solution was adjusted to pH 6.5 with 20% NaOH. Then acetic anhydride was added for N-acetylation at 15˚C for 4 h. The viscosity of the solutions obtained from every step was measured by using HAAKE RheoStress 600 Rheometer, carried out at 25˚C and average shear viscosity was taken from three replicates of each sample. Finally acetylated chitosan gel solution was incubated at room temperature for over night under stirring condition and then dialyzed until pH 6.5 ~ 7 and then lyophilized. After lyophilization, the N-CTS scaffolds were obtained. All N-CTS samples were weighted after lyophilization and stored for further analysis. Each experiment was carried out three replicates (n = 3).
2.2. Observation the Morphology of N-CTS Scaffold
The dried scaffold was sliced into rectangular shape (dimension = 0.9 × 0.6 × 0.2 cm3) in surface and crosssection areas and then the sample was coated with thin layer of platinum, using a JOLE JFC-1500 sputtering device. The surface and cross-section morphology of sample was observed by using a FE-SEM JEOL JSM- 6700 scanning electron microscope with an accelerating voltage of 5 kV, 10 µA. The diameter of pores of scaffold was measured by using the JEOL-Images software. The number of pores determined on each sample was ten and the values are expressed as mean value of the diameter of 10 pores.
2.3. Study the Water Absorption Properties of the N-CTS Scaffold
The water absorption properties of the N-CTS scaffold were performed by soaking the scaffold in each buffer solution; citric buffer CIT, acetate buffer ACE, phosphate buffer PBS at pH 4.5 and 7.4. The experiment was carried out at 37˚C and 25˚C. After 48 h incubation, percentage water absorption of scaffold (Eaw) was calculated as follows Equation (1); the adsorbed buffer solution on surface of scaffold was blotted with tissue paper and the weight of the scaffold was recorded as (W1). The initial weight of dried scaffold was recorded as (W0).
 (1)
(1)

Table 1. Preparation conditions for N-acetylation of chitosan.
2.4. Study the in Vitro Degradation of the N-CTS Scaffolds by Lysozyme under Different Conditions
The eight pieces of N-CTS scaffold (50 mg (W0), one piece = (0.6 - 0.7) × (0.6 - 0.7) × (1 - 1.2) cm3) were placed in each buffer solution and incubated under different conditions. The condition of highest degradation rate on scaffold was selected to study other conditions. After degradation with lysozyme, the solution was filtered to remove the undigested scaffold pieces and collected the filtrate and then incubated in a water-bath at 95˚C for 30 min to precipitate lysozyme. The reducing sugar content in the filtrate was measured by Dygert method [24]. The amount of reducing sugar was determined by using a UV spectrophotometer (U-2010, Hitachi, Japan) and calculated using standard curve of OD 450 nm vs glucose concentration. The undigested amount of N-CTS scaffold on the filter paper was dried at 105˚C for 24 h and recorded the dried weight as (W1). The weight loss (%) of sample was determined using Equation (2). Each experiment was carried out three independent replicates.
 (2)
(2)
To separate between the lysozyme degradation and dissolution of scaffold, control samples (without addition of lysozyme) were carried out as the same procedure described above.
2.5. Determination of Degree of Acetylation
2.5.1. Infrared Spectrometry
Each sample 2 mg was weighted and mechanically wellblended with KBr (98 mg) and then prepared a disc [25]. IR spectrum was recorded with a Shimadzu FT-IR-2100 (Perkin-Elmer) spectrometer. The percent of the N-acetyl-glucosamine content in the sample was determined according to the Equation (3).
 (3)
(3)
2.5.2. PUV Spectrophotometry
The DA of the N-CTS was measured by phosphoric acid ultraviolet (PUV) spectrometric analysis that was developed by Hsiao et al. and slightly modified by Hein et al. [26,27].
3. RESULTS AND DISCUSSION
3.1. Acetylation of Chitosan by Different Methods
The acetylated chitosan was prepared using crab chitosan with 4 different methods (A, B, C and D). After acetylation, the most acetylated chitosan from different methods was observed as powder form but some methods provided as scaffold form, that might be due to the nature of reacted solution (Tables 2 and 3). In method B, C2 and C3, the precipitate was obtained as soon as after completion
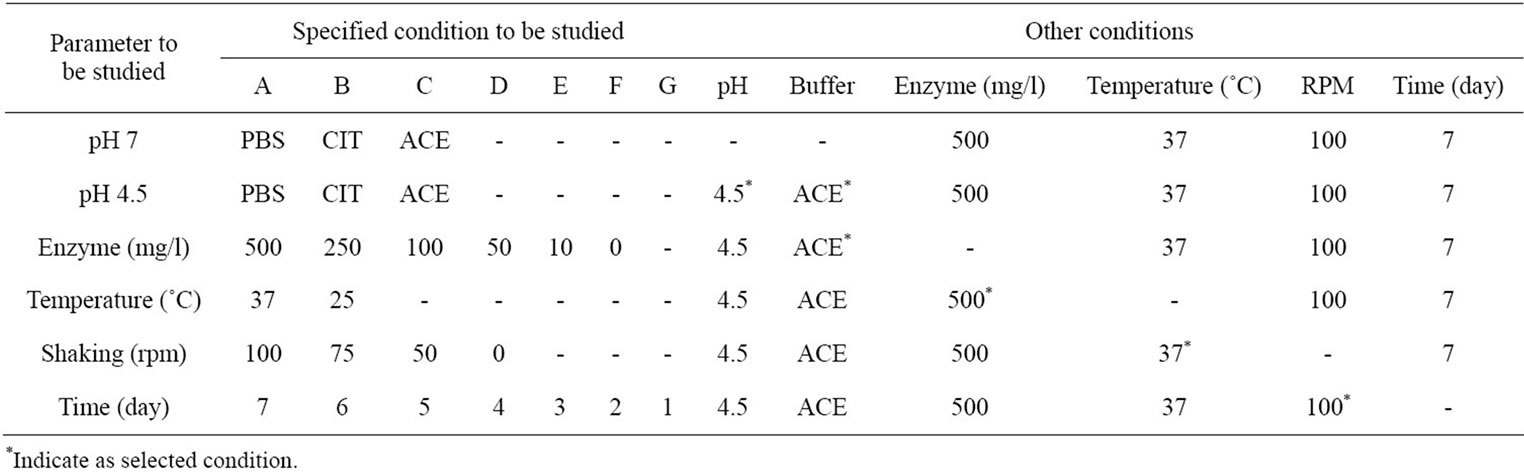
Table 2. The specific and other conditions of lysozyme degradation on N-CTS scaffold.
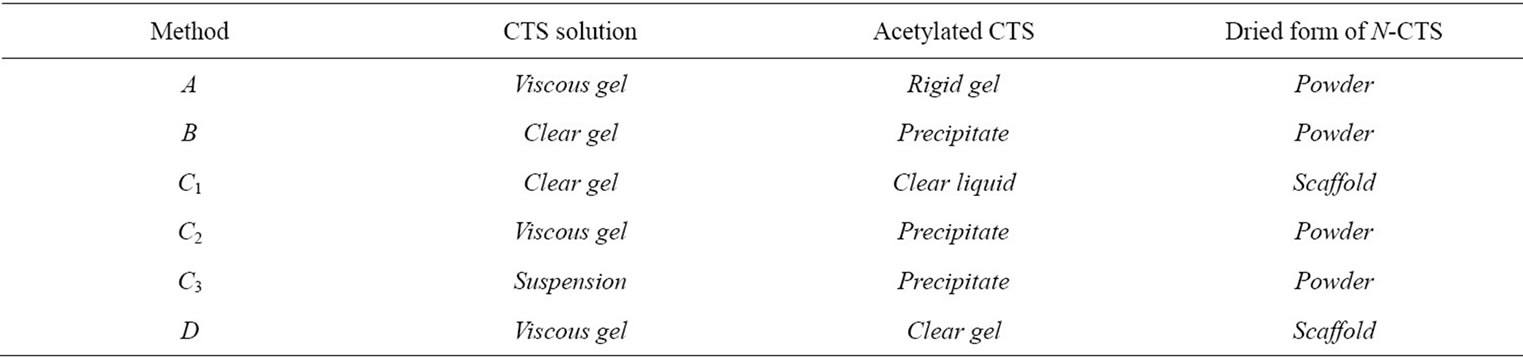
Table 3. Condition of chitosan solution and N-CTS form.
of acetylation reaction. So that these methods did not support the resultant N-CTS to fabricate as scaffold form. It can be assumed that the acetyl group of acetic anhydride were substituted to amino groups ( ) of chitosan molecules, then it will not become the ionic form of amine in the chitosan molecules. Method C1 and D were given the gel form of N-acetylated chitosan. However, the viscosities of two gel types were different in each chitosan solution.
Due to increase both chain dimensions and inter-chain repulsion through protonation of the amine groups, it has observed that the gel formation of chitosan solution at pH 6.5 before acetylation was higher than that of pH 4. The gel viscosity was slightly reduced after the acetylation. It was depended on the substitution of acetyl group to the chitosan molecules. Although the addition of amount of acetic anhydride and pH of reacted solution are the same, when the temperature is different, the substitutions of acetyl group are also different. While the acetylation reaction was happening, the increasing temperature was related to the addition of amount of acetic anyhydride, when the starting temperature is same. Normally the acetylation reaction was completed about one hour after addition of acetic anhydride to the chitosan solution. After acetylation, the resultant samples were lyophilized and observed as scaffold and powder forms. All acetylated samples increased weight (%) remarkably. However the increased weight of the N-CTS in each method was varied probably due to the variable substitution of acetyl group to the amino group of chitosan molecules.
The number average molecular weight (Mn) of acetylated CTS was increased about to 3.9 × 10⁵ Da from that of original CTS 1.67 × 10⁵ Da.
3.2. Determination of Solubiliy and Degree of Acetylation of the N-CTS in Powder and Scaffold Form
The resulted N-CTS samples were firstly checked their solubility in one of the chitin solvents, saturated CaCl2·2H2O: MeOH solution and one of chitosan solvents 2% HOAc solution at ambient temperature [28]. All samples were dissolved in CaCl2·2H2O: MeOH solution with time according to the degree of N-acetylation (i.e., the highest DA of sample was the fastest soluble in this solvent and longer time for lower DA of chitosan). However all samples were not dissolved in 2% HOAc solution. These tests give the preliminary results of substitution of Nacetyl group in CTS molecules (data are not shown). In order to confirm the N-acetylation in chitosan molecules, N-CTS powder and scaffolds were treated with 1M NaOH or 95% EtOH for one day and washed with water upto neutral pH. After that the samples were dissolved in 2% HOAc and all scaffold samples were decomposed in 2% HOAc. Form this observation; it was proposed that the substitution of acetyl groups in chitosan molecules of scaffold may be caused by unstable ionic bond or other molecular interaction.
To investigate the percentage degree of acetylation of N-CTSs, IR and PUV methods were used and the results were shown in Table 4.
The DA of chitosan values are determined by these two methods which showed a little different in measurement of the same sample. In the subsequence discussions, the DA of the N-CTS was presented from the re sults of PUV methods. The DA of chitosan in this study obtained a range of 32% - 78%, the highest DA of NCTS was 78.67% (Figure 1(a) and Table 4).
The N-acetylation to chitosan molecule was more efficiently occurred under condition of chitosan solution at pH 6.5. The chitosan solution at pH 6.5 was increased the intra and intermolecular hydrogen bonds formation in the chitosan molecule. The free amino groups of chitosan molecule were protonated at pH 6.5 and acetyl (CH3CO–) group from acetic anhydride could be readily reacted to the ionic form of NH3+ in the chitosan molecule more than that of at pH 4 and 11. Moreover the substitution of acetyl group was increased at pH 6.5 of chitosan solution when the temperature was decreased to 15˚C. At pH 6.5 of chitosan solution, 3 mole of acetic anhydride per glucosamine residue of chitosan was observed the maximum amount of substitution of acetyl groups, see in Figure 1(a). The amino group of chitosan molecule in alkaline condition of chitosan solution was NH2 form and its substitution of acetyl group to amino group was poorer than that of acidic condition of chitosan solution. This observation can be clearly seen in method C. When an equal amount of acetic anhydride was added to the chitosan solutions at pH 4 and pH 11, the substitution of acetyl groups were observed with different values due to nature of amino group. Adding the excess amount of acetic anhydride to chitosan solution was transformed chitosan molecule to ionic form made more acetyl group substitu-

Table 4. Percentage degree of acetylation of chitosan by determination with PUV spectrophotometry and infrared (IR) spectrometry.
 (a)
(a) (b)
(b)
Figure 1. (a) Degree of acetylation (%) of acetylated chitosan under different mole ratio of acetic anhydride molecule to glucosamine unit of chitosan molecule at pH 4, 6.5, 11 of chitosan solutions; and (b) FT-IR spectra of CTS and N-CTS by various methods of N-acetylation (A, B, C and D), the peak changes at 1660 cm–1 (amide I) and 1560 cm–1 (amide II).
tion; this fact was seen in the addition of over 9 moles of acetic anhydride to chitosan molecule at pH 11.
Figure 1(b) shows the FT-IR spectra of CTS and NCTS resulted from different methods of N-acetylation. The spectrum of original chitosan at the peak of the 1660 cm–1 and 1560 cm–1 could be suggested that these peaks were the characteristic absorptions of the amide –C=O and –NH2 groups (amide I and amide II) respectively. The OH stretching band 3450 cm–1 was prominent and relatively isolated. The original chitosan gave DA 30% ± 2.6% by IR method. It can be clearly seen that all peaks of amide –C=O stretching vibration at 1660 cm–1 and the bending absorption of –NH2 at 1560 cm–1 are apparently stronger than these peaks of original CTS. There has not been appeared the wavelength of absorbance at 1240 cm–1 in all spectra and could be concluded that no more O-acetylation happened in the acetylation reaction of chitosan in this study.