1. Introduction
Ferrites, a group of familiar magnetic materials with general formula MFe2O4 are extensively applicable in electrical, electronics, medical and industrial applications due to their chemical constancy, economical production cost and improved electric, magnetic and thermal characteristics. Soft ferrites are attractive materials with modest magnetization, greater coactivity, larger anisotropy and fine electrical insulation. Several researchers have explained the optical, electrical, and magnetic properties of zinc ferrite. The electrical and magnetic properties of zinc ferrites can be improved through partial insertion of noble ions such as Cu, Co, Ni, Ce and Mg. SantoshBhukalet, copper-doped CoZn ferrites geared up and detected with a sol-gel auto combustion technique That all nanomaterials are of semiconductor nature [1] . K. Anuet al., synthesized the Zn doped cobalt ferrites by applying two-step process and investigated the variations in electrical and magnetic properties [2] . B.B.V.S. Vera Prasad et al., reported the fabrication of Cu inserted copper zinc ferrites by auto combustion method [3] . They determined the decrease in saturation magnetization with the addition of copper contents. Muhammad Farooq Warsi et al., fabricated erbium doped NiCo spinel ferrites by using co-precipitation route and found the decrease in DC electrical resistivity in the range of 6.20 × 10⁷ - 0.03 × 10⁷ ohm-cm. They observed that these materials are potential candidates for various technological devices. Sandeep b. Somwanshi Al, designed zinc soft ferrites in magnesium and resolved thermal, structural, optical, and spectral characteristics [4] . They concluded an increase in optical bandgap energy in the range of 1.96 - 2.39 eV. Zeeshan Ahmad al, prepared Cerium-doped cobalt ferrites by solid state reaction method and measure the decrease in bandgap energy in the range of 1.4575 - 1.425 eV.
Structural, optical and electrical properties of La3+ inserted ZnMgNi soft ferrites were discussed by M.S. Hasan et al., [5] . Careful study of literature exposed that various methods were used by the researchers to synthesise the nanomaterials like co-precipitation, sol gel, hydrothermal, micro emulsion, mechanical milling etc. [6] [7] . Co-precipitation is popular, emerging and economical synthesis method having enormous prospective. Co-precipitation can be employed for the synthesis of complex materials with enhanced functionalities. By incorporating different elements or dopants during the precipitation process, it is possible to modify the properties of the resulting material, such as its magnetic, optical, or catalytic behavior. This opens up opportunities for the development of advanced materials for various technological applications.
2. Result & Discussion
2.1. Result
Characterization techniques which describe the morphology and magnetic behaviour of our materials.
1) UV-VIS
2) FTIR
3) SEM
2.2. UV-VIS Results and Discussion
The optical properties of Co1−xCexFe2O4sintered at 800oC are measured from ultraviolet radiations visible range. As shown in Figure 1.
From the above graph, two absorbance bands are appeared in 600 - 760 nm
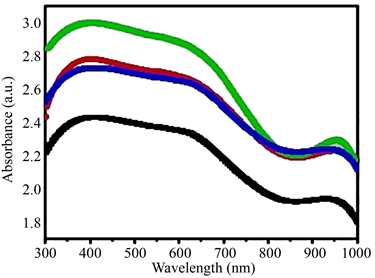
Black (x = 0.00) Co1−xCexFe2O4
Red (x = 0.33)
Blue (x = 0.66)
Green (x = 1.00)
Figure 1. Representation of Wavelength Vs Absorbance showing Energy band gap.
range. Their analyzed Metal to metal charge transfer transitions (2Fe3+ → Fe2+ + Fe4+) and noted that 2a site occupies Fe3+ in Co1−xCexFe2O4. In other words, the Co2+ and Ce2+ are introduced in the formula Co1−xCexFe2O4 system cause the quantity of iron (Fe3+) cat-ions and Fe-O-Fe bonds to decrease, which reduced metal charge transition more difficult [8] . So absorption of Co1−xCexFe2O4 composite became weaker. The values of energy band gap for each material are written below Table 1.
2.3. Fourier Transform Infrared Spectroscopy (FTIR)
For the phase confirmation of Co1−xCexFe2O4 spinel ferrites, Narrow symmetries in crystalline solids and existence or extinction of Fe2+ ions are also determined by this tool [9] FTIR is used to synthesize by the solid state method. The stretching of M-O ions in the spinel ferrites was accepted by different peaks. The absorption peak at 350 - 450 cm−1 shows O2 (Oxygen) and the absorption peak at 550 - 850 cm−1 in the octahedral regions of oxide ions in the metal reflect O2 (Oxygen) and Metalide tensile vibrations. These two peaks confirm the characteristic peaks of all spinel ferrites and the formation of the metal-oxygen band in spinel ferrites. As shown in Figure 2.
This shape show that FTIR spectra at area hotness are sintered at 800˚C with dissimilar x values of the Co1−xCexFe2O4 work (x = 0.00, 0.33, 0.66, 1.00) and 400 - 4000 cm−1 wave figure spinel ferrites. Banding peak increase the feelings of metals as well as oxides in octahedral regions. The peaks at 1531.99 and 2372.08 show H-OH and N-O vibration vibrations, respectively. Since the FTIR range is 500 - 4000 cm−1, no alternation stresses of metal and oxide ions in the octahedral regions are observed. The spectra were quite similar for all x (0.001, 0.33, 0.66, 1.00) compound and the marks show good conformity with the creative writing
![]()
Table 1. List of band gaps for different materials.
![]()
Figure 2. FTIR spectroscopy at different composition.
[10] . These value of the power steady in the octahedral area are calculated using the following relative.
where, ν (wave number), C (speed of light) and m mass of Fe3+ - O2− ions (2.061 × 10⁻²³ g), respectively. The change in Fe3+ - O2− inter nuclear lengths alter the band positions at A and B sites [11] [12] .
If Μ 2.60 × 10⁻²³ g and the force stable in tetrahedral or octahedral region among μ metal oxide ions is c = 2.99 × 108 cm/s and the grouping band in octahedral regions value.
Ions inside the octahedral region for all compound of the spinel ferrites Co1−xCexFe2O4 (x = 0.00, 0.33, 0.66, 1.00). The register in the on top of Table 2 shows the incidence of the combination bands and strength constants in the tetrahedral region for all compound of Co1−xCexFe2O4 (x = 0.00, 0.33, 0.66, 1.00) spinel ferrites. The strength modify depends on the occurrence of the combination band. The little shift in the combination band is the verification of the payment of the Ce ions or the alter in the ionic radius and the replacement of the metal oxide ions in the tetrahedral regions.
2.4. SEM (Scanning Electron Microscopy)
The disguise morphology of spinel ferrites of Co1−xCexFe2O4 (x = 0.00, 0.33, 0.66, 1.00) was sintered at 800˚C with a SEM scanning electron microscope, ie, estimated for dissimilar composition of x = 0.00, 0.33, 0.66, 1.00. The surface morphological characterization of Co1−xCexFe2O4 spinel ferrites synthesized by the
![]()
Table 2. List of composition of different materials.
solid-state reaction method was performed using Scanning Electron Microscopy (SEM). The SEM analysis provided insights into the surface structure, texture, and grain size of the synthesized ferrites. The SEM images revealed the morphology of the spinel ferrite samples at various compositions (x = 0.0, 0.33, 0.66, 1.0). The surfaces appeared to be relatively smooth and exhibited varying degrees of grain agglomeration. The grain sizes of the synthesized cubic spinel ferrites were observed to be in the range of 1.25 µm to 2.65 µm. The SEM analysis allowed for a detailed examination of the surface features, such as the presence of cracks, porosity, and the distribution of grains. The images provided visual evidence of the structural properties and surface characteristics of the synthesized ferrites. Overall, the SEM characterization of Co1−xCexFe2O4 spinel ferrites synthesized through the solid-state reaction method contributed to the understanding of their surface morphology and grain size, which are important factors in determining their properties and potential applications in various fields.
The face morphology of every one micrograph shows an all the similar, well-packed and crack-free granule sharing. At the similar time as the x value increase, the grain becomes occasionally cubic. In adding, the SEM micrograph shows that for the x = 0.0 work the outside is less consistent, but with x values of 0.33, 0.66 and 1.00, the substance becomes all the same. As shown in Figures 3(a)-3(d) respectively.
2.5. Experimental
Synthesis of Co1−xCexFe2O4 nanoferrites
Ce substituted Co1−xCexFe2O4 where (x = 0.0, 0.33, 0.66, 1.0) nanoparticles were being synthesised with solid state reaction method. Nitrates of Copper, Cerium and Iron were employed to prepare Ce doped Co1−xCexFe2O4 nanoferrites. The stochiometric ratios of desired salts were dissolved in deionized water. Sodium hydro oxide (NaOH) mixed in water was added in solutions and were stirred at 80 ͦC to keep pH 11. At temperature 80 ͦC the attained solution was positioned in water bath for 24 hrs, pursued by filtration. The particles were cleaned through deionized water and followed by ethanol until the pH was 7. Obtained crystals were dried in oven and grinded to acquire fine powder. The achieved powder of each sample was sintered at 800˚C for 8 hrs. Figure 3 shows the whole synthesized process.
3. Conclusion
Co1−xCexFe2O4 (x = 0.0, 0.33, 0.66, 1.0) ferrites have been prepared using sol-gel technique. The lattice constants were to be found using SEM analysis and it shows the formation of cubic spinel ferrites. The sintering temperature is about 800oC we get multi-ferrites. The FTIR analysis shows the stretching of bonds on tetrahedral and octahedral sites. The UV-VIS analysis shows the energy band gap.