Characterization and Quantification of Phenolic Compounds of Hydroethanolic Extracts and Fractions of Leaves Gnetum africanum (Welv.) and Gnetum buchholzianum (Engl.) (Gnetaceae) ()

Copyright © 2022 by author(s) and Scientific Research Publishing Inc.
This work is licensed under the Creative Commons Attribution International License (CC BY 4.0).
http://creativecommons.org/licenses/by/4.0/
1. Introduction
Gnetum africanum and Gnetum buchholzianum are found in the wild in the humid tropical forests of Nigeria, Cameroon, Central African Republic, Gabon, Democratic Republic of Congo and Angola [1] . In Cameroon, Gnetum africanum and Gnetum buchholzianum are found mainly in the Center, Littoral, South and South-West regions and are widely used for food needs [2] . Gnetum spp is known for its medicinal properties. In Nigeria, for example, the leaves known locally as “afang” are used for the treatment of spleen, angina and cathartic. In the Democratic Republic of Congo where they are known under the name of “fumbwa”, they are used to fight against nausea and an antidote against certain poisons, the leaves are used to fight against warts, hemorrhoids and boils. In Mozambique, this medicinal plant is used to fight against constipation because of its high fiber content [3] . It also softens the pain of contractions and therefore facilitates childbirth [4] . An antidiarheic activity of extracts from these leaves has been reported [5] . In Cameroon, the leaves are known as “okok” or “ekoke” or “eru”. The predominant use of which is food, and they are associated with peanuts in “okok” or with Talinum triangulare leaves for cooking “eru”. In south-eastern Nigeria and in the far north of Cameroon, they are eaten as salad [3] . Although, traditional medicine has reported some therapeutic uses of Gnetum spp. scientific evidence on their therapeutic effects and optimal conditions for extracting their bioactive substances is yet to be produced [6] . A study conducted showed that the methanol extracts of the leaves of Gnetum africanum and Gnetum buchholzanium are richer in secondary metabolites than hexane and ethyl acetate extracts after qualitative chemical screening [7] . Results from this work have shown that the therapeutic dose which restored the glycemia in the rats rendered diabetic was 200 mg/ml. This dose was found to have no toxic effect on the rats. This same dose was administered to the rats and rendered diarrhea thus restoring their digestive system. Several researchers have evaluated the chemical composition of Gnetum ssp. Which grow in different geographic areas and various species of the genus Gnetum. The isolation and elucidation of the structure of three phenolic compounds, namely 3,4-dimethoxychlorogenic acid (1), resveratrol (2) and 3-methoxyresveratrol (3) from the stem bark of Melinjo (Gnetum gnemon) have been made. Isolation of these compounds was performed by chromatography and structural elucidation was performed by interpretation of spectroscopic data including UV, IR, 1H and 13C 1D and 2D NMR, and FABMS. The results of this study also showed the activity of each compound as a radical hydroxyl scavenger of 3,4-dimethoxychlorogenic acid (3), resveratrol (2) and 3-methoxyresveratrol (3), with a IC50 of 523.7; 45.17; and 60.12; g/ml respectively [8] . From what have been mentioned above, Gnetum africanum and Gnetum buchholzianum, two species of the genius Gnetum generally encountered in Central Africa including Cameroon have not been the subjects of profound phytochemical studies. From which arose the aim of our research.
2. Material and Methods
2.1. Preparation of Hydroethanolic Extracts, and Fractions from the Leaves of G. africanum and G. buchholzianum
2.1.1. Preparation of Crude Extract
The leaves of Gnetum africanum Welw. and Gnetum buchholzianum Engl. were harvested from Dibombari, Coastal Region of Cameroon (Lat: 4.3179; Lon: 9.7209) and Limbe Southwest Region of Cameroon (Lat: 4.1796; Lon: 9.2825) respectively. After harvest, the leaves were taken to the laboratory where they were sorted, washed in tap water, drained, weighed and then dried in the shade until they reached dry mass. The dried leaves were crushed and the resulting powders were weighed and then macerated separately in aqueous ethanol (70%) for 72 hours in the maceration tanks. They were then filtered through a funnel stuffed with Wattman N˚01 filter paper. The filtrate obtained was concentrated using the R-205 brand Rota vapor. The maceration was repeated twice in order to maximize the yield.
2.1.2. Splitting
Each hydroethanolic extract (80.5 g) was dissolved in 95˚C ethanol and then fixed in silica (150 g) and the whole was left in a steamer at 30˚C for 24 hours. After drying, the fractionation was carried out by flash chromatography using hexane to remove the non-polar compounds and chlorophyll, then dichloromethane, ethyl acetate and finally with methanol for the exhaustion of the residual phase according to the order of increasing polarity. Each of the fractions obtained was homogenized and concentrated in a Rota vapor and then in an oven under the same conditions as above.
2.1.3. Qualitative Analysis of the Compounds Contained in the Hydroethanolic Extracts of Plant Leaves and Fractions Obtained by LC-MS
The analytical study of the hydroethanolic extracts and fractions obtained was carried out at the Normal Higher School of the University of Yaoundé I, using an HPLC/MS (Bruker Compact) according to the method described. by Abay et al.; [9] with slight modifications.
2.2. Identification of Some Chemical Compounds
The compounds were characterized using LC coupled to mass spectroscopy according to the method described by Abay et al. [9] with slight modifications comparison with data from the literature. None characterized compounds which may be potentially new or unknown.
2.3. Quantification of Some Polyphenolic Compounds (PC)
2.3.1. Total Polyphenol (TPP) Assays
The total phenolic compounds were determined as follows: 100 μl of each crude extract and fraction of extract was introduced into a dry 4 ml tube, diluted with 900 μl of distilled water followed by addition of 900 μl of Folin-reagent. Ciocalteu (1N) was added then immediately after 200 μl of a solution of Na2CO3 (20%) was added. The resulting mixture was incubated at room temperature for about 40 minutes protected from light. The absorbance was then measured with a spectrophotometer at 725 nm against a solution of methanol used as a blank. A calibration curve was done before the analysis with gallic acid under the same conditions as the samples to be analyzed. The results obtained were expressed in mg gallic acid equivalent per gram of dry matter (E GA/g Ms) [10] .
2.3.2. Quantification of Total Flavonoids (TFv)
Total flavonoids were evaluated by colorimetry. 250 μl of each extract and fraction and 1000 μl of distilled water are successively introduced into a 10 ml flask. At the initial time (0 minutes) 75 µl of NaNO2 solution (5%) was added. After 5 minutes, 75 µl of AlCl3 (10%) was added. And at 6 minutes, 500 µl of NaOH (1N) was added and followed by addition of 2500 µl of distilled water successively to the mixture. A calibration curve was developed with standard catechin solutions prepared at different concentrations. The absorbance of the mixture obtained was measured directly with a UV-visible spectrophotometer at 510 nm and the results are expressed in mg catechin equivalent/g of dry matter (EC/g Ms) [10] .
3. Results and Discussion
3.1. Hydroethanolic Extracts and Fractions Obtained
Table 1 illustrated fractions obtained from each extracts studied plant (EBa and EBb) and solvent (hexan, dicholromethan, ethyl acetate and methanol).
3.2. Comparative Study of the Chemical Composition of Hydroethanolic Extracts from the Leaves of G. africanum (EBa) and G. buchholzianum (EBb) by LC-MS
The chromatographic profiles of the hydroethanolic extracts of EBa and EBb obtained (Figure 1 and Figure 2) revealed the presence of several peaks of compounds (m/z) as a function of the retention time expressed in minutes (Rt). The order of appearance of these compounds is related to the polarity of the molecules and the type of the column. More polar compounds were eluted first from the column and identified while others are not identified (Nd). These profiles show a total of 40 chemical compounds detected respectively 20 for the species africanum and 20 for the species buchholzianum.
Table 2(a) and Table 2(b) present the chemical formula of the compounds identified. Among the compounds detected, 7 were identified for EBa and 8 for EBb according to the ratio (Rt; m/z). The structures of components characterized in EBa and EBb are in Annex.
![]()
Table 1. Fractions obtained by each hydroethanolic extract.
EBa and EBb: hydroethanolic extract of Gnetum africanum and Gnetum buchholzianum.
![]()
Figure 1. Chromatographic profile of the hydroethanolic extract of Gnetum africanum (EBa).
![]()
Figure 2. Chromatographic profile of the hydroethanolic extract of Gnetum buchholzianum (EBb).
(a) ![]() (b)
(b) ![]()
Table 2. Analyzes and identification of chemical compounds of Gnetum africanum (EBa) (a) and Gnetum buchholzianum (EBb) (b).
Rt: retention time; m/z: inion pic pseudomolecular, nd: non determined.
3.2.1. Comparative Study of the Chemical Compounds of the Different Fractions Obtained from Hydroethanolic Extracts from the Leaves of G. africanum (EBa)
The chromatographic profiles of the fractions of hydroethanolic extracts obtained from EBa (Figures 3-6) revealed the presence of several peaks of compounds (m/z) as a function of the retention time expressed in minutes (Rt). The order of appearance of these compounds is related to the polarity of the molecules and the type of the column.
These figures show no similarity between the different m/z ratios of the detected compounds constituting the hexane, dichloromethan, ethyl acetate and methanol fractions of G. africanum. Two compounds detected at the same retention time show different ratios (fraction with hexane and ethyl acetate respectively 4.62; 315.1594 and 4.62; 315.1604).
![]()
Figure 3. Chromatographic profile of HFa.
![]()
Figure 4. Chromatographic profile of DFa.
![]()
Figure 5. Chromatographic profile of EFa.
![]()
Figure 6. Chromatographic profile of MFa.
3.2.2. Comparative Study of Chemical Compounds Fractions Obtained from Hydroethanolic Extracts from the Leaves of G. buchholzianum (EBb)
The chromatographic profiles of the hydroethanolic extract fractions obtained from EBb (Figures 7-9) revealed the presence of several peaks of compounds (m/z) as a function of the retention time expressed in minutes (Rt). The order of appearance of these compounds is related to the polarity of the molecules and the type of the column.
3.3. Quantification of Phenolic Compounds by the Spectrophotometric Method
The hydroethanolic extracts and the fractions obtained were used for the determination of the phenolic compounds. Table 3 and Table 4 show the proportions of total polyphenols (TPP) and total flavonoids TFv (Table 5 and Table 6) in each hydroethanolic extract compared to its fractions.
![]()
Table 3. Summary of total polyphenol content (TPP) in the hydroethanolic extracts and fractions obtained to the G. africanum population.
The values of the same column with the same letter are statistically identical while those with different letters are statistically different with p < 0.05.
![]()
Table 4. Summary of TPP contents in the hydroethanolic extracts and fractions obtained from the G. buchholzianum population.
The values of the same column with the same letter are statistically identical while those with different letters are statistically different with p < 0.05.
![]()
Table 5. Summary of total flavonoid content (TFv) in the hydroethanolic extracts and fractions obtained from the G. africanum population.
The values of the same column with the same letter are statistically identical while those with different letters are statistically different with p < 0.05
![]()
Table 6. Summary of TFv contents in the hydroethanolic extracts and fractions obtained from the G. buchholzianum population.
The values of the same column with the same letter are statistically identical while those with different letters are statistically different with p < 0.05.
![]()
Figure 7. Chromatographic profile of HFb.
![]()
Figure 8. Chromatographic profile of DFb.
![]()
Figure 9. Chromatographic profile of EFb.
4. Discussion
The analysis of the chromatographic profiles of the hydroethanolic extracts and fractions obtained with solvents of increasing polarity and as well as the quantification of phenolic compounds made it possible to highlight 15 chemical compounds and the statistically significant proportions of these compounds. It emerges from this analysis that the stilbenes are the family of the majority compounds (7/15) followed by the flavonoids (4/15). Phenols (3/15) and a known compound catechin (epigallocatchechin). The stilbenes are the most famous family of compounds of the genus Gnetum. These results obtained corroborate with those found by Fadi et al. (2011) [3] on cultivars of Gnetum gnemon revealed 15 compounds of the stilbenes family. Ali et al. (2011) [3] also obtained 9 stilbenes in the spice africanum. All the compounds detected by HPLC-MS in the hydroethanolic extract, as well as the fractions obtained were not identified. This is explained by the identification methods taken from the literature which have made it possible to identify compounds of the stibene family such as Gnetupendin D (1), Isorhaponcitin (4), Gnetuhaidin P (1'), Gnetupendin D (3'), Gnetuhainin C (4') [11] compared to usual spectroscopic methods (NMR, COZY, DEPT…). There is a low structural homogeneity between the chemical compounds of the two hydroethanolic extracts and between the different fractions obtained on the other hand. Common compounds are Gnetupendin D (1) and Homovanillyl alcohol (6) for both species and Gnetupendin D (3') for FAb. This homogeneity can be explained by the fact that these plants are from the same vegetable kingdom. The difference on the other hand, could be explained by the fact that these plants were harvested in two different agro-ecological areas and each compound is eluted in the solvent where it has the affinity. The contents of total flavonoids and polyphenols are respectively 29.870 ± 2.485 - 220.200 ± 35.500 (mg EQ/g extract) for the ethanolic extract and dicholoromethane fraction of Gnetum africanum welv. (EBa and DFa) and 2.233 ± 0.251 - 335.300 ± 57.810 (mg EQ/g extract) for the hydroethanolic extract and dicholoromethane fraction of Gnetum buchholzianum Engl. (EBb and DFb). On the other hand, the total polyphenol contents are between 6.993 ± 0.046 - 14.520 ± 0.557 (mg EQ/g extract) for the hydroethanolic extract and methanol fraction of Gnetum africanum Welv. (EBa and MFa) and 4.560 ± 0.010 - 16.250 ± 1.704 (mg EQ/g extract) for the hydroethanolic extract and dicholoromethan fraction of Gnetum buchholzianum engl. (EBb and DFb). The work carried out by Beack et al., [13] showed the high levels of total polyphenols in the fresh leaves of G. africanum and G. buchholzianum respectively of 507.17 ± 21.55 and 406.37 ± 3.09 (mg/100g DM). This would show that the levels of phenolic compounds decrease during the preparation of the alcoholic extracts. This difference in concentration could also be explained by the fact that various solvents of varying polarity were used. Thus, secondary metabolites are eluted differently depending on the solvent for which they have more affinity, which influences their concentration. In summary, the results of this study revealed that these two spices content phenolic compounds, flavonoids, and stilbenes and demonstrated the quantification of the phenolic compounds. These could be used to fight against multi-resistant infectious agents. They can also be used as natural sources of antioxidants.
5. Conclusion
At the end of our investigation, which focused on the qualitative and quantitative evaluation of phenolic compounds of hydroethanolic extracts and fractions obtained from the leaves of Gnetum africanum and Gnetum buchholzianum (Gnetaceae), we can conclude that 15 phenolic compounds divided into three families such as flavonoids, stilbenes and phenols have been characterized. The dichloromethane fractions showed significantly the total flavonoid contents removed from both extracts. In contrast, the total polyphenols content was high in the hydroethanol extract of Gnetum buchholzianum. These bioactive compounds identified and total phenolics compounds quantified can be exploited in pharmacological and pharmacokinetical activities to fight against multi-resistant infectious agents and as well as oxidative stress and antiinflammatory diseases.
Acknowledgements
The authors thank the phytochemistry and natural pharmaceutical substances laboratory of the Faculty of Medicine and Pharmaceutical Science of the University of Douala for the providing equipment for obtaining hydroethanolic extracts, the chemistry research unit of the Faculty of Sciences of the same University for the fractionation of hydroethanolic extracts and the Higher Normal School of the University of Yaounde I, for the analytical study of hydroethanolic extracts and fractions obtained using an HPLC/MS type device of the Ultimate 3000 brand ( Thermo Fisher, USA). The first author is grateful to the Ministry of Higher Education for the mobility fellowship.
Data Availability
The data are available upon request
Authors’ Contributions
Bertin Sone Enone, Sandrine Sikadeu and Celestine Magne carried out the experiments. Lahngong Methodius Shinyuy and Wilfred Ndogmo Tekapi involved in chemicals analysis. Valdi Steve Djova involved quantitive phenolic compounds analysis. Jean-Pierre Ngene, Charles Christian Ngoule, Jean Baptiste Hzounda, Juliette Koube and Hans Denis Bamal performed methodology and chromatographic profils analysis, Simone Véronique Fannang, Moïse Henri Julien Nko’o for chemical structure designed. Loé Gisèle Etame, Josiane Etang and Albert Mouelle Sone designed the study. All the authors were involved in the draft and review of the manuscript.
Annex
1) Chemicals structures of components identified in EBa
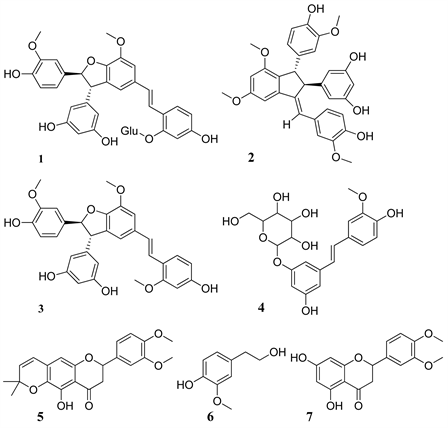
1: Gnetupendin D; 2: Dimethoxygnetulin; 3: Methoxyparvifolol D; 4: Isorhaponcitin;
5: Dimethoxydihydropyrane riodictyol; 6: Alcool Homovanillyl; 7: Dimethoxyeriodictyol
2) Chemicals structures of components identified in EBb
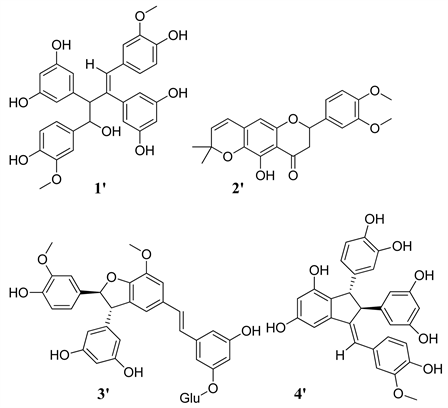
![]()
1': Gnetuhaidin P; 2': Dimethoxydihydropyraneriodictyol; 3': Gnetupendin D; 4': Gnetuhainin C; 5': Trimethoxyluteolin; 6': Epigallocathechin; 7': Alcool Erythro guaiacylglycerol-β-O-4’-coniferyl; 8': Alcool Homovanillyl.