
1. Introduction
Acquired immunodeficiency syndrome (AIDS) is caused by a virus known as human immunodeficiency virus (HIV). Human immunodeficiency virus infection destroys the body immune system, increases the risk of certain pathologies, damages body organs such as brain, kidney, and heart, and causes death. HIV/AIDS is currently killing about 2 million people worldwide each year. The most affected continent is Africa, which hosts about two-thirds of all HIV/AIDS infested people. Within Africa most transmission occurs through heterosexual sex. According to the national survey conducted by Sudan national AIDS programme (SNAP) in 2002 [1], Sudan is the most severely affected country in north Africa and the middle east with estimated 500,000 people living with HIV.
Since HIV emerged in 1981, several studies, including mathematical modelling have been devoted to understand the transmission of the infection. Mathematical models have been used extensively in research into the epidemiology of HIV/AIDS, to help improve our standing of the major contributing factors in a given epidemic. Previous survey of mathematical models for HIV/AIDS is numerous (see for instance Anderson [2] [3] and Isham [4] ). Abdul Karim and Ndakwo [5] studied the susceptible-exposed-infectious-AIDS, epidemic model for vertical transmission of HIV/AIDS in homogeneous mixing population. Ajay et al. [6] developed an HIV mathematical model with explicit behavioural foundations to explore an array of policy interventions related to HIV transmission among injecting drug users. There is also a recent empirical literature that studies HIV/AIDS prevention policies using mostly field experiments, and sometimes natural experiments or crosscountry data (see Behrman and Kohler [7] for an excellent survey). Biazar [8] considered the transmission of a non-fatal disease in a population which is assumed to have constant size over the period of the epidemic. He applied Adomian decomposition method to the simple and basic SIR epidemic model, which is translated to the system of non-linear ordinary equations. The analytical and numerical results obtained illustrated that, while the number of susceptible increases, the number of invective decreases in the period of epidemic, meanwhile the number of immune population increases. But the size of the population over the period of epidemic is constant. Cassels et al. [9] show how mathematical modelling studies have contributed to understanding the dynamics and disparities in the global spread of HIV. Many papers simulate SIR models numerically to forecast the disease incidence in the future or to study the effectiveness of prevention policies. For example, Clark and Eaton [10] simulate the effectiveness of male circumcision. Hyman and Stanley [11] consider both continuous and discrete HIV/AIDS models with heterogeneity and different mixing structures that analyse the spread from high to low risk groups, the effects of variable infectivity and the instability of the back calculation procedure. Kimbir and Oduwole [12] proposed a mathematical model of HIV/AIDS transmission dynamics considering counselling and antiretroviral therapy as major means of control of infection. Analytical and numerical results obtained indicated that they could be effective methods in the control and eradication of HIV/AIDS. Low-Beer and Stoneburner [13] used a mathematical HIV/AIDS transmission model to forecast HIV incidence in East Africa. May and Anderson [14] develop HIV transmission dynamics models that represent the progression from HIV+ status to AIDS where the population is divided into categories of progressive infectious stages. These models translate the movements between these stages into difference equations in the deterministic case and into state transition probabilities in the stochastic case. Mode et al. [15] modelled AIDS epidemic and made a comparison between deterministic and stochastic models using expected values and simulation. Mukandavire and Garira [16] investigated the impact of public health educational campaigns and the role of sex workers on the spread of HIV/AIDS among heterosexuals, where they concluded that the presence of sex workers enlarges the epidemic threshold R0, thus fuels the epidemic among the heterosexuals. Also they found that public health educational campaigns among the high-risk heterosexual population reduces R0, and therefore can help slow or eradicate the epidemic. Naresh et al. [17] modelled the spread of AIDS with vertical transmission, and observed that by controlling the rate of vertical transmission the spread of the disease can be reduced significantly, and consequently the equilibrium values of infective and AIDS population can be maintained at lower-levels. Schwages, Castillo-Chavez and Hethcote [18] have reviewed both statistical and mathematical approaches to HIV/AIDS modelling.
The current study spotlight one part of the Sudan: The Khartoum state, which is the capital of the Sudan and it, has very good data related to HIV/AIDS and sexual behaviour. In this paper, our objective is to provide more comprehensive picture of the current nature of Khartoum’s HIV/Aids epidemic and its development in future. The results will form the basis for better planning and more effective programs to control HIV/Aids throughout the country. Further, better understanding of nature of HIV/Aids in Khartoum will strengthen advocacy programs and built a great commitment within the community to tackle this serious problem.
In this paper we use the Susceptible Infected Removed (SIR) model [19] for which the population is partitioned into compartments of Susceptible Individuals, Infective Individuals and Recovered Individuals, with size S(t), I(t), and R(t) respectively. Susceptible Individuals that are susceptible have, in the case of the basic SIR model, never been infected, and they are able to catch the disease. Once they have it, they move into the infected compartment. Infected individuals can spread the disease to susceptible individuals. The time they spend in the infected compartment is the infectious period, after which they enter the recovered compartment. Recovered Individuals in the recovered compartment are assumed to be immune for life.
The total population is constant and denoted by
, where S, I, R ≥ 0, because they represent the numbers of individuals. This model does not include vital dynamics (birth rate and death rate) [19]. For simplicity, it is assumed that the total population N is constant with time. We consider the following parameters:
・ α is the transmission coefficient, which determines the infection rate of an individual.
・ γ is the recovery rate of an individual: (I individuals)/(days required to recover).
・ R0: the basic reproduction number given by:
If R0 > 1 then
and an epidemic occurs.
The SIR model (Figure 1) is easily written using ordinary differential equations (ODEs), which implies a deterministic model (no randomness is involved, the same starting conditions give the same output), with continuous time (as opposed to discrete time). The SIR Model is described by the following differential equations:
Analogous to the principles of reaction kinetics, we assume that encounters between infected and susceptible individuals occur at a rate proportional to their respective numbers in the population.
Removal from compartment I to R could be due to successful treatment or the immune system has been able to fight against the disease to lessen infectiousness such that the patients become uninfectious.
2. Methodology
This is a prospective study conducted during the period from 2002 to April 2016. The study was conducted on collected data from Sudanese ministry of health and from different great hospitals in Khartoum state (Omdurman, Bashair, Sudanese army, El Silah Altiby, and Bahri hospitals). Also, the main activity to achieve the goal of this work is to construct a nonlinear deterministic mathematical model using ordinary differential equations.
![]()
Figure 1. Scheme of the basic SIR model. Boxes represent compartments, and arrows indicate flux between the compartments.
3. Data Analysis
The basic reproduction number R0 estimated from the epidemic model fitting to population-level data where R0 is the average number of secondary cases of an infectious disease arising from typical case in a total susceptible population. In this work, an individual is expected to infect a number of
secondary cases which represent the R0 (the threshold parameter of the population-level model), where
represent the infection rate of an individual and
is the recovery rate of an individual [20]. Data and the SIR modelled using MATLAB version 7.4.0.287 (R2007a).
4. Results
According to the outcome of our study, Khartoum is endemic for HIV for four years since the epidemic began in the year 2002, then the epidemic decreased when the ART start in the year 2006 until it extinct in the year 2016. The reproduction number (R0) was computed from the population?level model fitting to surveillance data from Khartoum state. When the epidemic began in the year 2002 the value of R0 is 1.02 and this value of R0 remain stable for four years until the year 2005. From the year 2006-2016 the value of R0 is 0.98. The most affected Sudanese population in Khartoum state with AIDS was the male (teenager) 10 - 19 age group.
The total number of the people treating with ART percent is found very high in Omdurman 59.85%, 30.82%, 9.31% for Khartoum, and Bahri from the year 2007 to 2016. For children and adult the number of people who treated with ART in the previous three cities increased from the year 2008 to 2016.
Result presented in graphical form (Graphs 1-6). The data is organized in yearly (7 data points) with age and sex distribution.
To simplify the model, we used the following groups:
1) Ages 10 - 19 are considered to be Teenager.
2) Ages 20+ are considered to be Adults.
3) Ages under 10 are considered to be Childrens.
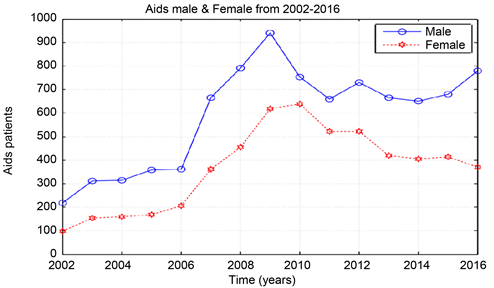
Graph 1. AIDS data from 2002-2016, male & female.
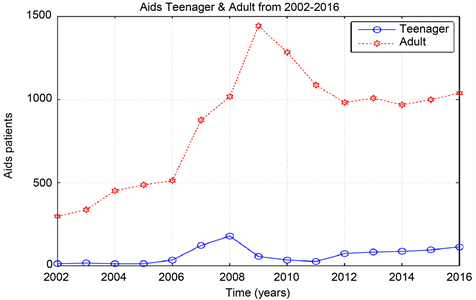
Graph 2. Aids data from 2002-2012, teenager & adult.
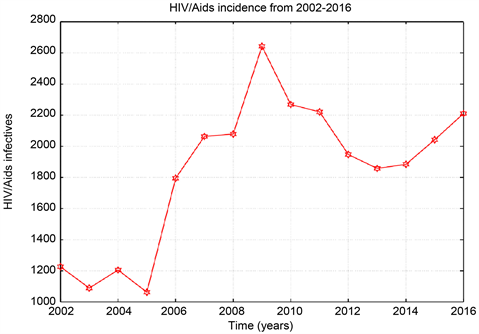
Graph 3. HIV/Aids total incidence data from 2002-2016.
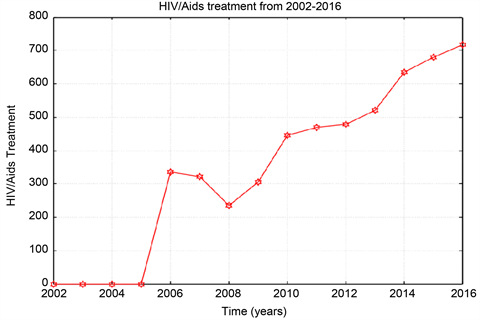
Graph 4. ART total data from 2002-2016.
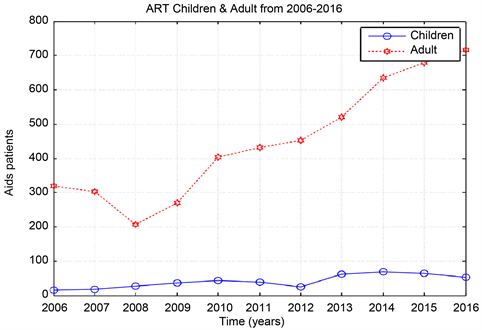
Graph 5. ART children and adult from 2006-2016.

Graph 6. ART data in 3 cities (Khartoum, Bahri, and Omdurman) from 2006-2016.
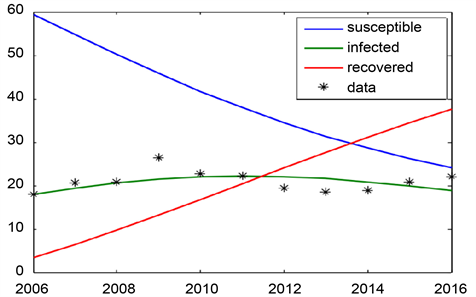
Graph 7. SIR model for khartoum state for the year 2006-2016.
In Graph 7 we use the ODE solver to solve the SIR system with the optimal parameter Values
and γ for the years 2002-2016 (
= 0.009, γ = 0.01). The value of R0 is 0.98. ART start from the year 2006.
In Graph 8 we use the ODE solver to solve the SIR system with the optimal
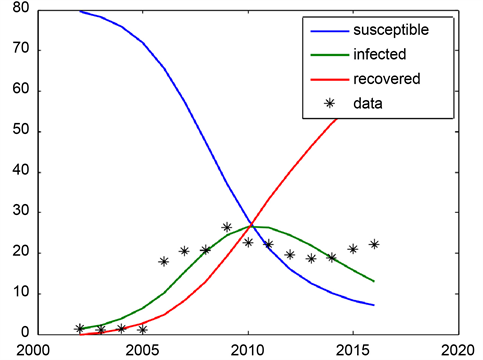
Graph 8. SIR model for Khartoum state for the year 2002-2016.
parameter Values
and γ for the years 2002-2016 (
= 0.009, γ = 0.01). The value of R0 is 0.98.
5. Discussion
From the data the Sudanese ministry of health recorded annually about 1200 to 2200 new cases of HIV and AIDS in Khartoum state. The so-called antiretroviral treatment (ART) only burst the immune systems of the infected person against secondary infections. Though, the ART slows the sero-conversion period because they produce T-cells which are the inducer/helper cells and this increases the CD4+ counts. In this study ART data collected from Sudanese ministry of health and ART centres in the three cities Khartoum, Bahri, and Omdurman. The number of recovered people (people who treated by ART) increasing, while the number susceptible is decreasing from the year 2006 to 2016.
Also, in this study the basic SIR model was used to compute the amount of susceptible, infected, and removed people in a population. It is also used to explain the change in the number of people needing medical attention during an epidemic. SIR model shows that more recovering people in 2016 than infected one, which the curve is going down. Also, when time increases the number of susceptible is decreasing at a fast rate as the curve is linear. The number of death is quite constant over the years. Addition to this, the number of recovered people (people who treat with ART) increasing while susceptible dropping from the year 2006 to 2016.
6. Conclusion
The study focuses on the HIV/AIDS in Khartoum state during the period 2006-2016. The surveillance data collected from the Sudanese ministry of health and the three cities Khartoum, Bhari, and Omdurman great hospitals. Data were analysed using MATLAB code. This study shows that the antiretroviral treatment (also known as antiretroviral therapy or ART) is recommended for everyone who has HIV. ART can’t cure HIV, but helps people with HIV live longer, healthier lives. This study result can be used as a basis for us to make efforts for a better understanding of the problem of the disease in Khartoum and to help decision makers in planning to fight the disease.
Acknowledgements
The authors acknowledge the staffs of Omdurman, Bashair, Sudanese Army, El Silah Altiby, and Bahri hospitals, and Sudanese Ministry of Health.