1. Introduction
1.1. General
The case study was done on Narayanghat-Mugling road segment which is a link between Prithvi Highway and East-West Highway, located in Chitawan district of Narayani zone, Central development region Nepal. Road network plays an important role in any country’s transport and communication. Pavement condition is one factor to access the efficiency of road network. Design life and bearing capacity of pavement are dependent on the construction materials and the type of highway. Design life of new flexible pavement is frequently taken as 5 to 15 years [1] which includes regular maintenance and rehabilitation within its service period.
Thus annual average daily traffic (AADT) of each class is a key input to the schedule of maintenance and rehabilitation plan. However, the occurrence of overloaded truck traffic induces incorrect estimation in total equivalent single Axle Loads (ESALs). Therefore the frequency of maintenance and rehabilitation within the service period are corrupted by overloaded truck traffic. The pavement deterioration over time is caused by a combination of factors; however, traffic loads play a key role in consumption of pavement service life. Magnitude and configuration of vehicular loads together with the environment has a significant effect on induced tensile stresses within flexible pavement [2] .
Overloaded truck traffic is an untenable problem around the world. This phenomenon occurs in not only developing countries, but also in developed countries. Extremely high enforcement and inspection are applied to ensure this. Impact of overloaded truck traffic includes economic, social and environmental losses [2] . The major economic impact by overloaded truck traffic is unexpected expenditure on pavement investment. Because pavement design is based on normal traffic load and total ESAL. Overloaded truck traffic is not the expected traffic load in pavement design. As a result, the bearing capacity of pavement is lower than the actual design. Pavement service life has a direct relationship with net present value of investment [3] . Construction cost for a new pavement is the most direct cost, which occurs when pavement service life is reduced. On the other hand, increase in annual maintenance and rehabilitation costs at the most evident economic loss is induced by overloaded truck traffic.
1.1.1. Pavement Service Life
The calculation of pavement service life is based on AADT and ESAL with standard truck traffic. The case study investigated in this research is Highway H05 (AH42) Narayanghat-Muglingroad and AADT of 2010 is adopted [4] . According to the ESAL calculated from dataset, the actual ESAL of each vehicle class was found. After that, total ESAL with standard truck traffic could be found. Comparison between ESAL with overloaded and standard truck traffic is the important factor to estimate the reduction in pavement service life, because pavement service life is directly driven by traffic load.
1.1.2. Maintenance and Rehabilitation Cost
Calculations of ESAL of overloaded truck traffic and pavement service life were the steps to work out the total Maintenance and Rehabilitation (M&R) cost over the service period. The annual budgeting for M&R cost is different from actual M&R cost [3] . Meanwhile, the actual service life of pavement is also reduced by overloaded truck traffic. Therefore, the calculation of net present value (NPV) of investment to the pavement must be based on service life and M&R cost. Thus, the difference in NPV of pavement investment with and without overloaded truck traffic becomes the important indicator to determine the value of economic loss [5] .
1.2. Vehicle Classification in Nepal
Vehicles are at present classified into three categories under three catagories [6] . They are:
1) Heavy Vehicle: Gross vehicle weight > 10 ton.
2) Medium Vehicle: Gross vehicle weight 4 to 10 ton.
3) Light Vehicle: Gross vehicle weight < 4 ton.
Legal Load Provision
Maximum allowable axle load is the axle load as specified by the manufacturer within safe axle load and as per heavy vehicle management policy [7] as shown in Figure 1:
1) Single axle fitted with 2 tires: 6 ton.
2) Single axle fitted with 4 tires 10.2 ton.
3) Tandem axle fitted with 8 tires 19 ton.
1.3. Road Efficiency and Damage
Road maintenance is a remarkable public cost on most of countries. Certainly freight traffic is the major cause of road damage, and it is the reason that most of the researches focus on heavy truck. Increase in weight limit of truck was the major concern [8] .
1.4. Truck Configuration and Pavement Damage
U.S. pavement engineers have been concerned with the truck-tire configuration, tire types and pressure because of the potential of pavement damage. Study of the “impact of high-pressure tires and single tired axles” indicated that use of single tires have no significant change. This study proved that type of axles group, type of tire, and pressure are major component to determinate pavement
damage. Study results showed that three main criteria drive the level of pavement damage [9] .
・ Number of axles―more axles cause less damage.
・ Number of tire―dual tire cause less damage.
・ Types of tires―less damage is caused when trucks use wide base tires.
1.5. Safety Impact of Truck Overloading
Fatal crashes increases due to the large trucks when inspection activity declined. This relationship indicates a significant fact that overloading trucks are taking an important role in road scrutinize safety.
Two main conclusions have been found [10] .
➢ Truck inspection is the effective way to eliminate overloading.
➢ Overloading truck is inevitable, no matter whether in developed or developing countries.
1.6. Effects of Heavy Vehicle Characteristics on Pavement Response and Performance
The relative damage to a pavement caused by heavy trucks is dependent on vehicle, tire, and pavement factors. Rutting is linearly related to axle load. However, fatigue is not systematically related to gross weight but varies in accordance with the maximum axleloads on each vehicle combination. Pavement temperature has a very strong influence on flexible pavement fatigue and rutting. Pavement layer thicknesses and sub-grade strengths have a very strong influence on fatigue and rutting. When a loaded axle moves along a pavement it deflects the pavement downward creating a deflection basin causing fatigue and rutting. Axle Spacing, Speed, Maneuvering, Wheel Path Location are also the factors for road damage [11] .
1.7. AASHTO Design Guide
Fundamental Equations
The 1993 AASHTO Design Guide is the current standard used for designing flexible pavement for many transportation agencies. In the AASHTO design methodology, the subgrade resilient modulus (MR), applied ESAL (W18), reliability (with its associated normal deviate, ZR), variability (So), loss in serviceability (ΔPSI), and structural number (SN) are used in the nomograph and the corresponding Equation (1) to design thickness of flexible pavements [12] . Figure 2 shows how to use nomograph during design of flexible pavement.
(1) [12]
![]()
Figure 2. AASTHO flexible pavement design nomograph (AASHTO, 1993) [12] .
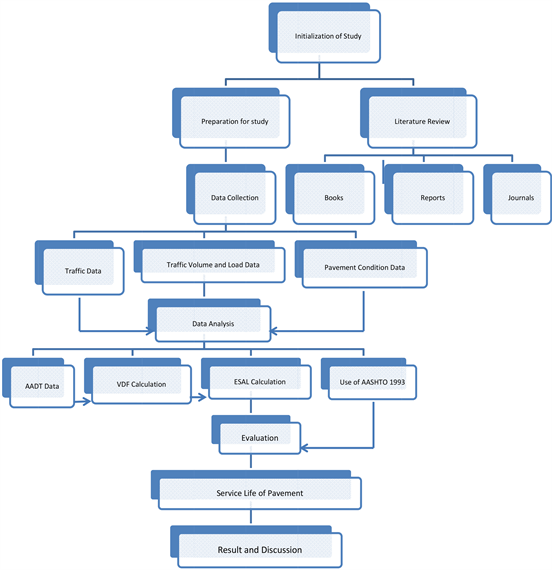
1.8. Methodology of Study
2. Data, Analysis and Results: Axle Load Survey Data

2.1. Analysis of Traffic Data
In this study, analysis of traffic data in the means of calculating average annual daily traffic (AADT) was taken from survey report [4] . The data survey period was 3 days for each direction. Therefore, all traffic analyses in this study were based upon these 3-day traffic data. Vehicles could be categorized into three classes, as light, medium and heavy vehicle [7] . The AADT of heavy vehicles for both directions is as shown in Table 1.
From sample survey data, PCU calculation and traffic listed in survey report the composition of traffic was heavy vehicle 83.76% (in average), medium vehicle 9.18% (in average) and light vehicle 7.05% (in average). The composition of heavy vehicle was found as: 2-Axle 42.53%, 3-Axle 55% and 4-Axle 2.72%. In 2004 there were no 4-Axle heavy vehicles in this road.
From the table, it can be seen that there is relatively no much deviation of AADT for heavy vehicles of 3-axle and 4-Axle than in 2-Axle for both direction as shown in Table 2.
2.2. Determination of Vehicle Damage Factor (VDF)
VDF or axle load equivalency factor (LEF or E) of each heavy vehicle was determined [6] as follows.
(2)
The VDF of front and rear axles for every type of vehicle were calculated based upon the configuration specification as defined [7] .
As seen in Table 4, the total VDF of Narayanghat-Muglingdirection is higher than the opposite direction. The deviation of VDF is mainly contributed by VDF of 2-Axle, 3-Axle and 4-Axle vehicle as shown in Table 3.
2.3. Calculation of Traffic Load
The calculation of traffic load (W18) in equivalent standard axle load (ESAL) should be based on the actual VDF and AADT. Following formula is used to determine the traffic load for design lane [12] . The calculated values are shown in Table 4.
(3)
![]()
Table 1. Traffic data (Source: DoR, RSDP) [4] .
![]()
Table 2. Percentage of overloaded vehicles with respect to standard loading.
![]()
Table 3. Calculated VDF of different classes of vehicles [4] .
![]()
Table 4. ESAL from traffic data [4] .
where:
ADTi = average annual daily traffic for axle load i;
Ei = axle load equivalency factor or vehicle damage factor (VDF) for axle load i;
GRi = annual growth rate (depends on traffic growth rate, g, in percent; and service life, n, inyear) axle load i;
DD = directional distribution factor;
DL = lane distribution factor;
W18 = cumulative standard axle load for two directional.
Road section Narayanghat-Muglingor Mugling-Narayanghatis a two-lane two-direction undivided road, therefore, in this case, DD and DL equal to 0.5 and 1.0, respectively. The traffic load on Narayanghat-Mugling or Mugling-Narayanghatroad section was assumed to increase 6.2% per anuum [13] and the road could serve traffic load for the next 10 years.
In overloaded condition, traffic load of Narayanghat-Mugling direction higher than opposite direction as shown in Table 5.
2.4. Impacts of Overloaded Vehicles
The impact of overloaded heavy vehicles on road pavement that took into account in this study is reduction of pavement service life. The reduction of service life could be indicated by the deviation of the pavement service life due to different magnitude of traffic load that have to withstand by the pavement structure. To calculate the reduction of service life, a relationship between traffic load and service life is able to be developed by using the following equation [12] .
(4)
in which, W18 is the predicted traffic load (in ESAL);
w18 is the traffic load in basic year (in ESAL);
g is vehicle growth rate;
n is Number of years.
The traffic loads in basic year for both conditions (standard and overloaded) are as shown in Table 4. These values and Equation (4) were used to plot predicted traffic load curves in Figure 3 and Figure 4 for Narayanghat-Muglingand Mugling-Narayanghatdirections, respectively.
From calculation, the standard traffic load of Narayanghat-Muglingin 10 years is 34.20 million ESAL, but this number in overloaded condition is reached in 4.10 years (by interpolation). This means that there is about 5.99 years reduction of service life because of overloaded heavy vehicles. Whereas, the standard traffic load of Mugling-Narayanghatin 10 years is 32.82 Million ESAL but Actual traffic load is 17.74 Million ESAL as shown in Table 6. Therefore for Mugling-Narayang hat direction there is no overloaded traffic condition and standard design load is sufficient for the actual traffic load and there is no reduction in service life in this direction. It means that the overloaded condition could reduce the service life about 59.9% in Narayanghat-Mugling direction.
![]()
Table 5. Traffic load (designed and overloaded condition) for next 10 years [4] .
![]()
Figure 3. Service relationship between traffic load and service life on standard and overloaded conditions (Narayanghat-Mugling Direction) [4].
![]()
Figure 4. Relationship between traffic load and service life on standard and overloaded conditions (Mugling-Narayanghat Direction) [4].
2.5. Present Condition of the Road Section
Narayanghat-Mugling road section the rehabilation work is just completed [14] and as per designs, the design traffic was 22.22 million ESAL in both directions. It is more than sufficient for N-S direction but in S-N direction the overloaded traffic seems to be 100.73 million ESAL for 10 years. So, there may be premature failure and could not serve for the full service life along N-S direction due to overloading.
![]()
Table 6. Relationship between traffic load and service lifefrom analysis [4] .
3. Results and Discussions
3.1 Results
From the study and analysis of traffic data of Narayanghat-Mugling Road following points can be concluded:
1) Total traffic (AADT) on Narayanghat-Mugling road was 5963 with 3151 vehicles per day through Narayanghat-Mugling direction and 2812 vehicles per day through opposite direction Composition of traffic was 3193 heavy vehicles, 389 Medium vehicles and 2381 light vehicles. Ratio of directional distribution seemed to be 54% (in average) through Narayanghat-Mugling direction and 46% (in average) through opposite direction.
2) The composition of traffic was heavy vehicle 83.76%, medium vehicle 9.18 %and light vehicle 7.05% (in average).
3) Damaging effect (VDF) of different vehicles is as: Light 0.002, Medium 0.123, 2-Axle 6.14, 3-Axle 15.23 and 4-Axle 28.89 and Cumulative ESAL on Narayanghat-Mugling direction for year 2014 found to be 32.25 million ESAL in overloaded condition but it was only 11.29 million ESAL in standard condition. As per design report submitted by contractor in 2004, CESAL was taken as 22.22 million ESAL for the year 2014 for design.
4) The standard traffic load of Narayanghat-Muglingin 10 years is 34.20 million ESAL, but this number in overloaded condition is reached in 4.10 years. This means that there is about 5.99 years reduction (i.e. 59.9% reduction) of service life because of overloaded heavy vehicles. Whereas, the standard traffic load of Mugling-Narayanghatin 10 years is 32.82 Million ESAL but Actual traffic load is 17.74 Million ESAL in 10 years. Therefore for Mugling-Narayanghat direction the standard design load is sufficient for the actual traffic load and there is no reduction in service life in this direction.
3.2. Discussions
Following recommendations seen to be helpful to control the overloading.
1) As overloading is increasing, it has to be controlled by rules and regulations.
2) Intensity of weight enforcement and the level of penalty only cannot control overloading activities. So fines must be associated with intensified enforcement when considered in further strategy. Enforcement has higher efficiency at the initial stage. However efficiency decreases rapidly when enforcement levels increase gradually. Thus, the balance between level of enforcement and efficiency of enforcement must be considered. Effective means of managing truck overloading is not unitary. It must combine monitoring, inspection, enforcement and punishment as a complete. Regular monitoring, inspection and enforcement are the effective ways to control overloading.
3) Use of technology (Automatic overloading information system) may be the effective way to control the overloading and Design should be done as per the actual traffic loading condition.
Acknowledgements
I would like to thank Department of Roads, RSDP Kathmandu for providing the data. This is a part of my Msc Dissertation in Transportation Engineering, Tribhuwan University, Institute of Engineering, Pulchowk Campus, Nepal.
Abbreviations
AADT = Annual Average Daily Traffic
AASHTO = American Association of State Highway Transportation Officials
AH42 = Asian Highway 42
CBR = California Bearing Ratio
CESAL = Cumulative Equivalent Single Axle Loads
DoR = Department of Roads, Nepal
E = Modulus of Elasticity
ESALs = Equivalent Single Axle Loads
GVW = Gross Vehicle Weight
H05 = Highway 05, Nepal
HMA = Hot Mix Asphalt
HT = Heavy Truck
IRI = International Roughness Index
Ktm = Kathmandu
M&R = Maintenance and Rehabilitation
MaT = Multy Axle Truck
MPa = Megha Pascal
MR = Resilient Modulus
NPV = Net Present Value
NRS = Nepal Road Standard
N-S = North-South Direction
PCU = Passenger Car Unit
PKR = Pokhara
PSI = Pavement Serviceability Index
Psi = Pounds per Square Inch
RSDP = Road Sector Development Project
S-N = South-North Direction
SN = Structural Number
SSRB 2058 = Standard Specification for Roads and Bridges 2058, Nepal
VDF = Vehicle Damage Factor
W18 = Traffic Load for Design Lane
ΔPSI = Loss of serviceability