1. Introduction
In recent years, significant attention has been paid to the financial field in the development of the cryptocurrency market and blockchain technology, because of huge and rapid profits in this sector. This is why caution is required in: using cryptocurrency platforms, as there are many scam schemes and fake platforms, researching the market before investing in any platform or program that promises quick profits, analyzing the platforms from the point of view of legitimacy, as the platforms that legitimate companies should be transparent about how their system works and how profits are made. They should be regulated by financial authorities and have clear options for customer contact and support.
This interest in the development of the cryptocurrency market and blockchain technology has been supported by the involvement of financial institutions and governments, due to the increasingly clear potential to change the fundamentals of the global financial systems of various economic sectors. Thus, institutions such as: banks, investment funds, insurance companies and other traditional participants in the financial sector, show their interest in cryptocurrencies and blockchain by investing in cryptocurrencies or in blockchain projects contributing to the growth of technology development, while financial institutions evaluate how blockchain technology can be integrated into their processes to improve efficiency, transparency and security, and many central banks and governments are exploring the development of their own cryptocurrencies, known as central bank digital currencies (CBDCs), with significant implications for monetary system and for financial transfers. Investors participate in the growth potential of cryptocurrencies by developing a wide range of financial products related to cryptocurrencies, such as investment funds, ETFs (Exchange-Traded Funds), options and futures linked to the price of cryptocurrencies and in this context to ensure a legal market and prevent illegal activities, governments and regulatory organizations around the world are stepping up their efforts to create the legal and regulatory framework for cryptocurrencies and blockchain technology. Many merchants, service providers and online platforms accept cryptocurrencies as a form of payment, which encourages the use of cryptocurrencies in everyday life and therefore financial institutions and financial organizations are increasing their efforts to educate and raise public awareness about cryptocurrencies and blockchain and the right way to invest and use these technologies, because a correct approach involves paying attention to both the positive potential and the risks associated with these technologies.
The paper “Volatility Analysis and Cryptocurrency Interconnections” can bring many benefits and valuable information for investors and for understanding the cryptocurrency market in general. The novelty of this paper is given by the fact that by using the GARCH-BEKK model to analyze the volatility of cryptocurrencies, the paper can help investors better understand the risk associated with these digital assets. At the same time GARCH-BEKK analysis can reveal patterns and trends in cryptocurrency volatility. Also, using the Wavelet technique, we were able to determine the periods in which the three cryptocurrencies influenced each other and how they influenced each other. The paper can provide data and insights to help investors decide how much to allocate to various cryptocurrencies based on their risk tolerance. The paper is structured in several sections as follows: introduction, specialized literature, methodology, data description, obtained results and conclusions.
2. Literature Review
The specialized literature is vast in this field and shows that changes in volatility are observed in the returns of Bitcoin and other cryptocurrencies, due to news and certain unpredictable events. Corbet et al. (Corbet et al., 2020) analyze Bitcoin price volatility using the GARCH (Generalized Autoregressive Conditional Heteroskedasticity) model and investigate the factors influencing volatility.
Cryptocurrencies being relatively new compared to traditional assets, limited from an informational point of view and with regulations that vary from one market to another, can create uncertainty for investors that contribute to market volatility as shown in the specialist study Makarov and Schoar (Makarov & Schoar, 2022) and Corbet et al. (Corbet et al., 2019) who analyzed these aspects of cryptocurrencies with the related risks and speculative characteristics. Cryptocurrency investors are more likely to follow the actions of others than rely on their own analysis due to lack of information or fear of loss. This tendency to align with the movements of the majority can become more pronounced in times of crisis or bubble formation when the general feeling of fear can significantly influence investor behavior (Galariotis et al., 2015) . Volatility when it suddenly increases or decreases in a significant way and Bitcoin is known for these changes, as with technological changes in the Bitcoin infrastructure, it produces a significant impact on prices and returns (Thies & Molnár, 2018) . The rapidly evolving digital asset market offers new trading strategy opportunities for various speculators and entrepreneurs, and many papers suggest that cryptocurrency markets are not homogeneous (Yousaf & Yarovaya, 2022) .
Beneki, Koulis, Kyriazis and Papadamou (Beneki et al., 2019) , using bivariate GARCH models and VAR models, demonstrated that between two cryptocurrencies such as Bitcoin and Ethereum there is a unidirectional relationship and more than that, the authors observed the possibility of drawing up profitable trading strategies using tools volatile derivatives in a newly developed market, with effects on market efficiency.
According to the research carried out by Anghel et al. (Anghel et al., 2022) , high levels of volatility in financial markets during the pandemic were identified, as well as close connections and significant correlations between certain financial markets. These findings motivated us to conduct a similar study in this paper to examine whether such connections and interdependencies exist in the cryptocurrency market as well.
3. Methodology
Due to investors interested in the transmission effects of volatility, this represents one of the most debated topics, a fact observable in the vast specialized literature (Clements, Hurn, & Volkov, 2015; Ngunyi, Mundia, & Omari, 2019; Panagiotidis et al., 2022; Sakthivel, Bodkhe, & Kamaiah, 2012) . Volatility transmission, or the phenomenon of “spill-over volatility”, refers to how changes in volatility in a certain financial asset or financial market affect volatility in other assets or on other markets. This concept is especially important due to interconnected financial markets such as forex, stocks, bonds, and cryptocurrencies. The transmission of volatility can come from a variety of factors and interactions between markets such as: market events and news, speculative transactions and arbitrage, liquidity, and contagion between different markets, but also global and macro-economic factors. For cryptocurrencies, volatility transmission can be significant due to their unique characteristics and the highly dynamic market sentiment that relates to the extent to which the prices of these digital currencies vary over a given time frame.
Cryptocurrencies, such as Bitcoin, Ethereum and others, are known for their high volatility, which means their prices can rise or fall significantly in a short period of time. The volatility of cryptocurrencies is caused by a multitude of factors such as: the existence of a market that is not regulated in a similar way to traditional markets, intense speculation, limited liquidity, but also by market events that can strongly influence the prices of cryptocurrencies. For example, regulatory, security or mainstream adoption news can affect volatility in a cryptocurrency and have spillover effects in other cryptocurrencies or traditional markets.
Using the correlation coefficient formula, it was possible to observe the relationship between the three cryptocurrencies used: Bitcoin, Cardano and Stellar. The characteristic formula of the correlation coefficient model according to Pearson (Pearson, 1985) is:
(1)
where: r represents the correlation coefficient; n represents the number of observations; x represents the first variable and y represents the second analyzed variable.
Observing the influence between the three analyzed cryptocurrencies: Bitcoin, Cardano and Stellar was carried out by calculating the degree of correlation between the data.
Using multivariate modeling, it is possible to observe the influence of past volatility on current volatility and the so-called volatility spillover effects, which are used to illustrate the transmission of volatility from one market to another (Engle & Kroner, 1995; Bollerslev, 1990) and for this paper, between the vast models that make up the multivariate GARCH family, we use the BEKK model, more precisely the GARCH-BEKK (1,1) model.
The BEKK model (Baba, Engle, Kraft, & Kroner, 1985) is a method used in the analysis of financial volatility and in modeling the covariance matrix of volatility over time of several variables.
This model extends the ARCH (Autoregressive Conditional Heteroskedasticity) model and the GARCH (Generalized Autoregressive Conditional Heteroskedasticity) model, allowing for more complex analysis of volatility in the context of multiple variables. The characteristic formula of the BEKK model is:
(2)
where:
is considered a lower triangular matrix, and its multiplication by its transpose
forms a product that represents the intercept of the volatility covariance matrix. The matrix
is positive semidefinite, and in the context of the BEKK model, this matrix can reflect the level of constant volatility. Matrix
represents the effect of shocks on volatilities, and the term
indicates how past changes in volatility, represented by
, affect the volatility at the time t. Matrix
, represents the impact of volatilities on the conditional variance. The term
shows how the covariance matrix of prior volatility,
, influences the evolution of the volatility covariance matrix at the time t.
Observing the influence between the three pairs of analyzed cryptocurrencies: Bitcoin-Cardano, Bitcoin-Stellar and Cardano-Stellar, and capturing the volatility was carried out using the GARCH-BEKK model together with the VAR-COVAR graphs resulting from the application of the model.
The wavelet transform has its roots in Fourier analysis, but there are important differences because wavelets are mathematical expansions that transform time-domain data into different layers of frequency levels. The wavelet scalogram is a graphical representation of the signal as a function of frequency and time, obtained by applying the continuous wavelet transform to the signal. This plot is used to highlight certain patterns or trends in the signal that cannot be seen in other plots, such as the Fourier transform. The wavelet scalogram is a three-dimensional representation of the signal, where the horizontal axis is the area, the vertical axis is the frequency area, and the color intensity is the amplitude area of the signal. In general, more intensely colored areas indicate greater signal amplitude, which may indicate the presence of significant patterns or trends in the analyzed data. To obtain a wavelet scalogram, the signal must firstly be decomposed into scaled and translated wavelet functions, using continuous wavelet transform. The formula for the continuous wavelet transform is:
(3)
where:
represents the input signal
is the basic function of the wavelet, a and bare the scaling and translation parameters, respectively.
This decomposition generates a series of wavelet coefficients, which indicate how well the original signal corresponds to different frequency and time levels, and the coefficients are then plotted in a wavelet scalogram, using colors to indicate the amplitude of the signal. The formula for the wavelet scalogram is:
(4)
where:
is the
value of
at scale a and position b. The absolute squared value of
represents the power or energy of the signal at that particular scale and position.
4. Data Description
To capture the transmission effects of volatility on a volatile market like that of cryptocurrencies, we chose to show the price evolution and study the behavior of three well-known cryptocurrencies: Bitcoin (BTC), Cardano (ADA) and Stellar (XLM) over a period of approximately six years (2017-2023). The data with daily frequency was collected from Yahoo Finance1, and the returns were calculated on them, applying the logarithm formula.
Through Figure 1 we graphically represented the evolution of the daily prices of the three analyzed cryptocurrencies in the period from November 2017 to August 2023, from which two significant periods in their evolution can be clearly distinguished, namely: the period 2017-2018 and the period 2021-2023. In the highlighted periods, the most affected cryptocurrencies were Bitcoin and Cardano (with sudden price increases and decreases in the period 2021-2023), the Stellar cryptocurrency showing a much higher level of volatility in the period 2017-2018 compared to the current period 2021-2023.
![]() Source: Data collected from Yahoo Finance—author’s own processing and calculations.
Source: Data collected from Yahoo Finance—author’s own processing and calculations.
Figure 1. Evolution of daily returns for Bitcoin, Cardano and Stellar (2017-2023).
According to public information from the analyzed period, the sudden increase in volatility in the case of Bitcoin could be based on certain events and factors such as: increased interest in Bitcoin through investments by large companies and financial institutions, such as the purchases made by Tesla and MicroStrategy, but also the decisions of the regulatory agencies regarding the legality and regulation of Bitcoin, or the major updates of the Bitcoin network (Taproot update).
Other events that helped to increase volatility may be the news and media outlets that had information about Proshare’s introduction of the Bitcoin Strategy ETF (exchange-traded fund) in 2021, at which time the price of Bitcoin experienced a sharp rise, due to investors who took advantage of the chance to gain exposure to a cryptocurrency, causing a price spike followed by a sharp drop caused by the futures link between the ETF (exchange-traded fund) and Bitcoin.
In the period 2021-2023 as it appears from public information, Cardano (ADA) recorded significant volatility due to a factor often encountered in the cryptocurrency market, when investors participate in the market with the aim of speculating, i.e. to obtain quick profits, work which can lead to sudden price changes as prices are often driven by market sentiment and trading movements. The novelty and uncertainty brought by this relatively newly appeared cryptocurrency, during the period captured on the graph, which is in the process of developing and implementing some key technologies, such as Alonzo updates and smart contracts, may be factors that contribute to the increased volatility in analyzed period. The events that took place during this period on the crypto market were a key factor in increasing volatility, through government announcements and regulations, and had a strong impact with sudden and unpredictable movements in the price of cryptocurrencies.
The correlation between the cryptocurrencies, Bitcoin and Cardano, in Table 1, shows the influence of the prices of the Cardano cryptocurrency. During 2021-2023, Cardano made significant efforts to drive its adoption and use as a platform for the development of decentralized applications (i.e. DApps) and smart contracts, efforts with a significant impact on investor interest and price.
Table 1. Correlation between cryptocurrencies: Bitcoin, Cardano and Stellar.
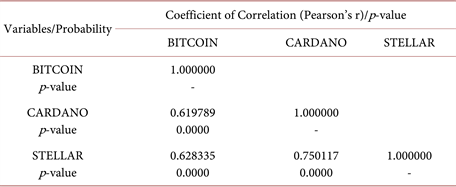
Source: Data collected from Yahoo Finance—author’s own processing and calculations.
By determining the degree of correlation between the cryptocurrencies analyzed in Table 1, we wanted to highlight the correlation between the three cryptocurrencies, and what can be observed is that during the chosen period there are quite strong positive correlations between the three cryptocurrencies, the strongest correlation being it is between Cardano and Stellar (0.750117), followed by Bitcoin-Stellar (0.628335) and Bitcoin-Cardano (0.619789).
5. Results and Discussion
For the analysis of the three pairs of cryptocurrencies, we will illustrate the results of the descriptive statistics as well as the stationarity tests related to each cryptocurrency.
The results obtained in Table 2 show that on average the yields of the three cryptocurrencies are positive (0.057263—Stellar Return’s, 0.067015—Bitcoin Return’s, 0.104277—Cardano Return’s), which means an upward trend. From the point of view of asymmetry, the Stellar and Cardano cryptocurrency returns show a positive asymmetry to the right (1.015536 respectively 1.981095), while the Bitcoin return shows a negative asymmetry to the leftwith a value of −0.811613.
Table 2. The results of descriptive statistics and stationarity tests.
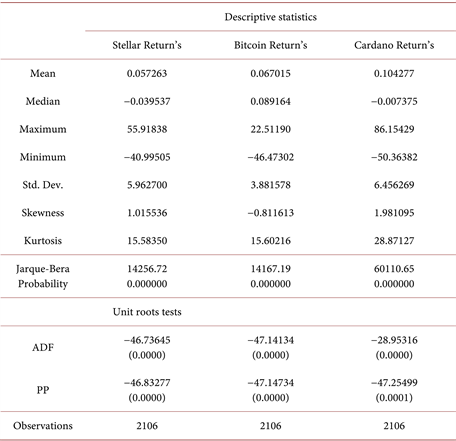
Source: Data collected from Yahoo Finance—author’s own processing and calculations.
As a distribution, all three cryptocurrencies show a leptokurtic distribution with values that exceed the value of 3, and from the perspective of the Jarque-Bera test, it can be said that the data do not come from a normal distribution.
Analyzing the results obtained from the two stationarity tests Augmented Dickey-Fuller-ADF (Fuller, 1976) and Phillips Peron—PP (Phillips & Perron, 1988) it is observed that the data series are stationary with probabilities of 0.0000, probabilities that do not exceed the level of 0.05. To apply the BEKK model, we used the yields of the three pairs of cryptocurrencies identified and created following the result of the correlation illustrated in Table 1.
From a statistical point of view, in Table 3, most of the coefficients are statistically significant with probabilities lower than the threshold of 0.05. The results obtained from the GARCH-BEKK model applied in both directions show through the parameters
and
that there is a significant relationship between the conditional volatility of the two cryptocurrencies (Bitcoin and Cardano), even if this relationship is not very strong. Specifically, for Bitcoin-Cardano the value for
is 0.022831 (prob. 0.0004) and
is 0.017802 (prob. 0.0000), while for Cardano-Bitcoin,
is 0.014266 (prob. 0.0001) and
is 0.018893 (prob. 0.0071). Because
is significantin both cases (Cardano-Stellar and Stellar-Cardano) with values of 0.007282 (prob. 0.0388) respectively −0.003829 (prob. 0.0182), a bidirectional link is observed from Cardano to Stellar and vice versa.
![]()
Table 3. Results of the GARCH-BEKK model.
Source: Data collected from Yahoo Finance—author’s own processing and calculations.
Parameters
,
,
show statistically significant values, which shows that there is variation in the covariance between the time series, the values associated with each cryptocurrency pair being: Bitcoin-Cardano (
= −0.691920 and prob. 0.0000;
= −0.858720 and prob. 0.0000;
= 0.964550 and prob. 0.0000), Cardano-Bitcoin (
= 1.519268 and prob. 0.0000;
= 0.803766 and prob. 0.0000;
= 0.457727 and prob. 0.0000), Bitcoin-Stellar (
= −0.869398 and prob. 0.0000;
= −0.578287 and prob. 0.0000;
= 0.921172 and prob. 0.0000), Stellar-Bitcoin (
= 1.293862 and prob. 0.0000;
= 0.569801 and prob. 0.0000;
= 0.609136 and prob. 0.0000), Cardano-Stellar (
= 1.186390 and prob. 0.0000;
= 0.774472 and prob. 0.0000;
= 0.606751 and prob. 0.0000), Stellar-Cardano (
= −1.190646 and prob. 0.0000;
= −1.871089 and prob. 0.0000). More specifically, the fact that almost all three parameters are statistically significant, shows that the three cryptocurrencies had both significant negative and positive simultaneous shocks and therefore asymmetric effects, which suggest the existence of a higher correlation between them in periods of volatility or significant changes of price.
If the sum of the product (
) and product (
) consists of a positive value, then it means that the yields of the two cryptocurrencies have undergone simultaneous negative changes. In the present case only with a value of 0.169415141, it can be said that Bitcoin and Cardano suffered simultaneous negative shocks during the analyzed period (observable also from Figure 1). Paradoxically, although the shock is a negative one, the price of Bitcoin and Cardano has increased. This is defined as a temporary increase in the price of cryptocurrencies, mainly due to haven investments, speculation, and market manipulation. This phenomenon was observed also by Wang, Liu and Wu (Wang et al., 2022) .
Analyzing the propagation of volatility and shocks between cryptocurrency pairs, strong cross-cutting effects can be observed between the yields of the three cryptocurrencies. This fact, as well as the volatility interconnections, can be seen by the fact that the parameters
,
,
in most cases are statistically significant.
Parameters
,
,
show the effects caused by positive or negative changes in the returns of one cryptocurrency on the covariance of the other cryptocurrency. Analyzing the results in Table 3, in most cases they show positive and significant values, which denotes positive changes in the yields of Bitcoin, Cardano and Stellar cryptocurrencies one over the other. The estimates of the three parameters are mostly positive and significant, which denotes connections between the three cryptocurrencies.
Finally, the graphs of the conditional correlations between the three different cryptocurrency pairs are shown in Figure 2. The graphs come as a confirmation of the dynamic conditional correlations between the three cryptocurrency pairs. Both positive and negative values can be observed in the graph, but mostly there are strong positive correlations, as other authors such as Katsiampa et al. (Katsiampa et al., 2019) discovered. By using the technical and analytical Wavelet method we wanted to examine the signals and identify their different features at various levels of detail and frequency. As a methodology of this technical method, we can say that the method involves breaking down the signal into different levels characteristic of different frequencies. Each level is perceived as a frequency band that can be analyzed separately to identify the characteristics of the signal at that frequency band. After applying the technical and analytical Wavelet method, the graphs illustrated in Figure 3 emerged.
![]()
![]()
![]() Source: Data collected from Yahoo Finance—author’s own processing and calculations.
Source: Data collected from Yahoo Finance—author’s own processing and calculations.
Figure 3. Wavelet coherence analysis between Bitcoin, Cardano and Stellar.
Thus, in Figure 3, in the chart between Bitcoin and Cardano, it can be seen how the blue color is predominant in the short term, which shows a low amplitude and therefore the absence of a high correlation between the two cryptocurrencies. However, we can say that, following the two more pronounced reddish spectra, two periods 2017-2018 and 2019-2023 are observed, periods that coincide with the periods detected in Figure 1. In the period 2017-2018, according to the reddish spectrum, an inversely relationship can be observed between the two cryptocurrencies, meaning that Bitcoin’s changes over time are inversely correlated with Cardano’s changes over time, suggesting that changes in Bitcoin are associated with opposite changes in Cardano.
Looking at the predominant reddish spectrum from 2019-2023, in the medium term according to the arrows pointing to the right in the wave coherence analysis, it indicates a positive coherence between the two-time series. This means that the time variations of Bitcoin are correlated in the same direction as the time variations of Cardano, which suggests that changes in the Bitcoin cryptocurrency are associated with similar changes in Cardano and therefore there are cyclical effects of the price of the Bitcoin cryptocurrency on the price of the Cardano cryptocurrency. Analyzing the connection between Bitcoin and Stellar, the blue color spectrum is predominant both in the long term and in the medium term, which shows the absence of correlation between the two cryptocurrencies. In the chart made for Bitcoin vs Stellar, three periods can be distinguished 2017-2018, 2019-2020 and 2021-2023 which have a predominant red color. Analyzing the three periods it can be said that in the period 2017-2018 Bitcoin and Stellar registered positive correlations in the same direction, something that cannot be said in the case of the other two periods because judging by the direction of the arrows we can state that in the period 2019-2020 and between 2021-2023 the two cryptocurrencies had an inverse relationship.
And last but not least from the point of view of the relationship between Cardano and Stellar, it can be observed that the blue color spectrum is quite a bit predominant in the short and medium term, instead in the long term periods such as 2018-2019, 2019-2020, 2020-2021, 2021-2023 in which the two cryptocurrencies registered a positive relationship influencing each other in the same direction (2018-2019 in the short term, 2019-2020, 2021-2023 both in the short, medium and long term) as inverse relationship (2018-2019 and 2020-2021).
6. Conclusion
Through this research, we were able to find that historical events and news have had a significant impact on the price volatility of the examined cryptocurrencies. The obtained results brought to light convincing evidence of the simultaneous transmission of negative shocks between Bitcoin and Cardano in the period 2021-2023, these shocks leading to temporary price increases, as suggested by available public data. Likewise, the correlation analysis of cryptocurrency returns in Table 1 revealed significant positive correlations among the three cryptocurrencies over the selected period. The strongest correlation was observed between Cardano and Stellar (0.750117), followed by Bitcoin-Stellar (0.628335) and Bitcoin and Cardano (0.619789). This research explores the complex dynamics of three prominent cryptocurrencies: Bitcoin, Cardano, and Stellar, offering a comprehensive analysis aimed at providing essential knowledge to investors. In line with investors' expectations, our research meticulously examines the correlations between these cryptocurrencies, revealing compelling findings. Notably, Cardano and Stellar exhibited a robust positive correlation of 0.750117, indicating a significant relationship between the two. Investors seeking practical guidance will find our research instrumental. By unraveling the complex interconnections among these cryptocurrencies, we provide a valuable resource to help investors navigate the intricate world of digital assets. Our study extends beyond simple observations, providing guidance backed based on data to assist investors in making informed decisions. The positive correlations identified signify potential investment opportunities and risks that investors should consider in their portfolio allocations. By focusing on Bitcoin, Cardano, and Stellar, we provide a nuanced perspective, giving readers actionable insights to guide their investment strategies.
Another aspect highlighted is the high volatility of cryptocurrencies and their sensitivity to economic, financial, and technological news and events. For this reason, and due to the relatively new and partially regulated nature of the cryptocurrency market, a comprehensive analysis of volatility in this market using dynamic models, such as those of the GARCH family and bivariate GARCH models, was required. The use of the bivariate GARCH model made it possible to trace the relationships between the conditional volatilities, as well as to analyze the propagation of volatility and shocks between the analyzed cryptocurrency pairs.
In addition, through the VAR-COVAR graphs generated within the multivariate GARCH model, the periods were identified in which dynamic conditional correlations between cryptocurrencies are manifested, either positive or negative, information verified through the Wavelet coherence analysis. The results obtained from the GARCH-BEKK model applied in both directions showed that there is a significant relationship between the conditional volatility of the two cryptocurrencies (Bitcoin and Cardano), even if this relationship is not very strong. Also, the results showed a bidirectional link from Cardano to Stellar and vice versa.
With a value of 0.169415141, we concluded that Bitcoin and Cardano suffered simultaneous negative shocks during the analyzed period (observable also from Figure 1). Paradoxically, although the shock is a negative one, the price of Bitcoin and Cardano has increased. This is defined as a temporary increase in the price of cryptocurrencies, mainly due to haven investments, speculation, and market manipulation. By using the technical and analytical Wavelet method we wanted to examine the signals and identify their different features at various levels of detail and frequency and what could be observed is that there are indeed periods in which the three cryptocurrencies have had a positive influence in the same direction in the medium and long term, such as the period 2021-2023, but also periods in which the pairs of cryptocurrencies have inversely influenced such as the 2018-2019 periods. To further understand the cryptocurrency market, it is important to explore other relevant aspects that can make a significant contribution to the existing literature in the field. Although we have taken an in-depth look at cryptocurrency market volatility and the relationships between three cryptocurrencies: Bitcoin, Cardano, and Stellar, there are still aspects that can be explored to fully complete the understanding of this dynamic field. Thus, in the future, prospects for expanding the research to other cryptocurrencies and evaluating their impact on market dynamics can be considered. Considering that the cryptocurrency market is in continuous development, new research could be based on the use of additional mathematical models and statistical analyzes to better identify and interpret the complex phenomena of the cryptocurrency market. Deeper investigation of the influence of external factors, such as economic and political events, on the volatility and behavior of cryptocurrencies could constitute a research direction to extend the present analysis.
NOTES
1Yahoo Finance is one of the most well-known and used platforms for providing financial information and market data. The authority and accuracy of the data provided by this platform depends on its credibility and integrity. We note that we have no direct control over the process of data collection and processing by Yahoo Finance and that the assessment of their accuracy is largely based on the reputation and experience of this platform in providing financial data.