Perspectives and Experiences of Education Stakeholders: A Quantitative Study on the Adoption of Artificial Intelligence in Executive Training Using Structural Equation Modeling ()
1. Introduction
Artificial Intelligence (AI) is increasingly involved in developing teaching methods and training future teachers and instructors. Some studies have focused on the use of AI systems to personalize teaching by providing precise feedback on student performance and adapting educational content to their specific needs. Additionally, other research has explored the use of chatbots and virtual assistants to offer individualized support to students by answering their questions and guiding them in their learning.
Artificial intelligence (AI) plays an increasingly important role in the development of teaching methods and in training future professionals in the field of education and vocational training. However, the success of Artificial Intelligence in Regional Centers for Education and Training Professions (CRMEFs) will depend on the acceptance of this technology by various users.
Indeed, the use of artificial intelligence in Regional Centers for Education and Training Professions has the potential to enhance the effectiveness of teaching and training, enabling personalized education for each young professional at the CRMEF.
In this context, artificial intelligence in Regional Centers for Education and Training Professions encompasses several areas, such as analyzing trainees’ data to identify training gaps, tailoring the training path for each young professional based on their abilities and individual needs, and providing immediate and accurate responses to the questions of these young professionals.
This approach seems to be the future of professional training because it has the potential to transform how we educate young professionals. Moreover, the increase in the number of young professional trainees within CRMEFs leads to a higher workload for instructors. Therefore, the ability to handle large amounts of data and provide real-time analyses becomes crucial. In this context, the use of modern technologies like artificial intelligence proves to be indispensable [1] .
However, the adoption of artificial intelligence for the development of services in leadership training centers sometimes poses pedagogical issues, as it cannot entirely replace traditional training for professionals. Skills such as teaching methods, communication, and decision-making can only be acquired through practice and experience. Yet, artificial intelligence could bring numerous advantages to professional training [2] . As technology (AI) evolves, a chatbot utilizing artificial intelligence could become increasingly accurate in addressing specific queries or requests from young professional trainees [2] . This leads us to question what would motivate young professional trainees to engage in the process of artificial intelligence. It’s about understanding the attitudes of these trainees toward this technology and their motivations to identify factors that could accelerate the adoption of artificial intelligence. The objective of this article is to study the factors that influence the acceptance of artificial intelligence by young professional trainees at Regional Centers for Education and Training Professions.
2. Conceptual Frame
Venkatesh et al. (2003) [3] underline the tendency of empirical studies on technology adoption to select a specific model, often overlooking the contributions of parallel research (p. 426). To address this dispersion in research, they conducted a synthesis of the main models concerning the individual acceptance of information and communication technologies (ICT), leading to the creation of the Unified Theory of Acceptance and Use of Technology (UTAUT). This theory stems from conceptual and empirical similarities observed among six previously studied models: the Theory of Reasoned Action (TRA) (Ajzen and Fishbein, 1975) [4] , the Theory of Planned Behavior (TPB) (Ajzen, 1991) [5] , Social Cognitive Theory (Bandura, 1989; Compeau and Higgins, 1995) [6] , the Diffusion of Innovations Theory (Rogers, 1962), the Theory of Interpersonal Behavior (Triandis, 1980) [7] , and the Technology Acceptance Model (TAM) (Davis, 1989) [8] . Each of these models seeks to predict user behavior based on different independent variables. By consolidating the conceptual and empirical similarities of these six models, a unified theory was developed.
In this context, four researchers (Venkatesh, Morris, Davis, and Davis) come together to examine technology acceptance models.
Venkatesh (2003) specifies that empirical studies on technology adoption often boil down to choosing a single model, largely disregarding contributions from parallel research (p. 426). To address the dispersion in research on technology adoption, Venkatesh (2003) conducted a synthesis of the main models of individual acceptance of ICT to develop a Unified Theory of Acceptance and Use of Technology (UTAUT). The UTAUT model has significantly enhanced the understanding of technology adoption mechanisms. The latter fits within the lineage of intention models, focusing on the individual level of technology acceptance. Furthermore, there is feedback between usage and individual reactions. The intention to adopt a technology and its usage are considered interdependent constructs, and UTAUT (2003) focuses on their determinants. The UTAUT comprises four determinants of user intention and four moderators that are deemed to moderate the effect of the four determinants on behavioral intention. UTAUT posits that perceived ease of use, perceived usefulness, social influences, and facilitating conditions are direct determinants of behavioral intention. This significantly enhances the explanatory power of the model. Similarly, the moderating variables (gender, age, experience, and usage context) are highly important in understanding the characteristics of different user groups. Venkatesh (2003) indicate that UTAUT has the ability to explain approximately 70% of the variance in intention. It has been demonstrated that UTAUT outperforms previous models (Venkatesh, 2003). Furthermore, it can provide a useful tool for managers to assess the success of new technology (Ibrahim & Jaafar, 2011).
3. The Model
In this section, we will discuss the constructs of the proposed model.
3.1. Expected Performance
Venkatesh (2003) defined performance expectancy as the degree to which an individual believes that using a system will help them achieve performance gains at work. Similarly, Moore and Benbasat (1991) [9] highlighted in the field of information systems that refers to the “degree to which an innovation is perceived as offering an advantage superior to the practice it supplants.” Several studies on technology adoption have demonstrated that the concept of perceived usefulness holds a very strong predictive power and has proven its robustness in explaining usage behavior across numerous studies. Drawing from a large body of subsequent empirical studies, the researchers behind the UTAUT model illustrate that perceived usefulness is the primary determinant of the intention to use a system.
The perceived utility of artificial intelligence remains significant among young intern executives in regional centers for teaching and training professions, especially when it demonstrates advantages over other forms of training, notably traditional education.
Ultimately, artificial intelligence can only be embraced by a young intern executive if they believe that using this technology will help them achieve performance gains in their teaching practices. Finally, we have identified perceived utility as the determinant of the intention to use this technology among young intern executives. The resulting hypothesis is presented as follows:
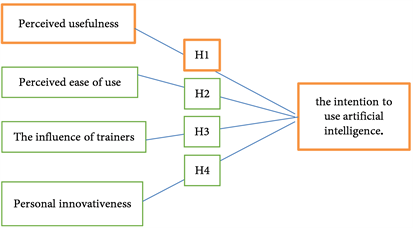
Hypothesis 1: Perceived utility has a positive influence on the intention to adopt artificial intelligence.
3.2. Expected Effort (Perceived Ease of Utility)
Venkatesh (2003) defined perceived effort as the degree of ease associated with using the system. However, specifically at the onset of using the technology or during the discovery phase, the perceived ease of use remains a paramount factor in the adoption of this technology. On the other hand, perceived ease of use is compared to the concepts of “compatibility” and “complexity” derived from Rogers’ (1995) [6] theory of diffusion of innovations. This is why they define the same notion of ease of use and measure it in the same way. In Birch’s [10] study on the acceptability of ICT among a group of 82 students engaged in a teaching professionalization program, perceived ease of use is also the only factor for which a significant link could be established with the intention to use ICT in the field of education.
So, perceived ease of use appears to be the primary factor influencing the intention of young intern executives at the CRMEF to engage with artificial intelligence. The hypothesis we propose is presented as follows:
Hypothesis 2: Perceived ease of use positively influences the intention to adopt Artificial Intelligence.
3.3. Social Influence
Venkatesh (2003) defined social influence as the extent to which an individual perceives it to be important that others believe he or she uses the new system. According to subsequent empirical studies, researchers (Venkatesh, 2003), who developed the UTAUT model, demonstrate that social influence is then a construct directly linked to intention.
In this study, social influence refers to the influence of trainers at the CRMEF, defined as the extent to which trainers directly encourage their trainees to use artificial intelligence. Trainer influence is a crucial factor in motivating trainees to adopt new technologies in their learning environment. This has led to testing the following hypothesis:
Hypothesis 3: Trainer influence has a positive effect on the intention to use artificial intelligence.
3.4. Innovativité Personnelle (PI)
The concept of Personal Innovativeness (PI) is used to measure an individual’s ability to generate new ideas and apply them in practical contexts. Personal Innovativeness (PI) is a concept developed by Agarwal and Prasad in 1998 [11] . It refers to an individual’s ability to generate new ideas and apply them in practical contexts. This ability is considered a personality trait that can be measured using assessment scales. They suggest that individuals with a high level of innovativeness are more inclined to adopt positive ideas and changes in new information technologies and have a greater capacity to cope with uncertainty compared to those with a lower level (Lu, Yao, and Yu, 2005) [12] . It is expected that young trainee executives at the CRMEF with a high level of personal innovativeness will take more risks and have a more positive intention to use artificial intelligence in their training. This has led to testing the following hypothesis:
Hypothesis 4: Personal Innovativeness has a positive effect on the intention to use artificial intelligence.
Thus, our research model can be presented as follows:
4. Research Methodology
After the questionnaire for our research was developed based on a synthesis of previous studies on information system adoption, the items used were drawn from the literature, particularly from the work of Venkatesh (2003). Each variable in the model was assigned a set of items drawn from the information system literature. Modifications were made to the selected items to adjust them to the context of artificial intelligence adoption among young professionals at the CRMEF.
The constructs and selected items to evaluate each variable are summarized in Table 1.
The questionnaire consisted of 17 items measuring five constructs. This study used convenience sampling technique to collect the data. Indeed, the questionnaire for our research was distributed among a wide population of young professionals from the CRMEF, which is part of the Ministry of National Education.
![]()
Table 1. Table of constructs and selected items.
Respondents were asked to express their opinions using a 5-point Likert scale as follows: —Strongly Disagree, —Disagree, —Neutral, —Agree, —Strongly Agree.
Thus, we adopted this approach for the young professional trainees at the CRMEF to ensure a substantial number of responses, thereby maximizing the validity and relevance of subsequent statistical analyses. The questionnaire was distributed among 210 young professional trainees from the CRMEF spread across the entire national territory.
Out of the 210 distributed questionnaires, we collected 173 responses, accounting for 83% of the total. Below, we summarize the descriptive statistics of the final sample in Table 2.
5. Main Results
Our data analysis process involves three steps:
● A step for validating the measurement instruments.
● An evaluation step of the measurement model to check if the model fits well with the collected data.
● A step to assess the quality of the structural model using hypothesis tests.
5.1. Validation of Measurement Instruments
Before formulating the items for our measurement scales, we followed the procedure for testing the measurement instruments (Churchill, 1979) [12] . Regarding the step of refining the measurement instrument, we utilized two techniques: Factor analysis and the alpha-Cronbach coefficient [13] .
To develop data adequacy criteria for validating the measurement scales, as well as refining the measurement instruments, we used two techniques:
● Factor analysis.
● Internal reliability test.
The Principal Component Analysis (PCA) is commonly used to refine and test the homogeneity of scales within a questionnaire. We thus tested the unidimensionality of the constructs under study. This aims to verify if the scale accurately and exclusively measures the construct it’s intended for. It helps explore the factorial structure and check the internal consistency of the scales.
Internal consistency refers to the extent to which the responses of the respondents to the questionnaire items are consistent with one another.
We will subject the scales to factor analysis, and based on the results obtained,
![]()
Table 2. Composition of the final sample.
items will be eliminated to enhance the measuring tool. Then, we will test the internal reliability of the scales.
Gerbing and Anderson [14] emphasize that exploratory factor analysis is a preliminary technical step in “constructing a measurement scale” (p. 189). Its primary purpose is to translate and explain the underlying dimensions of the construct.
For internal validity, we will test the unidimensionality or multidimensionality of a measurement scale through principal component analyses (PCA) using SPSS 19.0 software.
Igalens and Roussel specify that [15] “if the concept is unidimensional, all the items used to measure it will form a single factor in the factor analysis” (p. 207) and according to Perrien and Zins [16] “factor analysis makes it possible to evaluate the ability of items to perfectly and uniquely measure a construct”.
To do this, we retained certain criteria when analyzing the results:
● To check the factorization of the data, we examined the Kaiser-Meyer-Olkin (KMO) measure, often referred to as KMO, which expresses the ratio between the variable correlations and partial correlations. Malhotra, Decaudin and Bouguerra [17] emphasize that this index should be higher than 0.5 for the data to be factorable.
● The interpretations of factor analyses require the examination of the Kaiser criterion, according to Evrard, Pras, Roux, and Choffray [18] “It is necessary for its eigenvalue to be greater than one. This criterion provides valuable insight regarding the number of factors to retain”. The eigenvalue expresses the variance explained by the common factors, as Evrard et al. point out (2003) [15] “To only consider factors corresponding to eigenvalues greater than 1”, Afterward, only axes with an eigenvalue greater than or equal to 1 are retained.
● The interpretation of the axes requires examination of the factor loadings and item communalities. The study of communalities, which measures ‘the portion of variance in the variable explained by the retained factors,’ as specified by Evrard, Pras, and Roux. (2003) is to be considered during the condensation of scales. Jolibert and Jourdan [19] point out that the minimum threshold is 0.5 on a single axis, similarly Pichon [19] states that this test conducted for each item should result in the deletion of the item when the variance explained by the principal axes is less than 0.5.
● Additionally, items with communalities below 0.5 and those that alone form a factor should be eliminated.
The exploratory analysis reveals consistency among the scale items; their KMO value is above 0.5, and the representation quality and variance percentages are good. The reliability test yields a Cronbach’s alpha exceeding 0.6, according to Nunnally’s [20] standard, indicating consistency among the scale items.
Table 3 relates to the validation of measurement instruments.
![]()
Table 3. Summary of the results of the validation of measuring instruments.
5.2. Evaluation of the Measurement Model
The construction of the model, the evaluation of the measurement model, and the assessment of the structural model are conducted based on the graphical interface and validation techniques of the Smart PLS 2.0 software. To study the reliability and validity of the measures, we will present the results along two axes:”
● The first axis involves presenting the results of item reliability, construct reliability, and convergent validity.
● The second axis involves presenting the results of discriminant validity.
5.2.1. Reliability and Convergent Validity of the Measurement Model
Convergent validity was assessed using three criteria recommended by Fornell and Larcker (1981): loading greater than 0.50; the composite CR reliability greater than 0.7 and the convergent validity index (CVI) should exceed 0.50.
Table 4 refers to the reliability measure of the items.
The results from Table 4 show that all the items and constructs of the model meet the reliability and convergent validity criteria of the measurement model (loading > 0.70), construct reliability (C.R > 0.70), and convergent validity (A.V.E > 0.5).
5.2.2. Discriminant Validity
Discriminant validity is also verified using the Fornell and Larcker’s rules, which suggest that the proportion of extracted variances for each construct should be greater than the square of its correlation coefficients with other constructs in our research model.
The main indicators for the discriminant validity of the constructs of the model can be summarised in Table 5.
The results from Table 5 show that the square root of the Average Variance Extracted (AVE) for each construct (values on the diagonal) is greater than the elements in the corresponding rows and columns. This reveals that each construct is more strongly related to its own measures than to those of other constructs (Fornell & Larcker, 1981), indicating discriminant validity among the different constructs.
![]()
Table 4. Results of reliability and convergent validity of the measurement model.
![]()
Table 5. Correlation squares between constructs and AVEs (on the diagonal).
5.2.3. Structural Model Quality
The overall quality of the model can be assessed by examining the coefficients of determination (R2) (Lohmoller), which account for the explained variance of endogenous variables, and by ensuring that the validation of the measurement model has been carried out to verify the validity and reliability of the measurement scales for the constructs.
Validity and magnitude of structural coefficients are used to assess the significance of the effects.
Falk and Miller suggest that a “good model” obtained through Partial Least Squares (PLS) regression should have determination coefficients (R2) greater than 0.1.
Similarly, Santosa et al. suggest that all R2 values should meet a minimum threshold of 0.10.
In our case, we have utilized bootstrap, which is considered more powerful (Chin), as it provides two essential measures of the structural model: a t-value (similar to t-test) and an R2 (same as in multiple regressions). The predictive power of the model can be evaluated using the R2 derived from bootstrap analysis.
After evaluating the quality of the measurement model, we will now examine its structure and test the research hypotheses.
In the context of the Partial Least Squares (PLS) method, the structural model is evaluated based on the predictive relevance of latent variables. The overall quality of the model can be assessed by examining the coefficients of determination (R2). Falk and Miller suggest that a “good model” obtained through PLS regression should have determination coefficients (R2) greater than 0.1.
In our case, we have utilized bootstrap because it provides two essential measures of the structural model: a t-value and an R2.
We calculated the R2 using the bootstrap procedure associated with the ultimate dependent variable in our model, and we obtained an R2 coefficient of 0.6785 (>0.1). This indicates that 67.85% of the variation in the intention indicator can be explained by the constructs used in the model.
Based on the results given in Table 6, the R2 coefficient of 0.6785 (>0.1) for the model is very satisfactory as its value is well above the recommended threshold of 10%.
This leads us to affirm that all the criteria for evaluating the structural model are satisfactory.
5.3. Hypothesis Testing
All the hypotheses of our research have been tested using a structural equation model. The significance of the structural links connecting the constructs allows us to validate or reject the hypotheses.
![]()
Table 6. Explained variance (R2) and communality.
To verify our hypotheses, we examined the direction, value, and significance level of the causality coefficients (gammas) calculated using the PLS method. The regression values will be presented as the values in the “Path coefficient”. The validation of the results will also involve examining the determination coefficients R2 and the significance of the regression coefficients using T-Student tests.
We will now proceed to test the research hypotheses by evaluating the significance of the standardized coefficients using bootstrapping procedure in SmartPLS.
The main results of the research hypotheses testing are summarized in the table below, indicating that four of the hypothesized hypotheses have been confirmed. In order to synthesize the results of all our hypotheses, we propose Table 7.
The analysis of these results has shown that there is a positive and highly significant relationship between perceived usefulness and perceived ease of use with the intention to use artificial intelligence, as the Student’s t-values (T1 = 3.133359 and T2 = 2.990327) are both greater than 1.96.
Similarly, the influence of trainers and personal innovativeness positively influences the intention to use artificial intelligence, as the Student’s t-values (T3 = 3.142359 and T4 = 8327.25405) are both greater than 1.96.
6. Discussion of the Results
According to the Unified Theory of Acceptance and Use of Technology (UTAUT) proposed by Venkatesh (2003), perceived usefulness is a key factor that influences user behavior towards technology. This is consistent with the findings in the literature, which suggest that perceived usefulness is a means through which young trainee executives in CRMEF can improve their intention to use artificial intelligence.
Exactly, if a young trainee executive perceives that artificial intelligence can effectively meet their needs and is easy to use, they are more likely to adopt it.
![]()
Table 7. The results of the hypothesis test.
Therefore, decision-makers in CRMEF should pay particular attention to the user experience and the presentation of the usefulness of artificial intelligence to encourage its adoption among young trainee executives in CRMEF.
The perceived ease of use has a positive influence on the intention to use artificial intelligence among young trainee executives in CRMEF. This result indicates that the user’s perception of the ease of use of artificial intelligence, which takes into account aspects such as simplicity, speed, and efficiency of using artificial intelligence, plays a significant role in shaping their intention to use it.
Indeed, when young trainee executives in CRMEF perceive artificial intelligence as easy to use and useful in their didactic and pedagogical tasks, they are more likely to adopt and use it regularly. This provides an important indicator to decision-makers in CRMEF to provide user-friendly intelligent systems that can facilitate the adoption and regular use of artificial intelligence in their educational practices.
The main determinant of the construct “social influence,” which corresponds to “the degree to which a person believes that important people think they should use the new system” (Venkatesh 2003, p. 451) encompasses several dimensions, among which the influence of trainers has a very significant effect.
A study conducted by Zhang [21] revealed that end-user training on the use of artificial intelligence had a significant effect on their intention to use this technology in the context of healthcare. This confirms what we have found in the literature that social influence is strongly determined by the influence of trainers, and subsequently, the influence of trainers is a good predictor of the behavioral intention to use artificial intelligence.
The trainers at the CRMEF can play a crucial role in training young trainee executives on how to use artificial intelligence, which can enhance their confidence and competence in utilizing this technology. Furthermore, trainers at the CRMEF can help young trainee executives understand the benefits of artificial intelligence and overcome any potential fears or resistance towards its use.
Subsequently, the training of young trainee executives can enhance their confidence and competence in using artificial intelligence, which can lead to broader adoption of this technology.
Similarly, in accordance with our hypotheses, we have confirmed the positive influence of the personal innovativeness construct on the intention to use artificial intelligence, in line with the existing literature (Wang, Wu and Wang, 2009 [22] , Chong, 2013 [23] , Abu-AlAish, A and Love, S. 2013).
Young intern executives with an innovative mindset tend to be more open to new technologies and more inclined to use them compared to other interns who are more conservative.
Furthermore, a young intern with a high propensity for innovation may be able to see the potential benefits of artificial intelligence in solving complex problems.
In conclusion, our study aimed to identify the factors that promote the intention to use artificial intelligence among young interns in CRMEF.
The findings of this study can provide CRMEF decision-makers with important insights to consider in order to ensure the successful adoption of artificial intelligence in their context.
7. Conclusions
Research in information systems deeply focuses on interpreting and elucidating the issue of the acceptance of new technologies from the user’s perspective. Moreover, information systems cannot significantly enhance the performance of institutions if they are not adequately accepted by end users. Advances in artificial intelligence have created new perspectives in training, teaching, and administrative management within the Regional Centers for Teaching and Training Professions (CRMEF) in Morocco.
The findings of this article undoubtedly have managerial implications that may be of interest to decision-makers in the Moroccan Ministry of National Education and administrative and pedagogical stakeholders in the educational system, specifically those involved in the Regional Centers for Teaching and Training Professions (CRMEF).
We have developed a model that identifies key factors promoting the rapid and effective adoption of AI in executive training centers. We have highlighted the significant benefits that CRMEFs could derive from the use of AI. It is crucial to align human efforts with technological solutions to effectively foster the training of young executives and achieve success. Exploring the best methods to integrate artificial intelligence into the field of executive training in Morocco is essential.
In this study, we initially formulated research hypotheses and constructed a hypothetical model consisting of four selected variables: perceived ease of use, perceived usefulness, trainer influence, personal innovativeness, and intention. For each variable in the model, a set of items was assigned based on the literature in information systems. Modifications were made to the selected items to adapt them to our context. Subsequently, to assess our hypotheses and confirm our research models, we chose to use the structural equation modeling (SEM) approach, which holds particular significance in our study. We opted for the Partial Least Squares (PLS) method using Smart PLS 2.0 software. This step allowed us to understand the impact of each variable on the intention to adopt AI among young executive trainees in CRMEFs.
The main results of the hypothesis testing are summarized as follows:
● The hypothesis that “perceived usefulness positively influences intention” is confirmed.
● The hypothesis that “perceived ease of use positively influences intention” is confirmed.
● The hypothesis that “trainer influence positively influences intention” is confirmed.
● The hypothesis that “personal innovativeness positively influences intention” is confirmed.
The analysis of these results has shown that there is a positive and highly significant relationship between perceived usefulness, perceived ease of use, the influence of trainers, and personal innovativeness with the intention to use artificial intelligence. The perception of usefulness is a means by which young trainee executives from CRMEF can strengthen their willingness to use artificial intelligence. Thus, if a young trainee executive perceives that AI effectively meets their needs and is easy to use, they are more inclined to adopt it.
Similarly, the perception of ease of use has a positive impact on the intention to use artificial intelligence among young trainee executives at CRMEF. This includes the user’s perception of the simplicity, speed, and effectiveness of using artificial intelligence. This explains that when young trainee executives at CRMEF perceive artificial intelligence as both simple and useful in their instructional and educational tasks, they are inclined to adopt it and use it regularly. This provides decision-makers at CRMEF with a key indicator for developing intelligent systems that are user-friendly and easy to use.
As expected in our hypotheses, we have confirmed the positive impact of personal innovativeness on the intention to use artificial intelligence. Young trainee executives with an innovative mindset are generally more inclined to adopt new technologies than their more conservative peers. Furthermore, a trainee with a strong inclination for innovation is likely to better grasp the potential benefits of artificial intelligence in solving complex problems.
Our research provides managers at CRMEF with a set of practical recommendations to enhance the implementation conditions of an artificial intelligence system. It aims to understand the factors that should be considered in designing an artificial intelligence system within Regional Centers for Vocational Education and Training (CRMEF).