Near Infrared Spectroscopy (NIRS) Model-Based Prediction for Protein Content in Cowpea ()
1. Introduction
Legumes are very important basic foods in the daily diet for human beings because they provide proteins, starch, fiber, fat, vitamins and minerals that are essential for human’s health. Legumes contribute to the sustainable improvement of the environment due to biological nitrogen fixation ability and positive effects on the soil, and play a major role in resilience to current climate changes [1] [2] . These attributes can help to attain nutritional and food security among low income developing nations of the world.
Cowpea (Vigna unguiculata L. Walp.) is one such nutritious, multipurpose, underutilized leguminous crop grown worldwide to provide protein for human consumption and animal feed that has the potential to alleviate protein-calorie malnutrition [3] . Among underutilized legume crops, cowpea is the most nutritionally dense and climate resilient, as it is can be grown under harsh conditions such as drought and sandy soils and also amenable to diverse cropping systems [4] [5] . Cowpea can be used at all stages of growth [6] [7] . The green seeds can be used fresh or canned or frozen for humans. The young leaves, pods, and peas contain vitamins and minerals, which are used for human consumption and animal feed. Cowpea can be consumed as dry seeds, canned or frozen food [8] , and as milling flour in baked goods [9] . In addition, cowpea has been used as an alternative to soybean for people who are allergic to soybean protein [10] .
Cowpea is rich in protein (24%), dietary fiber (11%), carbohydrates (60/100 g) and potassium (1112 mg/100 g) while low in lipids (<2%) and sodium (16 mg/100 g) [11] . These nutrients make cowpea an important nutritional food in the human diet. A number of bio-functional non-nutrients are present in dry cowpea seeds like phytates, flavonoids, tannins and polyphenols imparting anti-oxidant properties [12] . Cowpea has gained more attention recently from consumers and researchers worldwide as a result of its exerted health beneficial properties, including anti-diabetic [13] , anti-cancer [14] , anti-inflammatory [15] , anti-hypertensive and hypocholesterolemic properties [16] . Furthermore, consumption of cowpea protein has been linked to reducing plasma low-density lipoprotein [17] with the low glycemic index carbohydrates [18] .
Despite the fact that cowpea seeds, leaves, and other plant parts have significant value for population health, food, and feed for underdeveloped nations, it is one of the least used legume crop in comparison to other legumes such as soybeans and it has received less attention from international researchers [19] . In this regard, research has been undertaken in various regions of the world to study the nutritional composition of cowpea seeds and leaves. Significant variability in the nutritional attributes exists among cowpea germplasm [20] , and the variability in biochemical traits could help to develop new cultivars with novel traits combating malnutrition. The development of elite cowpea cultivars requires a significant amount of phenotyping efforts in order to capture possible variation in trait of interest among breeding lines. However, doing so can be labor intensive, time consuming, and might require extensive expertise. Evaluating total seed protein content is one of the routine work in a cowpea breeding program. Total seed Protein content is traditionally evaluated using standard wet chemistry known as the Kjeldhal method [18] . However, this method can be expensive, laborious and time consuming when many samples are involved. The use of an alternate, rapid and non-destructive approach such as Near-Infrared Spectroscopy (NIRS) has been proven to be a better technique to evaluate total seed protein in crops such as mungbean [21] , faba bean [22] , soybean [23] , chickpea and pea [24] and other crops [25] . However, this technique has not been fully investigated in cowpea. Previous research showed that NIRS model accuracy varied between breeding programs sharing similar genetic background [26] . Therefore, developing NIRS models for specific cowpea breeding programs is required.
NIRS is a non-destructive technique that has been used to predict multi-nutritional traits in rice [27] , pearl millet [28] and glucose and protein in the mixed flour of tuber [29] . The technique is considered low-cost and rapid to quantitatively assess biochemical composition in crop plants [30] [31] . It has gained popularity in recent years as a tool for the analysis of moisture, protein, fat, starch, fiber, etc., in the food industry that includes cereals, fruits, vegetables, etc. in the food industry [32] .
Near-infrared (NIR) spectroscopy is a technique that collects the reflected light of a sampled material in the near-infrared region of the electromagnetic spectrum that extends from about 780 to 2500 nm. The infrared spectrometer, which is the instrument used to scan for NIRS, emits the full spectrum of infrared wavelengths, which penetrate the sample, with certain wavelengths absorbed by specific chemical bonds present within the sample. The amount of light energy absorption is directly proportional to the concentration or quantity of bonds present in the sample. From the reflected or transmitted wavelengths, the identity and quantity of the compounds present in the sample may be deduced [33] .
In addition, NIRS can be used to analyze samples in the solid, liquid or gas state, at macro or microscopic level [34] . Quick measurements of NIRS in leguminous crop have been applied for raising crop quality and detecting adulteration in bean products. The application of NIRS to evaluate protein content in cowpea remains limited. However, reliable NIRS approach requires robust NIRS models. These models could be applicable in different sectors of food industry, high throughput screening in national and international gene banks, seed industries and facilitate breeders in crop improvement programs. Therefore, the objective of this study was to develop robust NIRS prediction models to predict protein content in cowpea seeds.
2. Materials and Methods
2.1. Plant Materials, Sample Preparation, and Protein Estimation
A total of 116 cowpea germplasm lines from Texas A&M AgriLife Research-Vernon, Texas, were used for this study. The cowpea breeding lines were grown during the summer of 2021 at Chillicothe Research Centre, which is a property managed by Texas A&M AgriLife Research-Vernon, Texas. The study was laid out in a randomized complete block design with 3 replications for each cowpea breeding line. Within each block, each cowpea breeding line was planted on a 12-foot plot. Row spacing between plot was 3 feet and plant spacing within each row was 3 to 4 inches. Planting was conducted on June 13, 2021. The research plot was rainfed. No fertilizers were applied, and weeds were removed manually or mechanically. The harvest was conducted within 3 weeks because harvest maturity differed between each cowpea breeding line. The first harvest was conducted on August 25, 2021.
At each harvest, all pods from each plot were hand harvested. Seeds were cleaned using a small thresher (Almaco, Nevada, IA). Seed moisture at harvest was about 12%. From each plot, a total of 75 g cowpea seeds were used for whole seed NIRS analysis. The same quantity of seeds were ground to a pass a 20-mm sieve. The ground seeds were also used for ground seed NIRS analysis. A subsample of 10 g ground samples from each plot was sent to Texas A&M AgriLife Forage and Water Lab in College Station, Texas, for total nitrogen analysis using a nitrogen combustion method [26] . Total seed protein content was obtained using the following formula: Protein content (%) = Total nitrogen (%) × 6.25 [26] .
2.2. NIRS Data Collection
NIR spectra for the whole seed and ground seed samples were collected using a DA 7250 analyzer (PerkinElmer Health Sciences Canada Inc., Winnipeg, Canada). The DA 7250 belongs to the family of diode array spectrometers, and it analyzes several components in samples within 6 s. The DA7250, spectral data were taken every 5 nm for a total of 141 wavelengths spanning 950 nm to 1650 nm. Each sample was scanned 3 times and the average was recorded as spectral data for each wavelength and used for the analysis. For each scan, samples (whole seed or ground seed) were placed on a rotating cup that will be shoot by a NIRS lazer from the instrument. The output consisted of spectra and exported from the instrument as txt file. The spectra were then converted into Excel files for further analysis.
2.3. Statistical Analysis
The spectral data and data from reference methods of 116 selected cowpea samples were imported in the JMP 8 (SAS Institute, Inc., Cary, NC), which was used to perform spectral data pre-processing, build calibration and cross-validation models. In the present work to optimize the models, several pre-treatments and their combinations were performed on the NIR spectral data. The pre-treatment methods include Savitzky-Golay first and second derivatives, standard normal variate (SNV) and multiplicative scatter correction (MSC) and combinations such as first derivative + standard normal variate (SNV), second derivative + standard normal variate (SNV), first derivative + multiplicative scattering correction and the second derivative + multiplicative scattering correction [35] . The purpose of derivatives is to enhance signal through resolving overlapping peaks and to remove constant baseline drift and baseline slope [34] . The SNV and MSC are two commonly used methods to minimize both additive and multiplicative effects, and these two methods can generate similar results [34] .
Partial least-squares discriminant analysis (PLS-DA) regression was used to obtain the fundamental relation between the spectral data and corresponding chemical values. The reliability of prediction model was tested by leave-one-sample-out cross validation and external validation. Various statistics, such as the coefficient of correlation I, the coefficient of determination (R2), the root mean square error (RMSE) and residual predictive deviation (RPD) [36] were computed by JMP software to judge the quality of models. The calibration equation with an RPD value above 3 is considered highly useful, while a value lower than 2 is less acceptable for building a prediction model [37] .
3. Results
3.1. Protein Content
A large variation in protein content was observed among the 116 cowpea germplasm lines evaluated in this project. Protein content varied from 19.28% to 32.04%, with an average of 24.67% and a standard deviation of 7.80%.
3.2. Spectral Pre-Treatments
In order to optimize the prediction accuracy of the models, several pre-treatments and combinations were performed on the raw NIR spectral data. The descriptive statistics of the whole seed and ground cowpea samples for the NIRS spectral data are shown in Table 1 and Table 2, respectively. The mean, standard deviation, and the range values of whole seed NIR spectra were found to be higher compared to corresponding values in ground samples across the pre-treatments. The mean for the raw spectra of whole seed was 391,972,704 and the lowest mean
![]()
Table 1. Descriptive statistics for the NIRS spectral data of whole seed samples (raw & pre-treated).
aSG1 = First derivative, SG2 = Second derivatives, SNV = Standard Normal Variate, and MSC = Multiplicative Scatter Correction.
value was noticed for the Savitzky-Golay second derivative in combination with standard normal variate (−8 × 10⁻¹⁹). The standard deviation of the raw spectra was the highest (187,118,268). With the pre-treatments, the standard deviation was reduced for SNV and SG2-SNV having a similar lowest standard deviation values (0.996). The NIRS spectral data revealed wider range with the multiplicative scatter correction (206,826,280 - 634,062,481) (Table 2).
The mean for the raw spectra of ground seed samples was 313,426,313. The standard deviation of the raw spectra was the highest (144,251,561). With the pre-treatments, the standard deviation was reduced for SNV and SG2-SNV that record similar and lowest standard deviation values (0.996). The NIRS spectral data revealed wider range across the pre-treatments and the lower range was observed for the standard normal variate (SNV) ranging from (−1.12 to 1.67) (Table 2).
3.3. Spectral Characteristics
Figure 1 and Figure 2 provide the raw NIR spectra (950 - 1650 nm) from the DA 7250 NIR analyzer of 116 whole and ground cowpea samples, respectively. NIR spectral patterns of the samples were similar across the whole NIR wavelength region (950 - 1650 nm) along the X-axis in both the whole seed and ground seed sample. While along the Y-axis, the changes of spectral intensities among different samples were clear. The spread in the Y-axis or scatter in spectral data was larger when the spectral data was above 1450 nm. The spectra from Figure 1 showed considerable variation along the y axis and with more number of outliers. On the other hand, Figure 2 shows smaller scatter in spectral data with less number of outliers, possibly because ground samples had reduced particle size.
Figure 3 and Figure 4 show the spectra of 116 cowpea germplasm lines with pre-processing for the whole seed and ground samples, respectively. NIR spectral patterns of the whole and ground seed samples exhibited similarity in their
![]()
Table 2. Descriptive statistics for the NIRS spectral data of ground seed samples (raw & pre-treated).
aSG1 = First derivative, SG2 = Second derivatives, SNV = Standard Normal Variate, and MSC = Multiplicative Scatter Correction.
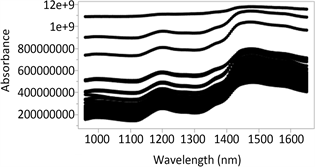
Figure1. Raw near-infrared spectra of whole cowpea samples from DA 7250 (950 - 1650 nm).

Figure2. Raw near-infrared spectra of ground cowpea samples from DA 7250 (950 - 1650 nm).
![]()
Figure 3. Near infrared spectra for whole seed samples of cowpea. A) Raw data, B) First derivative, C) Second derivative, D) Standard Normal Variate (SNV), E) First derivative and SNV, F) Second derivative and SNV, G) Multiplicative scatter correction (MSC), H) First derivative and MSC, and I) Second derivative and MSC.
scatter for raw spectra and the various pre-treatments across the whole NIR wavelength region (950 - 1650 nm). The raw spectra of the whole and ground seed samples recorded two similar peaks, one at 1200 nm and other at 1480 nm with less number of outliers in ground raw spectra. The Savitzky-Golay first derivative and in combination with SNV and MSC pre-treatment (Figure 4(B), Figure 4(E), Figure 4(H)) spectral graphs show peaks at 1150 nm, 1350 nm, and 1400 nm with similar spectra distribution/scatter in both the cowpea samples. The spectral pre-treatment with the Savitzky-Golay second derivative and in combination with SNV and MSC exhibited greater scatter variation with four prominent peaks at 1130 nm, 1240 nm, 1350 nm and 1400 nm in both whole seed and ground seed samples (Figure 4(C), Figure 4(F), Figure 4(I)). The spectral pattern produced by SNV and MSC pre-treatment were comparable to each other with the similar scatter distribution for both the samples with two peaks at 1200 nm and 1400 nm (Figure 4(D), Figure 4(G)). The number of outliers in the raw and pre-treated spectra was higher in the whole seed sample compared to corresponding ground seed samples. The spread in the Y-axis or scatter in spectral data was larger in raw and pre-treated spectra in both the samples compared to X-axis.
3.4. PLS-DA Regression Analysis
Table 3 shows the PLS-DA regression statistics for percent protein calibration.
![]()
Figure 4. Near infrared spectral data for ground seed samples of cowpea. A) Raw data, B) First derivative, C) Second derivative, D) Standard Normal Variate (SNV), E) First derivative and SNV, F) Second derivative and SNV, G) Multiplicative scatter correction (MSC), H) First derivative and MSC, and I) Second derivative and MSC.
![]()
Table 3. PLS-DA regression statistics for protein (%) using multiple spectral pre-treatments results for the cowpea whole seed samples.
aSG1 = First derivative, SG2 = Second derivatives, SNV = Standard Normal Variate, and MSC = Multiplicative Scatter Correction. Abbreviations: R2, coefficient of determination; SEC, standard error of calibration; r2, coefficient of correlation; SEP, standard error of cross validation; RPD residual predictive deviation (SD/SEP).
The MSC treatment has the lowest number of factors (10), whereas both Raw data and the SG2-SNV treatments have the highest number of factors (14). The regressions were assessed by comparing the coefficient of multiple determination (R2) and the standard error of calibration (SEC) of the calibration data set to the r2 and standard error of prediction (SEP) in the validation set. A variety of spectral pre-treatments were evaluated including first derivative, second derivative, SNV, and MSC, as well as combinations. The results showed that R2 values for the calibration varied from 0.33 to 0.78, with SG2 having the lowest R2 values and SG2-SNV having the highest R2 values. These results indicate that data pre-processing can affect the prediction accuracy of NIR data to predict total seed protein in cowpea. The standard error of calibration (SEC) varied from 5.42 to 7.12, with SG2-SNV having the lowest SEC and SG1 having the highest SEC.
The r2 values for the validation ranged between 0.51 to 0.91, with SG2 having the lowest r2 value and SG2-SNV having the r2 value. The standard error of prediction (SEP) varied from 6.01 to 16.76, with SNV having the lowest SEP and SG1-SNV having the highest SEP. RPD, defined as the ratio between SEP and SEC, varied from 1.3 to 2.77, with SG2 having the lowest RPD and SG1-SNV having the highest RPD. Based on the R2, r2, and RPD, the data pre-treatment SG2-SNV work the best to predict total seed protein content in cowpea using NIRS data for the whole seed samples, and Raw data and SG2 are the least performing data pre-treatments.
Table 4 shows the PLS-DA regression statistics for percent protein calibration developed from the data set of 116 ground cowpea seed samples. The number of
![]()
Table 4. PLS-DA regression statistics for protein (%) using multiple spectral pre-treatments results for the cowpea ground seed samples.
aSG1 = First derivative, SG2 = Second derivatives, SNV = Standard Normal Variate, and MSC = Multiplicative Scatter Correction. Abbreviations: R2, coefficient of determination; SEC, standard error of calibration; r2, coefficient of correlation; SEP, standard error of cross validation; RPD residual predictive deviation.
factors varied from 8 to 12, with SG1-SNV and SG2-MSC having the lowest number of factors and Raw data having the highest number of factors. Results showed that R2 values for calibration varied from 0.64 to 0.85, with Raw data having the lowest R2 and SG2-SNV having the highest R2. The standard error of calibration (SEC) ranged between 4.24 to 6.17. SG2-SNV had the lowest SEC, whereas SG2-MSC had the highest SEC. The coefficient of determination of validation (r2) ranged between 0.71 and 0.94, with SG2-SNV having the highest r2 and MSC having the lowest r2. The standard error for validation (SEP) varied from 7.68 to 16.49. Raw data had the lowest SEP, whereas SG1 had the highest SG1. RPD values were between 1.52 to 2.87. SG2-SNV had the highest RPD and Raw data had the lowest RPD.
4. Discussion
Legumes are very important basic foods on the daily diet for humans being, due to the input of proteins, starch, fiber, fat, vitamins, and minerals. The conventional methods to determine their chemical composition are time consuming, expensive, produce a lot of chemicals, and are destructive analysis. It was found that NIRS is a technique capable to predict the content of protein, starch, dietary fiber, etc. in a fast and reliable way, in legumes. The application of NIRS to evaluate protein content in cowpea remains limited. Therefore, the present work was undertaken to develop robust NIRS prediction models to predict protein content in cowpea.
The estimated protein values of 116 cowpea genotypes (19.28 % to 32.04%) by conventional chemical analysis cover a wide range of variability. The variability was within the range limits to those of previous publications (protein ranging 21 % to 33 %) in cowpea [38] [39] . This variation in protein content showed that the evaluated germplasm lines are appropriate to develop NIRS-based models for protein prediction in cowpea. The selected samples should represent the global variability to be expected in the concentrations of the analyte in order to develop the robust model [40] . The large variability in protein content among the evaluated genotypes increase the robustness of the prediction because models cannot predict values outside of the ranges used during model fitting.
The pre-treatment of spectral data is a crucial step in building a prediction model, allowing an increased signal-to-noise ratio, enhancing variation in signal, and removing those sources unrelated to the property of interest. The raw spectra of whole and ground cowpea seeds were subjected to Savitzky–Golay first and second derivative in combination with SNV and MSC. The results indicated that the raw spectral statistics such as mean, standard deviation, and range reduced with the pre-treatments in both the whole and ground seed samples (Table 1, Table 2). The previous literature report that, the most popular pre-processing methods include derivatives, de-trending, standard normal variate (SNV) and multiplicative scatter correction (MSC) [41] .
The spectral plots of raw and pre-processed NIR spectra of cowpea germplasm lines (whole and ground seed) (Figures 1-4) across the entire NIR wavelength region (950 - 1650 nm) were similar along the X-axis. While along the Y-axis, the scatter in spectral data among different samples across all the spectral plots were clear at higher wavelength region (>1450 nm). The stronger absorber and scattering effects at the higher wavelengths were the primary cause. A similar result with increasing scatter in the longer wavelength region was reported in wheat [42] and in lentil samples [43] . The whole seed raw and pre-treated spectra exhibited considerable scatter variation along the y axis with more number of outliers compared to the corresponding spectra of ground seed samples. The greater variation in seed size, shape and colour of seed samples could cause a larger scattering effect [43] . The smaller scatter in the spectral data of ground seed samples, possibly because of the reduced and more or less uniform particle size. Previous research also reported that wheat flour had lower scattering effect than whole wheat kernels [41] .
Partial least-squares discriminant analysis (PLS-DA) algorithm was used to obtain the fundamental relation between the spectral data and corresponding chemical values. The reliability of prediction model was tested by leave-one-sample-out cross validation and external validation. The successful PLS-DA models usually had factors higher than 6 - 8 to ensure that these factors can account for most of the variance in the calibration system [42] . The number of factors reported on this paper relatively higher than 8. The number of factors could depend on environmental variation during the seed filling stage such as temperature, moisture, and solar radiation. Since there were many cowpea lines with high variation with respect to seed size and seed colour in this calibration set, it is acceptable for models to have relatively high factors.
By comparing results from Table 3 and Table 4, the influence of sample status (whole or ground) on model performance could be analyzed. A slight improvement of model performance was observed for the prediction of protein after sample grinding. Several studies indicated that physical characteristics of seed samples, such as particle size, water content and interaction between constituents significantly, influenced near infrared absorption and led to variation in the NIR results [44] [45] . For field pea and chickpea, the calibration accuracy for the chemical constituents of the ground powder was also generally better than those for the intact seed samples [46] [47] . NIRS calibration equations developed from ground samples showed similar performance and predictability to those with whole samples. The possible explanation was that the pre-treatments could minimize the influence of particle size and background noise.
Earlier publications indicate that the NIRS models had a slightly better predictability for ground seed samples than in whole seed in lentil, but generally these two models achieved similarly high accuracy [48] . This is highly important for food industries and breeders to estimate the protein and other contents in whole samples without grinding by using NIR models. There are significant advantages in avoiding grinding. Individual seeds require no sample preparation. The intact seeds are viable after NIR predictions, which would allow breeders to simultaneously use in their breeding programs. The results of the present work and the literature reports reveal that the models were relatively inferior and were only suitable for very rough screening with careful use [36] . Continued refinement of the calibration equations is needed to enhance the model performance by classifying the seeds based on size, shape, and colour.
5. Conclusion
This study shows that the sample types used for NIRS analysis of protein can affect the accuracy of protein prediction. A better accuracy was found when using the ground samples. In addition, the large variation in protein content found among the breeding lines offers an excellent input for the calibration. Moreover, we have demonstrated that data pre-processing can also affect the accuracy of prediction.
Funding
This research was funded by the USDA Crop Germplasm Committees program for Vigna germplasm evaluation with Agreement Number/FAIN: 58-046-2-008; 58-6046-3-005, the USDA National Institute of Food and Agriculture Hatch project accession number: 1025956, the USDA Multi-State Hatch Project: 7003209, and the Texas A&M AgriLife Institute for Advancing Health through Agriculture.
Conflict of Interest
The authors declare no conflicts of interest regarding the publication of this paper.
References
- 1. De La Peña, T.C. and Pueyo, J.J. (2011) Legumes in the Reclamation of Marginal Soils, from Cultivar and Inoculant Selection to Transgenic Approaches. Agronomy for Sustainable Development, 32, 65-91. https://doi.org/10.1007/s13593-011-0024-2
- 2. Horneck, D. and Miller, R. (1998) Determination of Total Nitrogen in Plant Tissue. In: Kalra, Y., Ed., Handbook of Reference Methods for Plant Analysis, CRC Press, Boca Raton, 75-83.
- 3. Gonçalves, A., Goufo, P., Barros, A., Domínguez-Perles, R., Trindade, H., Rosa, E.A.S., Ferreira, L. and Rodrigues, M. (2016) Cowpea (Vigna unguiculata L. Walp), a Renewed Multipurpose Crop for a More Sustainable Agri-Food System: Nutritional Advantages and Constraints. Journal of the Science of Food and Agriculture, 96, 2941-2951. https://doi.org/10.1002/jsfa.7644
- 4. Egbadzor, K.F., Ofori, K., Yeboah, M., Aboagye, L.M., Opoku-Agyeman, M.O., Danquah, E.Y. and Offei, S.K. (2014) Diversity in 113 Cowpea [Vigna unguiculata (L) Walp] Accessions Assessed with 458 SNP Markers. SpringerPlus, 3, Article No. 541. https://doi.org/10.1186/2193-1801-3-541
- 5. Singh, B. (1997) Recent Advances in Cowpea Breeding. https://books.google.com/books?hl=en&lr=&id=s_5Y5BFRU1EC&oi=fnd&pg=PA30&dq=singh+recent+advances+in+cowpea+breeding&ots=YxXTtj7KtU&sig=T92r_BYnh-zizY5NZaA8-i9MRto
- 6. Fang, J., Chao, C.C.T., Roberts, P.A. and Ehlers, J.D. (2007) Genetic Diversity of Cowpea [Vigna unguiculata (L.) Walp.] in Four West African and USA Breeding Programs as Determined by AFLP Analysis. Genetic Resources and Crop Evolution, 54, 1197-1209. https://doi.org/10.1007/s10722-006-9101-9
- 7. Singh, B.B., Timko, M.P. and Aragao, F.J.L. (2014) Advances in Cowpea Improvement and Genomics. In: Gupta, S., Nadarajan, N., Gupta, D., Eds., Legumes in the Omic Era, Springer, New York, NY, 131-153. https://link.springer.com/chapter/10.1007/978-1-4614-8370-0_7
- 8. Fery, R.L. (1993) “Bettergreen” Southernpea. HortScience, 28, 62-63. https://doi.org/10.21273/HORTSCI.28.1.62
- 9. Kushwaha, A. and Kumar, A. (2014) Development of High Protein Biscuits from Cowpea (Vigna unguiculata) Flour. International Journal of Basic and Applied Agricultural Research, 12, 288-291.
- 10. Fatokun, C.A., Boukar, O. and Muranaka, S. (2012) Evaluation of Cowpea (Vigna unguiculata (L.) Walp.) Germplasm Lines for Tolerance to Drought. Plant Genetic Resources, 10, 171-176. https://doi.org/10.1017/S1479262112000214
- 11. Agbicodo, E.M., Fatokun, C.A., Bandyopadhyay, R., Wydra, K., Diop, N.N., Muchero, W., Ehlers, J.D., Roberts, P.A., Close, T.J., Visser, R.G.F. and van der Linden, C.G. (2010) Identification of Markers Associated with Bacterial Blight Resistance Loci in Cowpea [Vigna unguiculata (L.) Walp.]. Euphytica, 175, 215-226. https://doi.org/10.1007/s10681-010-0164-5
- 12. Avanza, M.V., Chaves, M.G., Acevedo, B.A. and Añón, M.C. (2012) Functional Properties and Microstructure of Cowpea Cultivated in North-East Argentina. LWT, 49, 123-130. https://doi.org/10.1016/j.lwt.2012.04.015
- 13. Vermeulen, S.J., Campbell, B.M. and Ingram, J.S.I. (2012) Climate Change and Food Systems. Annual Review Environmental Resources, 37, 195-222. https://doi.org/10.1146/annurev-environ-020411-130608
- 14. Schmidhuber, J. and Tubiello, F.N. (2007) Global Food Security under Climate Change. Proceedings of the National Academy of Sciences of the United States of America, 104, 19703-19708. https://doi.org/10.1073/pnas.0701976104
- 15. Kumar, B. and Bhalothia, P. (2020) Orphan Crops for Future Food Security. Journal of Biosciences, 45, Article No. 131. https://doi.org/10.1007/s12038-020-00107-5
- 16. Tadele, Z. (2019) Orphan Crops: Their Importance and the Urgency of Improvement. Planta, 250, 677-694. https://doi.org/10.1007/s00425-019-03210-6
- 17. Talabi, A.O., Vikram, P., Thushar, S., Rahman, H., Ahmadzai, H., Nhamo, N., Shahid, M. and Singh, R.K. (2022) Orphan Crops: A Best Fit for Dietary Enrichment and Diversification in Highly Deteriorated Marginal Environments. Frontiers in Plant Science, 13, Article 839704. https://doi.org/10.3389/fpls.2022.839704
- 18. Alphonsus K.B. and Felix D.D. (2012) Elevated Concentrations of Dietarily-Important Trace Elements and Macronutrients in Edible Leaves and Grain of 27 Cowpea (Vigna unguiculata L. Walp.) Genotypes: Implications for Human Nutrition and Health. Food and Nutrition Sciences, 3, 377-386. https://doi.org/10.4236/fns.2012.33054
- 19. Chivenge, P., Mabhaudhi, T., Modi, A.T. and Mafongoya, P. (2015) The Potential Role of Neglected and Underutilised Crop Species as Future Crops under Water Scarce Conditions in Sub-Saharan Africa. International Journal of Environmental Research and Public Health, 12, Pages 5685-5711. https://doi.org/10.3390/ijerph120605685
- 20. Boukar, O., Muranaka, S., Fatokun, C., Shono, M. and Ishikawa, H. (2017) Development of Calibration Model to Predict Nitrogen Content in Single Seeds of Cowpea (Vigna unguiculata) Using Near Infrared Spectroscopy. Journal of Near Infrared Spectroscopy, 25, 211-214. https://doi.org/10.3390/ijerph120605685
- 21. Bartwal, A., John, R., Padhi, S.R., Suneja, P., Bhardwaj, R., Gayacharan Wankhede, D.P. and Archak, S. (2023) NIR Spectra Processing for Developing Efficient Protein Prediction Model in Mungbean. Journal of Food Composition and Analysis, 116, Article ID: 105087. https://doi.org/10.1016/j.jfca.2022.105087
- 22. Wang, J., Liu, H. and Ren, G. (2014) Near-Infrared Spectroscopy (NIRS) Evaluation and Regional Analysis of Chinese Faba Bean (Vicia faba L.). The Crop Journal, 2, 28-37. https://doi.org/10.1016/j.cj.2013.10.001
- 23. Ferreira, D.S., Pallone, J.A.L. and Poppi, R.J. (2013) Fourier Transform Near-Infrared Spectroscopy (FT-NIRS) Application to Estimate Brazilian Soybean [Glycine max (L.) Merril] Composition. Food Research International, 51, 53-58. https://doi.org/10.1016/j.foodres.2012.09.015
- 24. Iyer, L., Meares, C., Black, R.G., Brouwer, J.B. and Flinn, P.C. (1998) Estimating the Food Processing Characteristics of Pulses by Near Infrared Spectroscopy, Using Ground or Whole Samples. Journal of Near Infrared Spectroscopy, 6, 213-220. https://doi.org/10.1255/jnirs.139
- 25. Asghar, M., Akhtar, K., Abbas, G., Rizwan, M., Iqbal, M., Idrees, M., Ali, S., Aslam, M., Aziz-ur-Rehman, M., Saleem, U. and Khan, M. (2018) Identification of Multiple Sources of Resistance in Lentil against Some Potential Fungal Diseases. Pakistan Journal of Agricultural Sciences, 55, 875-880.
- 26. Weng, Y., Shi, A., Ravelombola, W.S., Yang, W., Qin, J., Motes, D., Moseley, D.O. and Chen, P. (2017) A Rapid Method for Measuring Seed Protein Content in Cowpea (Vigna unguiculata (L.) Walp). American Journal of Plant Sciences, 8, 2387-2396. https://doi.org/10.4236/ajps.2017.810161
- 27. John, R., Bhardwaj, R., Jeyaseelan, C., Bollinedi, H., Singh, N., Harish, G.D., Singh, R., Nath, D.J., Arya, M., Sharma, D., Singh, S., Joseph John, K., Latha, M., Rana, J.C., Ahlawat, S.P. and Kumar, A. (2022) Germplasm Variability-Assisted Near Infrared Reflectance Spectroscopy Chemometrics to Develop Multi-Trait Robust Prediction Models in Rice. Frontiers in Nutrition, 9, Article 946255. https://doi.org/10.3389/fnut.2022.946255
- 28. Tomar, M., Bhardwaj, R., Kumar, M., Singh, S.P., Krishnan, V., Kansal, R., Verma, R., Yadav, V.K., dahuja, A., Ahlawat, S.P., Chand Rana, J., Satyavathi, C.T., Praveen, S. and Sachdev, A. (2021) Development of NIR Spectroscopy Based Prediction Models for Nutritional Profiling of Pearl Millet (Pennisetum glaucum (L.)) R.Br: A Chemometrics Approach. LWT, 149, Article ID: 111813. https://doi.org/10.1016/j.lwt.2021.111813
- 29. Masithoh, R.E., Amanah, H.Z., Yoon, W.S., Joshi, R. and Cho, B.K. (2021) Determination of Protein and Glucose of Tuber and Root Flours Using NIR and MIR Spectroscopy. Infrared Physics & Technology, 113, Article ID: 103577. https://doi.org/10.1016/j.infrared.2020.103577
- 30. Towett, E.K., Alex, M., Shepherd, K.D., Polreich, S., Aynekulu, E., Maass, B.L., Erick Towett, C.K. and Agroforestry Centre, W. (2013) Applicability of Near-Infrared Reflectance Spectroscopy (NIRS) for Determination of Crude Protein Content in Cowpea (Vigna unguiculata) Leaves. Food Science & Nutrition, 1, 45-53. https://doi.org/10.1002/fsn3.7
- 31. Bokobza, L. (2002) Near-Infrared Spectroscopy: Principles, Instruments, Applications. Wiley VCH, Weinheim.
- 32. Quinones, M., Martinez, L., Herrera, S. and Laredo, R. (2018) Near-Infrared Spectroscopy (NIRS) Applied to Legume Analysis: A Review. International Journal of Engineering and Innovative Technology, 8, 29-40.
- 33. Agelet, L.E. and Hurburgh, C.R. (2010) A Tutorial on Near Infrared Spectroscopy and Its Calibration. Critical Reviews in Analytical Chemistry, 40, 246-260. https://doi.org/10.1080/10408347.2010.515468
- 34. Nicolaï, B.M., Beullens, K., Bobelyn, E., Peirs, A., Saeys, W., Theron, K.I. and Lammertyn, J. (2007) Nondestructive Measurement of Fruit and Vegetable Quality by Means of NIR Spectroscopy: A Review. Postharvest Biology and Technology, 46, 99-118. https://doi.org/10.1016/j.postharvbio.2007.06.024
- 35. Oliveira, J.T.A., Andrade, N.C., Martins-Miranda, A.S., Soares, A.A., Gondim, D.M.F., Araújo-Filho, J.H., Freire-Filho, F.R. and Vasconcelos, I.M. (2012) Differential Expression of Antioxidant Enzymes and PR-Proteins in Compatible and Incompatible Interactions of Cowpea (Vigna unguiculata) and the Root-Knot Nematode Meloidogyne Incognita. Plant Physiology and Biochemistry, 51, 145-152. https://doi.org/10.1016/j.plaphy.2011.10.008
- 36. Williams, P. and Norris, K. (1987) Near-Infrared Technology in the Agricultural and Food Industries. American Association of Cereal Chemists, 11, 123-145. https://www.cabdirect.org/cabdirect/abstract/19892442443
- 37. Han, Z., Cai, S., Zhang, X., Qian, Q., Huang, Y., Dai, F. and Zhang, G. (2017) Development of Predictive Models for Total Phenolics and Free P-Coumaric Acid Contents in Barley Grain by Near-Infrared Spectroscopy. Food Chemistry, 227, 342-348. https://doi.org/10.1016/j.foodchem.2017.01.063
- 38. Jose, F., Cruz, R. and Almeida, M. (2014) Growth, Nutritional Status and Nitrogen Metabolism in “Vigna unguiculata” (L.) Walp Is Affected by Aluminum. Australian Journal of Crop Science, 8, 1132-1139. https://search.informit.org/doi/abs/10.3316/INFORMIT.566862068222826
- 39. Moros, J., Garrigues, S. and de la Guardia, M. (2010) Vibrational Spectroscopy Provides a Green Tool for Multi-Component Analysis. TrAC Trends in Analytical Chemistry, 29, 578-591. https://doi.org/10.1016/j.trac.2009.12.012
- 40. Blanco, M. and Villarroya, I. (2002) NIR Spectroscopy: A Rapid-Response Analytical Tool. TrAC Trends in Analytical Chemistry, 21, 240-250. https://doi.org/10.1016/S0165-9936(02)00404-1
- 41. Williams, P., Manley, M. and Antoniszyn, J. (2019) Near Infrared Technology: Getting the Best out of Light. Africa Sun Media, Stellenbosch. https://doi.org/10.18820/9781928480310 https://books.google.com/books?hl=en&lr=&id=xSSyDwAAQBAJ&oi=fnd&pg=PP6&dq=42.%09Williams,+P.%3B+Manley,+M.%3B++Antoniszyn,+J.+Near+infrared+technology:+Getting+the+best+out+of+light.+African+Sun+Media.+2019.&ots=DK5TxCrEFm&sig=lC89IZnCaR3eW6ovlvlg93qGQwM
- 42. Hang, J., Shi, D., Neufeld, J., Bett, K.E. and House, J.D. (2022) Prediction of Protein and Amino Acid Contents in Whole and Ground Lentils Using Near-Infrared Reflectance Spectroscopy. LWT, 165, Article ID: 113669. https://doi.org/10.1016/j.lwt.2022.113669
- 43. Rantanen, J., Räsänen, E., Tenhunen, J., Känsäkoski, M., Mannermaa, J.P. and Yliruusi, J. (2000) In-Line Moisture Measurement during Granulation with a Four-Wavelength near Infrared Sensor: An Evaluation of Particle Size and Binder Effects. European Journal of Pharmaceutics and Biopharmaceutics, 50, 271-276. https://doi.org/10.1016/S0939-6411(00)00096-5
- 44. Wang, D., Dowell, F.E. and Lacey, R.E. (1999) Single Wheat Kernel Size Effects on Near-Infrared Reflectance Spectra and Color Classification. Cereal Chemistry, 76, 34-37. https://doi.org/10.1094/CCHEM.1999.76.1.34
- 45. Flinn, L., Meares, C., Black, R.G., Brouwer, J.B. and Flinn, P.C. (1998) Estimating the Food Processing Characteristics of Pulses by near Infrared Spectroscopy, Using Ground or Whole Samples. Journal of Near Infrared Spectroscopy, 6, 213-220. https://opg.optica.org/abstract.cfm?uri=jnirs-6-1-213 https://doi.org/10.1255/jnirs.139
- 46. Urban, J. and Hybl, M. (1999) The Use of NIR Method Method for Evaluation of the Pea (Pisum sativum L.) Quality. Rostlinna Vyroba, 45, 41-43.
- 47. Revilla, I., Lastras, C., González-Martín, M.I., Vivar-Quintana, A.M., Morales-Corts, R., Gómez-Sánchez, M.A. and Pérez-Sánchez, R. (2019) Predicting the Physicochemical Properties and Geographical ORIGIN of Lentils Using near Infrared Spectroscopy. Journal of Food Composition and Analysis, 77, 84-90. https://doi.org/10.1016/j.jfca.2019.01.012
- 48. Shi, H. and Yu, P. (2017) Comparison of Grating-Based Near-Infrared (NIR) and Fourier Transform Mid-Infrared (ATR-FT/MIR) Spectroscopy Based on Spectral Preprocessing and Wavelength Selection for the Determination of Crude Protein and Moisture Content in Wheat. Food Control, 82, 57-65. https://doi.org/10.1016/j.foodcont.2017.06.015