Optimizing Business Performance through KPI Alignment: A Comprehensive Analysis of Key Performance Indicators and Strategic Objectives ()
1. Introduction
In the ever-evolving landscape of contemporary business, the pursuit of sustainable success necessitates a strategic and data-driven approach. Key Performance Indicators (KPIs) serve as the compass guiding organizations toward their objectives, providing a comprehensive framework for measuring and optimizing business performance. This article, titled “Optimizing Business Performance through KPI Alignment: A Comprehensive Analysis of Key Performance Indicators and Strategic Objectives”, seeks to delve into the intricate interplay between KPIs and strategic goals, unraveling the critical dynamics that underpin organizational success.
As businesses navigate through a globalized and digitally transformed environment, the importance of aligning KPIs with strategic objectives has become increasingly apparent. The alignment of these two facets not only enhances operational efficiency but also ensures that every aspect of an organization’s performance contributes to the overarching mission and vision. This comprehensive analysis will explore the nuances of selecting, implementing, and optimizing KPIs to drive strategic alignment, fostering a deeper understanding of how organizations can leverage these metrics to achieve peak performance.
The journey begins by examining the fundamental concept of KPIs and their pivotal role in quantifying organizational performance. KPIs are not mere metrics; they are strategic tools that enable businesses to measure progress, identify areas for improvement, and make informed decisions. This article will reference seminal works such as Kaplan and Norton’s Balanced Scorecard framework ( Kaplan & Norton, 1992 ) to establish a foundational understanding of how KPIs can be strategically aligned with organizational goals.
Moving forward, the analysis will explore the diverse array of KPIs that organizations can leverage, ranging from financial indicators to customer satisfaction metrics and operational efficiency measures. By drawing on seminal works such as “Measuring What Matters” by Katie Delahaye Paine ( Paine, 2015 ), the article will provide insights into the nuanced selection of KPIs based on the nature of the industry, business model, and overarching strategic objectives.
The article will further delve into the complexities of KPI implementation, emphasizing the need for a tailored approach that considers the unique characteristics of each organization. Drawing on case studies and empirical research, the analysis will highlight best practices for KPI integration, referencing authoritative works such as “Key Performance Indicators: Developing, Implementing, and Using Winning KPIs” by David Parmenter ( Parmenter, 2010 ).
Additionally, the exploration will extend to the dynamic nature of strategic objectives, recognizing that businesses operate in a dynamic environment where goals evolve. The article will reference management literature, including works like “Good Strategy Bad Strategy” by Richard Rumelt ( Rumelt, 2011 ), to elucidate the importance of aligning KPIs with adaptable and responsive strategic frameworks.
In conclusion, this article aspires to serve as a definitive guide for organizations seeking to optimize their business performance by aligning KPIs with strategic objectives. By synthesizing insights from pioneering works in the field, the analysis aims to provide a roadmap for businesses to navigate the complex terrain of KPI selection, implementation, and optimization, ultimately propelling them towards sustained success in an ever-changing business landscape.
1.1. Performance Monitoring and Measurement: A Broad Overview
Performance monitoring and measurement constitute the bedrock of organizational success in today’s dynamic and competitive business landscape. The strategic deployment of Key Performance Indicators (KPIs) plays a pivotal role in this process, offering a structured approach to quantifying and optimizing business performance. This broad overview delves into the multifaceted realm of performance monitoring and measurement, laying the groundwork for our comprehensive analysis of KPI alignment with strategic objectives.
1) Defining Performance Monitoring and Measurement:
At its core, performance monitoring and measurement involve systematically collecting and analysing data to evaluate how well an organization is achieving its goals. It encompasses various metrics and indicators that span financial, operational, customer-centric, and internal process dimensions. By quantifying performance through objective measurements, organizations gain valuable insights into their strengths, weaknesses, and areas for improvement.
2) The Role of Key Performance Indicators (KPIs):
KPIs serve as the cornerstone of effective performance monitoring and measurement strategies. These metrics are carefully selected to align with organizational objectives and provide a clear, quantifiable representation of progress. The choice of KPIs is not arbitrary; it requires a thoughtful consideration of strategic priorities, industry benchmarks, and the unique characteristics of the business.
3) Aligning KPIs with Strategic Objectives:
The effectiveness of performance monitoring lies in the strategic alignment of KPIs with organizational goals. This concept emphasizes the need for a balanced set of KPIs across financial, customer, internal process, and learning and growth perspectives. This alignment ensures that every measured aspect contributes directly to the overarching strategic objectives of the organization.
4) Dynamic Adaptability in Performance Metrics:
The business landscape is characterized by constant change, requiring organizations to adopt an adaptive approach to performance monitoring and measurement. Strategies outlined by Rumelt (2011) emphasize the importance of dynamic adaptability in strategic objectives and, by extension, in the KPIs used for measurement. This adaptability ensures that performance metrics remain relevant and aligned with evolving business priorities.
5) Technology’s Role in Performance Measurement:
In the digital age, technology plays a pivotal role in enhancing the precision and efficiency of performance monitoring. Weill & Ross (2004) discuss the alignment of IT metrics with overall business strategy, highlighting how technology-driven data collection and analysis contribute to more effective decision-making. The landscape of performance monitoring and measurement is expansive and dynamic. From the strategic deployment of KPIs to the evolving role of technology, organizations must navigate this terrain with precision to optimize business performance. Our comprehensive analysis of KPI alignment with strategic objectives will further dissect these concepts, offering practical insights for organizations striving for sustained success.
1.2. Strategic Objectives as Guiding Principles: A Comprehensive Exploration
Strategic objectives, as the guiding principles of organizational vision and mission, are paramount in the effective management and optimization of business performance. In the context of the article titled “Optimizing Business Performance through KPI Alignment: A Comprehensive Analysis of Key Performance Indicators and Strategic Objectives,” it is imperative to delve extensively into the role of strategic objectives as fundamental elements that shape and direct the trajectory of an organization.
1) Defining Strategic Objectives:
At its essence, strategic objectives encapsulate an organisation’s long-term goals and aspirations, delineating the path it intends to traverse to achieve sustainable success ( Kaplan & Norton, 1992 ). These objectives serve as the foundation for formulating strategic plans, acting as a guiding compass for decision-making at all levels of the organization ( Hrebiniak, 2006 ). By articulating strategic objectives, organizations establish a clear framework for aligning activities, resources, and efforts towards a unified vision.
2) Alignment with Organizational Vision and Mission:
Strategic objectives derive their significance from their alignment with the broader vision and mission of the organization. Kaplan and Norton’s Balanced Scorecard framework emphasizes aligning strategic objectives across four perspectives—financial, customer, internal processes, and learning and growth ( Kaplan & Norton, 1992 ). This alignment ensures that organizational efforts are cohesive and directed towards a common purpose, fostering synergy and coherence in performance optimization.
3) Driving Organizational Performance:
Strategic objectives serve as powerful drivers for organizational performance. They provide a sense of purpose and direction, guiding employees at all levels on the priorities and goals that contribute to realizing the organization’s strategic intent ( Hrebiniak, 2006 ). By aligning day-to-day operations with strategic objectives, organizations create a nexus between their overarching vision and the practical activities that drive performance metrics.
4) Measuring Success:
The effectiveness of strategic objectives is closely tied to the ability to measure success and progress. Key Performance Indicators (KPIs), as quantitative metrics, play a crucial role. Strategic objectives provide the overarching context for selecting and designing KPIs, ensuring that performance measurement is directly linked to achieving strategic goals ( Franco-Santos et al., 2007 ). The interplay between strategic objectives and KPIs becomes pivotal in the comprehensive analysis of business performance optimization.
5) Flexibility and Adaptability:
In the dynamic and unpredictable business environment, the adaptability of strategic objectives becomes a critical factor. Organizations must continuously reassess and, if necessary, realign their strategic objectives in response to changing market conditions, technological advancements, or internal shifts ( Hrebiniak, 2006 ). This adaptability ensures that strategic objectives remain relevant and continue to guide the organization effectively.
6) Challenges and Best Practices:
The literature also highlights challenges in setting and executing strategic objectives, including clarity, communication, and organizational alignment ( Kaplan & Norton, 1992 ). Best practices in strategic objective formulation emphasize clarity, specificity, and the involvement of key stakeholders to ensure commitment and alignment across the organization ( Hrebiniak, 2006 ).
1.3. Synergy between KPIs and Strategic Objectives: Unleashing Performance Optimization
The synergy between Key Performance Indicators (KPIs) and Strategic Objectives forms the nucleus of practical business performance optimization, it is imperative to delve broadly into the intricacies of this symbiotic relationship that propels organizations towards their overarching goals.
1) Strategic Clarity and KPI Alignment:
At the core of this synergy lies the need for strategic clarity. Strategic objectives, representing an organization’s long-term aspirations, set the direction for its activities. KPIs, in turn, serve as the quantifiable expressions of these strategic objectives ( Kaplan & Norton, 1992 ). The alignment of KPIs with strategic objectives ensures that the organization’s performance metrics directly reflect progress toward strategic goals, fostering a unified and focused approach to business operations.
2) Measuring Progress and Success:
KPIs act as the yardsticks by which organizations measure their progress and success in achieving strategic objectives. They provide tangible, measurable outcomes that allow stakeholders at all levels to gauge the effectiveness of their efforts ( Franco-Santos et al., 2007 ). Establishing a clear cause-and-effect relationship between KPIs and strategic objectives facilitates a systematic performance measurement and management approach.
3) Driving Performance Improvement:
The synergy between KPIs and strategic objectives extends beyond measurement; it catalyses performance improvement. Strategic objectives are often broad and aspirational, gain actionable significance by defining relevant KPIs. These indicators pinpoint specific areas of focus and opportunities for enhancement, guiding organizations in their continuous improvement efforts ( Kaplan & Norton, 1992 ).
4) Adaptable Decision-Making:
The dynamic nature of business environments necessitates agile decision-making. The synergy between KPIs and strategic objectives empowers decision-makers with real-time, data-driven insights ( Franco-Santos et al., 2007 ). When faced with choices and challenges, organizations can refer to KPIs aligned with strategic objectives to make informed decisions directly linked to their goals.
5) Enhancing Organizational Alignment:
Strategic alignment is not only about aligning KPIs with objectives but also about fostering organizational cohesion. When employees across different levels understand the KPIs relevant to their roles and how these contribute to strategic objectives, a culture of alignment emerges. This shared understanding enhances collaboration and ensures that individual efforts collectively contribute to achieving organizational goals ( Kaplan & Norton, 1992 ).
6) Feedback Loop for Continuous Learning:
The synergy between KPIs and strategic objectives creates a feedback loop that supports continuous learning and adaptation. By regularly evaluating KPI performance against strategic objectives, organizations gain insights into what works well and areas that require adjustment. This adaptive approach facilitates a culture of continuous learning, enabling organizations to stay responsive in dynamic business environments ( Franco-Santos et al., 2007 ).
1.4. The Need for Comprehensive Analysis: Unlocking the Potential of KPI Alignment
In the pursuit of optimizing business performance through the alignment of Key Performance Indicators (KPIs) and Strategic Objectives, a compelling imperative emerges for a comprehensive analysis that underscores the significance of a thorough and nuanced exploration. This need for a comprehensive analysis can be dissected across several dimensions:
1) Understanding Diverse Industry Dynamics:
Industries vary significantly in their structures, challenges, and competitive landscapes. A comprehensive analysis acknowledges and explores these diversities, recognizing that a one-size-fits-all approach to KPI alignment may not be practical ( Franco-Santos et al., 2007 ). The research can uncover patterns, trends, and sector-specific nuances by delving into multiple industry sectors, providing valuable insights for organizations operating in different contexts.
2) Scalability for Organizations of Varying Sizes:
The business landscape comprises organizations of diverse sizes, from small and medium enterprises (SMEs) to large corporations. A comprehensive analysis considers the scalability of KPI alignment strategies, recognizing that the approaches adopted by larger enterprises may not be directly translatable to smaller entities ( Franco-Santos et al., 2007 ). This dimension ensures that the research findings offer practical applicability across organizational sizes.
3) Integration of Qualitative and Quantitative Methodologies:
The complexity of the relationship between KPIs and Strategic Objectives necessitates an analytical approach that integrates qualitative and quantitative methodologies. Case studies, surveys, and interviews provide qualitative depth, capturing the nuances of organizational practices and challenges, while statistical analyses offer quantitative rigor, substantiating findings with empirical evidence ( Franco-Santos et al., 2007 ).
4) Contextual Factors Influencing KPI Effectiveness:
Recognizing the contextual factors that influence the effectiveness of KPIs is essential for a comprehensive analysis. Organizational culture, technological advancements, and industry dynamics are just a few of the contextual elements shaping KPIs’ impact ( Neely, 2005 ). Understanding these factors ensures that the research insights are not only theoretically robust but also practically relevant to the unique circumstances of each organization.
5) Identifying Common Pitfalls and Best Practices:
A thorough analysis involves an exploration of both successes and challenges. Identifying common pitfalls in KPI alignment and showcasing best practices provides organizations with a roadmap for navigating the complexities of implementation ( Franco-Santos et al., 2007 ). This dimension adds a practical layer to the research, offering actionable recommendations for organizations striving to optimize their business performance.
6) Practical Recommendations for Overcoming Challenges:
In addition to identifying challenges, a comprehensive analysis provides practical recommendations for overcoming these hurdles. Whether addressing data quality issues, organizational resistance, or adapting to technological changes, the research aims to equip organizations with actionable strategies for successful KPI alignment ( Neely, 2005 ).
1.5. Communication and Stakeholder Engagement: A Pillar in Optimizing Business Performance
Within the overarching framework of “Optimizing Business Performance through KPI Alignment: A Comprehensive Analysis of Key Performance Indicators and Strategic Objectives”, communication and stakeholder engagement emerge as a foundational pillar. This crucial aspect not only underscores the importance of conveying KPI insights but also emphasizes the necessity of engaging various stakeholders in business performance optimization.
1) Transparency through Effective Communication:
Effective communication lies at the heart of successful KPI alignment. Transparent communication of strategic objectives and the corresponding KPIs ensures that all internal and external stakeholders have a clear understanding of the organizational direction ( Kaplan & Norton, 1992 ). This transparency fosters a sense of trust and clarity, aligning the entire organization toward shared goals.
2) Internal Alignment and Employee Engagement:
Internally, communication plays a pivotal role in fostering alignment among employees. When employees comprehend the significance of their roles in achieving strategic objectives, they become more engaged and motivated ( Kaplan & Norton, 1992 ). Communication channels, such as regular updates, team meetings, and workshops, become essential tools in ensuring that the workforce is well-informed and invested in the organization’s performance goals.
3) External Communication and Stakeholder Confidence:
Externally, effective communication contributes to building confidence among stakeholders such as investors, customers, and partners. Clear and concise communication of KPIs and their alignment with strategic objectives provides external parties with insights into the organization’s performance and future direction ( Kaplan & Norton, 1992 ). This transparency is integral in maintaining positive relationships and sustaining stakeholder confidence.
4) Adaptable Communication in Dynamic Environments:
In dynamic business environments, adaptability in communication strategies becomes paramount. Organizations need to tailor their messages to different stakeholder groups, recognizing that each may have varying levels of familiarity with KPIs and strategic objectives ( Franco-Santos et al., 2007 ). This adaptability ensures that communication remains relevant and accessible to diverse audiences.
5) Two-way Communication for Feedback Loop:
Communication is not a unidirectional process but a dynamic, two-way exchange. Establishing mechanisms for stakeholder feedback creates a valuable loop that informs the continuous refinement of KPIs and strategic objectives ( Franco-Santos et al., 2007 ). Regular feedback mechanisms ensure that organizations remain responsive to stakeholder expectations and can adapt their performance strategies accordingly.
6) Building a Culture of Openness and Collaboration:
Beyond individual communications, the broader goal is to cultivate a culture of openness and collaboration. Organizations that prioritize transparent communication and stakeholder engagement are more likely to foster an environment where ideas are shared, collaboration is encouraged, and collective efforts are aligned with strategic objectives ( Kaplan & Norton, 1992 ). In summary, communication and stakeholder engagement represent more than just the conveyance of information; they are integral components of a holistic approach to optimizing business performance through KPI alignment. Recognizing the importance of this aspect ensures that organizations can effectively translate their strategic intentions into actionable insights for all stakeholders involved.
2. Research Problems
2.1. Lack of Comprehensive Understanding
Many organizations struggle with a lack of comprehensive understanding regarding the optimal alignment of Key Performance Indicators (KPIs) with strategic objectives. This gap can hinder their ability to make informed decisions and strategically steer the organization toward its goals.
2.2. Selection and Customization Challenges
Businesses often face challenges in selecting and customizing KPIs that align with their unique industry, business model, and strategic objectives. The absence of a standardized framework for KPI selection contributes to ambiguity and inconsistency in performance measurement.
2.3. Dynamic Business Environment
The dynamic nature of the contemporary business environment poses a challenge for organizations to keep their KPIs aligned with evolving strategic objectives. As markets shift and priorities change, a lack of adaptability in KPI frameworks can result in misalignment and suboptimal performance.
2.4. Implementation Hurdles
Implementing an effective KPI alignment strategy can be challenging, with obstacles ranging from resistance to change within the organization to technical difficulties in integrating diverse data sources. Understanding and addressing these implementation hurdles is crucial for achieving successful KPI alignment.
3. Research Objectives
3.1. To Examine the Relationship between KPIs and Organizational Strategy
Investigate the theoretical foundations and empirical evidence supporting the relationship between KPIs and organizational strategy. This objective aims to establish a conceptual framework highlighting the interconnectedness of KPIs and strategic goals.
3.2. To Identify and Categorize Effective KPIs across Industries
Analyze existing literature and case studies to identify various KPIs that have proven effective across different industries. This objective seeks to provide insights into selecting and customising KPIs based on industry-specific factors.
3.3. To Explore Best Practices in KPI Implementation
Investigate best practices and success stories in implementing KPIs, addressing challenges such as data integration, organizational buy-in, and technology adoption. This objective provides practical guidance for organizations seeking to implement KPI alignment strategies.
3.4. To Assess Strategies for Adapting KPIs to Changing Business Environments
Explore strategies employed by successful organizations to adapt their KPI frameworks to changing business environments. This objective recognizes the need for flexibility and responsiveness in KPI alignment to ensure sustained relevance in dynamic markets.
By addressing these research problems and objectives, this article aims to contribute valuable insights to the discourse on optimizing business performance through the strategic alignment of Key Performance Indicators.
4. Literature Review: Optimizing Business Performance through KPI Alignment
4.1. The Role of Key Performance Indicators (KPIs)
KPIs have long been recognized as indispensable tools for monitoring and evaluating organizational performance. These quantifiable metrics enable organizations to measure progress toward strategic goals and objectives ( Neely, 2005 ). Kaplan and Norton’s seminal work on the Balanced Scorecard emphasized the importance of a well-balanced set of KPIs in capturing various dimensions of performance, including financial, customer, internal processes, and learning and growth perspectives ( Kaplan & Norton, 1992 ). As organizations evolve, so too does the understanding of KPIs, moving beyond mere performance measurement to becoming strategic drivers for decision-making and improvement initiatives ( Franco-Santos et al., 2007 ).
4.2. Strategic Alignment of KPIs
The strategic alignment of KPIs with organizational objectives is a cornerstone for effective performance management. Research indicates that organizations with well-aligned KPIs are better positioned to achieve their strategic goals ( Neely, 2005 ). The alignment ensures that performance measurement is directly connected to the organization’s overarching mission and vision, fostering a cohesive approach to decision-making and resource allocation ( Kaplan & Norton, 1992 ). This linkage between KPIs and strategic objectives provides a roadmap for organizations to navigate the complexities of the business environment ( Franco-Santos et al., 2007 ).
4.3. Contextual Factors Influencing KPI Effectiveness
The effectiveness of KPIs is not universal but is contingent on various contextual factors. Organizational culture, industry dynamics, and technological advancements play pivotal roles in shaping the impact of KPIs ( Neely, 2005 ). Understanding these contextual nuances is essential for organizations seeking to optimize their business performance through KPI alignment. While certain KPIs may be universally applicable, their successful implementation is contingent on contextual adaptations that consider the unique characteristics of each organization and its operating environment ( Franco-Santos et al., 2007 ).
4.4. KPIs and Business Performance Metrics
An integral aspect of the literature on KPIs revolves around their impact on diverse business performance metrics. Organizations often utilize KPIs to measure financial outcomes, operational efficiency, customer satisfaction, and employee engagement ( Kaplan & Norton, 1992 ). Quantitative analysis and modeling techniques are employed to establish correlations between KPI alignment and these performance metrics, providing empirical evidence supporting the theoretical framework ( Franco-Santos et al., 2007 ). This research aspect contributes to the practical applicability of the study’s findings, offering organizations insights into the tangible outcomes of effective KPI alignment.
4.5. Challenges and Best Practices in KPI Implementation
Existing literature also delves into the challenges associated with KPI implementation and offers best practices to overcome these hurdles. Issues such as data quality, resistance to change, and the need for continuous reassessment are acknowledged ( Neely, 2005 ). Successful organizations are those that navigate these challenges adeptly, leveraging lessons learned and implementing best practices in KPI selection, monitoring, and adjustment ( Kaplan & Norton, 1992 ).
4.6. Integration of Qualitative and Quantitative Approaches
A comprehensive analysis requires the integration of both qualitative and quantitative methodologies. Case studies, surveys, and interviews with industry experts contribute to a nuanced understanding of how organizations across diverse sectors approach KPI alignment ( Franco-Santos et al., 2007 ). This approach enhances the depth and richness of the research, providing a holistic view of the subject matter.
5. Key Performance Indicators—Measure What Matters
If you could know exactly how your business is performing merely by looking at one screen—on your mobile phone even—what would that screen look like?
What measures would it capture?
We propose that some more explicit steps or guidelines are fitting to properly illustrate how resources can be better allocated to address meaningful measures. To distill this further, we argue that if the objective is to tackle business performance and build out the right KPIs using data that there are four main steps (Figure 1):
![]()
Figure 1. Key performance indicators—measure what matters (Source: Authors).
1) Start with the Industry: Designing and refining key performance indicators for your organisation should begin at the industry/sector level. This is where similarities transaction types, products and service offerings, and operating models provide comparability for performance measures. Furthermore, there are generally available assets compiled by industry research groups that provide business leaders with meaningful benchmarks to assess performance and make strategic operating decisions.
2) Consider the Inputs: KPI measures may be financial (i.e., revenue, profitability, cashflows) or operational (i.e., supply chain, human resources, manufacturing) and the related business processes (i.e., supplier relations, customer relations, production and operations, and sales and marketing) that impact your attention to specific technology systems and data can be multi-faceted. A sound starting point for considering the inputs begins with identifying the related business process flow to which the KPI relates. Specifically, consider a process narrative or graphical representation such as a flowchart or process video as a starting point.
3) Identify and Capture the Right Data: With the proliferation of organizational data assets, business leaders must partner closely with technology leaders to design and implement strategic initiatives. Quite often, companies do well to capture data about their customers, products, supply chains, operations, etc. However, the equally crucial final step of making the data available in valuable ways poses difficulty. Delivering data in valuable ways can mean system integrations (i.e., APIs), scalable reporting (i.e., automated and real-time), and making this information available to key users on any device
4) Establish ownership for the KPI: A common saying we consider in working with clients is “The business doesn’t run inside a spreadsheet.” Indeed, we agree that turning these analytical insights into better organizational performance requires effective communication, aligning management incentives and generating stakeholder buy-in. To illustrate, apply this four-step process to the SaaS industry:
SaaS as an Industry
Worldwide End-User spending for public cloud SaaS will reach $123 billion in 2021 ( Gartner, 2021 ). The SaaS business model is unique, as are company performance measures. More generally, the “as-a-service” or subscription-based business models7/12 Generate revenue from contracted subscriptions, which provides a revenue base that is more predictable than non-subscription-based models where revenues are generated from individual sales and separate buying decisions from customers. This subscription-based revenue model provides the predictability to help with near-term business decisions. Furthermore, as a company gains an understanding of its subscription customers, the rates at which they renew and the needs and wants for additional products or services, the predictability of revenues can extend beyond active subscription terms and instead over the lifetime of a customer. Additionally, unlike non-subscription-based businesses that must build, buy, or otherwise create each new product it sell, SaaS businesses need only to issue incremental licenses to already developed software, which requires less incremental cost for new dollars of revenue. As a result, these nuances in business models and value propositions are at the core of the KPIs used for assessing SaaS performance.
6. Case Study
Under the Bridge Software
To make this point, let’s look at an example company: Under the Bridge Software (“The Company”). In this example, we assume The Company has achieved a YoY Revenue Growth Rate from 2018 to 2019 of 21.42 per cent and seeks to improve this YoY Growth Rate during 2020. The Company has an established data-driven culture, leadership, and management embrace data analytics; the Company has the infrastructure and processes to capture and review the data points relevant to the YoY revenue growth rate KPI and has the required analytics resources available to visualize, model, and understand the components of this change, at a customer level.
1) Start with Industry:
In the SaaS industry, for example, one highly regarded “dataset” used in benchmarking and assessing Company performance is the annual KeyBanc Capital Markets Private SaaS Company Survey, which compiles data from more than 500 senior executives worldwide submitted anonymously and confidentially. Not only can this data be helpful in benchmarking performance against comparable companies, but it can also serve as a roadmap for the type of metrics and data your organization might want to capture 8/12.
In the SaaS industry, revenue and revenue growth-related KPIs are most commonly used to compare companies and scrutinize performance. Therefore, revenue growth components become critical considerations in modelling future expectations, and improvements in these metrics alone can have significant implications on enterprise valuations. These components, namely revenue churn, upsell/downsell, and revenue from new bookings/logos, are key to improving performance. A visualization such as the FY18-19 Revenue Bridge below focuses on these trends.
A Revenue Bridge is a form of a waterfall chart that visually represents increases and decreases in revenue during a given period at various categorical levels, effectively summarized for an executive audience. At a high level, The Company experienced low churn (–0.6%), and considerable upsell growth (+13.6%)— primarily from expanding the number of users and new logo revenues of +8.5 per cent of FY18 revenue.
2) Consider the Inputs:
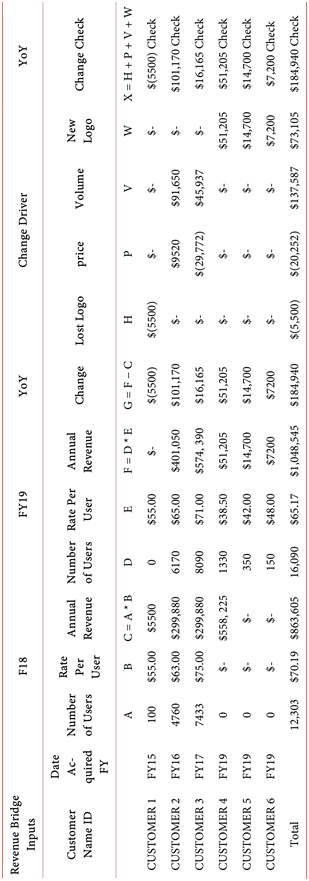
In a SaaS business model, revenue is a function of the number (#) of users over a given period times (*) rate per user. Revenue-related KPIs are financial measures, and the related business processes are within the sales and finance functions of the business. More specifically, revenues from expanding relationships with existing customers are generated by a different business process (i.e., contract renewal order administration) than revenues from acquiring new clients (i.e., sales execution) and separate considerations are needed. The inputs used in the Revenue Bridge are the following: Revenue detail by Customer, Customer acquisition dates, Customer termination dates, User volumes, Rates per user, and Product Data (SKUs) (Figure 2).
3) Identify and Capture the Right Data:
The data points required for the Revenue Bridge in our example include billing and revenue details per customer, which are typically maintained within a Company’s ERP, and customer acquisition date, price, and volume, which are pretty often maintained at the CRM level. In many cases, system synergy between ERP and CRM enables multi-dimensional customer-level analytics, which can provide key insights and context into performance. In order to prepare the summary bridge, some data organization is required, potentially by a junior analyst who can compile and analyze data from different sources. The revenue detail by the customer for each fiscal year is compared, and then additional customer-level data points are used to stratify the components of the change. In the context of the problem or question, The Company utilized internal and external data points and only needed to reach the Business Intelligence level of analytics. Table 1 below summarizes the inputs of the Revenue Bridge visualization:
Table 1. Revenue detail by customer.
4) Establish Ownership:
By analysing the components of this YoY revenue growth, management can see that The Company is doing well in retaining customers and growing their use of The Company’s product. For instance, $975,440, or approximately 93 per cent, of revenue generated in FY19 was from customers that existed in FY18. From this, management can see that the growth in existing accounts is a significant component of YoY increases in revenue. It validates that The Company has a compelling product market fit for its offerings and has performed well in on-boarding, supporting, and retaining clients.
Furthermore, it’s clear to see an increase in revenue due to upselling existing customers has been primarily driven by an increase in user count (as opposed to an increase in prices peruse), which is a strong indication that customers are expanding their use of The Company’s product without significant per user price pressure—a favourable trend for profitability. These trends in solid retention and upsell are fundamental strengths and validators of The Company’s value proposition. On the other hand, a significant portion of The Company’srevenue growth is generated by existing customers, which means that the sales productivity of new logo pursuits has been a performance laggard and could be justification for management to increase its investment in its sales and marketing efforts toward new logos to increase revenues in FY20. Finally, management has to be willing to embrace data collection and analysis and rely on the results to impact decision-making and strategy going forward.
7. Closing Remarks
In closing, whether your business is in the SaaS industry or in any other industry, what remains constant for any identified KPI is that it represents a measure of what matters. For this reason, KPIs present a reliable recipe/starting point for developing your organization’s data analytics strategy as long as they are defined within the business model and industry context. Firms may benefit from a dashboard pulled from a series of critical reports to monitor these KPIs. While the cost of collecting data can seem daunting, the lower cost of cloud computing has made it easy to store and analyze data without significant expense.
A starting point may be to look internally at several one-off projects to address critical firm strategic initiatives executed by tech-savvy, eager staff who can utilize the now widely available, low-cost software tools and technical training. Finally, highly qualified, independent consultants detached from large consulting firms who do not charge exorbitant fees may be able to assist in identifying the right technology systems, types of data, analyses that need to be performed, and practices that should be in place to make that happen.