Modeling Electricity Demand in the Ecowas Region: New Insights Using Fixed Effect with Driscoll and Kraay Standard Errors ()
1. Introduction
The importance of energy consumption in the growth and development process of economies, as well as its role in facilitating production and improving household welfare, is widely acknowledged by scholars and policymakers (Wolde-Rufael 2006; Karekezi & Kithyoma, 2002) . In addition, the absence of accessible and cost-effective energy services is believed to pose a significant barrier to the advancement of human, social, and economic development and the attainment of the Millennium Development Goals (MDGs). This is due to the significant influence that energy services have on several aspects, such as productivity, health, education, access to clean water, and communication services (UNIDO, 2011) . Akinyemi et al. (2017) posit that energy holds a pivotal position within the process of economic development, owing to its substantial contribution to generating government revenue. In recognition of its relevance in prompting economic growth and prosperity, several countries—both industrialised and developing—initiated major electricity sector reforms in the early 1990s aimed at boosting electricity supply (Bacon, 1999; Steiner, 2001) .
In the theoretical literature, there are potentially three channels through which electricity consumption might aid in the expansion of the economy. The first is that electricity is a crucial factor of production for businesses, and as it is not easily replaced by other factors; its absence might constrain output. Second, the government uses electricity to provide essential services like public education and healthcare. Third, using electricity can have indirect positive effects on the well-being of households through time savings, better communication, and more money spent on education.
The prioritisation of access to energy within the West African Rural and Peri-urban Electrification Master Plan by the ECOWAS Commission was driven by the acknowledgment of its capacity to foster inclusive growth in the region. The Heads of State and Government formally adopted the aforementioned plan in 2018 (Ecowas Commission, 2022) . Since its adoption, the execution of the plan has received substantial backing from various technical and financial entities, notably the World Bank and the African Development Bank (Ecowas Commission, 2022) . Within the framework of this project, the ECOWAS Commission initiated the Regional Electrification Project for 20,000 villages (PRODEL 20,000), encompassing all 15 member states of the ECOWAS. The estimated preliminary expenditure for this endeavour amounts to approximately US$2.7 billion (Ecowas Commission, 2022) . This is of significant magnitude and will emphasise providing energy access to households as well as healthcare centres, water pumping units, small businesses, and information technology through off-grid applications such as solar photovoltaic kits and modular solar systems. Additionally, the project will involve network upgrade and expansion. Upon successful implementation, the project would facilitate the attainment of a 70% access rate in the region over the course of a decade. This project serves as a supplementary initiative to support the endeavours of Member States in the domain of electrification (Ecowas Commission, 2022) .
Notwithstanding the implementation of regional initiatives and corresponding efforts at the national level, as well as the significant potential for both fossil and renewable energy sources, the West Africa region continues to face significant energy deficits. According to Elemele (2018) , the present electricity supply in the ECOWAS region is approximately 15 GW, whereas the demand for electricity is 24 GW, resulting in a deficit of 9 GW. This electricity deficit is reflected in a significant proportion of the population, with approximately 180 million individuals in the ECOWAS region without access to electricity, accounting for approximately 60% of the total population (ISEP, 2018) . As of 2021, the region exhibited a notable level of total energy demand within Africa. This upward trend in energy consumption has been observed since 2012, as shown in Figure 1. In the face of increased demand, the member states of ECOWAS continue to experience significant challenges in ensuring energy security.
These challenges include issues such as inadequate system reliability, limited infrastructure, dependence on fuel imports, a high reliance on fossil fuels, hydropower, and traditional biomass resources (ISEP, 2018) . Out of the total available installed capacity of 16.3 GW, renewable energy capacity accounts for approximately 5.14 GW (ISEP, 2018) . In addition, the widening disparity between the capacity of generation and the level of demand is further intensified by the significant commercial and technical losses, which have been estimated at 21.5% (Ecowas Commission, 2020) . These factors have contributed to the region having the lowest rates of modern energy consumption globally (Ecowas Commission, 2020) .
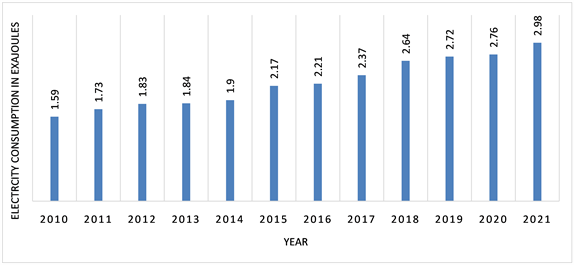
Figure1. Primary energy consumption in West Africa from 2010 to 2021. Source: Authors using data from Statista 2022.
Therefore, to effectively address the electricity demand within the Ecowas region, it is imperative to identify the underlying drivers of energy demand in the region. Understanding these dynamics will enable the effective planning and alignment of production with consumption patterns. Hence, this study aims to model and analyse electricity demand in the ECOWAS region from 1980 to 2019 by adopting a fixed effect approach with Driscoll and Kraay standard errors. By utilising this methodology, this research seeks to provide novel insights into the factors influencing electricity demand in the ECOWAS region. In addition, this approach addresses concerns related to serial correlation, heteroscedasticity, and cross-sectional dependence in the residuals.
The study is structured as follows: following the introduction, Section 2 under-takes a thorough review of pertinent empirical literature. In Section 3, we expound upon the data and methods utilised, while in Section 4, we undertake a comprehensive analysis as well as an explanation of the findings. Section 5 is dedicated to the discussion of conclusions, policy implications, limitations, and suggestions for further research.
2. Literature Review
The examination of the empirical literature reveals a substantial collection of scholarly articles that have sought to develop models for electricity demand in both advanced and emerging nations in the past decades. The literature has identified three distinct methodologies for estimating electricity demand.
The initial body of literature focused on empirical studies aimed at estimating electricity demand at the aggregate level. For example, an investigation conducted by Kwakwa (2017) aimed to estimate the factors influencing electricity consumption in Egypt during the period 1971 to 2012. The author employed the Engle-Granger and Phillips-Ouliaris tests to ascertain the existence of a long-term cointegrating relationship among electricity consumption, price levels, income levels, urbanisation, monetary development, carbon emissions, trade, and education. The author also employed the Phillips and Hansen Fully Modified OLS and Park’s Canonical Cointegrating Regression models to estimate the long-run parameters and concluded that income, urbanisation, financial development, trade, and education have a positive impact on electricity consumption. Nevertheless, the process of industrialisation in Egypt was observed to have a detrimental impact on electricity consumption. Conversely, it was determined that both price and carbon emissions did not exhibit any noteworthy influence on electricity consumption in the country. In another study conducted by Kwakwa (2018) , a combination of methodologies within the STIRPAT framework were employed to assess the electricity demand in Benin. The findings revealed that various factors, namely population, urbanisation, education, and industrialization, exerted positive influences on electricity consumption in Benin. Conversely, income was found to have a negative impact on electricity consumption. The study also identified demographic factors as having a significant influence on electrical consumption. The author additionally recognised a temporal aspect in the factors influencing electricity demand. This phenomenon was observed in the outcomes derived from the rolling regression estimates, indicating a consistent pattern of pole shifting throughout the 36 rolling periods. These shifts consistently aligned with noteworthy political, social, and economic transformations at both local and global levels. Al-Bajjali and Shamayleh (2018) employed the Johansen (1991) cointegration and vector error correction modelling technique to estimate the electricity demand for Jordan during the period 1986-2015. They also discovered evidence of long-term cointegration between electricity demand and its explanatory variables. The findings of the study indicate that there are significant relationships between various factors and electricity consumption, both in the long-run and short-run. Specifically, in the long-run, variables such as GDP, urbanisation, economic structure, and aggregate water consumption exhibit positive and statistically significant impacts on electricity usage. Conversely, electricity prices demonstrate a negative and statistically significant influence on electricity consumption. In the immediate term, the population is recognised as the primary catalyst for heightened electricity consumption. Dey and Tareque (2020) employed the ARDL technique, a novel methodology with desirable finite sample properties, to investigate the relationship between electricity consumption and real GDP in Bangladesh over the period 1971-2014. The research findings indicate a positive correlation between electricity consumption and GDP. These findings are applicable to both the short-run and long-run coefficients. The findings of the study also provide empirical evidence supporting a bidirectional causal association between electricity consumption and real GDP per capita in the context of Bangladesh. Onisanwa and Adaji (2020) employed the ARDL modelling approach to estimate the factors influencing electricity consumption in Nigeria over the period of 1981 to 2017. The authors arrived at the conclusion that the variation in annual electricity consumption can be primarily attributed to factors such as population density and per capita income. Contrary to initial expectations, the empirical findings revealed a negative relationship between per capita income and electricity consumption in the long run. The study also revealed that per capita income and the quantity of electricity customers exhibited a positive correlation with electricity consumption. Conversely, the presence of electricity shortage demonstrated an inverse relationship with electricity consumption. Using the nonlinear autoregressive distributed lag (NARDL) method, Sharma and Kautish (2019) conducted a study on the factors influencing electricity consumption in India during the period of 1980 to 2015. The findings indicate that both positive and negative fluctuations in GDP have a lasting, favourable impact on electricity consumption. In contrast, positive exogenous shocks to foreign direct investment (FDI) exert an influence on electricity consumption, whereas negative exogenous shocks exhibit a detrimental long-term effect. The findings of the study also revealed that in India, there is a negative and statistically significant relationship between increased oil consumption and electricity demand. Nguyen Minh Ha and Bui Hoang Ngoc (2021) conducted a comparable analysis focusing on Vietnam, examining the relationship between energy consumption and economic growth over the period 1971 to 2017. The study employs an asymmetric autoregressive distributed lag model to analyse the relationship between the variables. The empirical evidence indicates that the adverse impacts of electricity consumption on economic growth in Vietnam are more significant than the positive effects. Koranteng et al. (2022) conducted a cross-country study to investigate the determinants of electricity demand within a sample of Ecowas countries during the period spanning from 1980 to 2018. The study employed the panel data estimation technique, specifically by estimating pooled, fixed effect, and random effect models. They concluded that that there is a substantial correlation between increasing populations and the demand for electricity. The study also found a positive and statistically significant relationship between GDP and the amount of electricity used. In addition, electricity consumption is positively and statistically significantly impacted by trade openess and foreign direct investment inflows. They also showed that industrial output influences electricity consumption in a favourable way. However, the amount of electricity used is significantly and negatively impacted by the consumer price index.
Using a disaggregated approach to modeling electricity demand, Tebogo and Roula (2022) examined electricity consumption in all nine provinces of South Africa spanning the years 1995 to 2019. The empirical analysis employed two-panel estimation methods, specifically the fixed effect and pooled mean group. They concluded through the fixed effect technique that the primary determinants of electricity demand in South Africa are population and electricity costs. The findings obtained from the pooled mean group model indicate that the various provinces in South Africa exhibit heterogeneous responses and determinants in relation to their electricity demand. The potential influence of socioeconomic and geographical factors on consumer responses to fluctuations in electricity costs was suggested, with all provinces being impacted by both economic growth and population dynamics.
There is also a growing body of literature that examines the influence of environmental factors and tourism on electricity consumption. As an alternative to the traditional approach in modelling electricity demand, Almuhtady et al. (2019) employed a methodology that incorporated trends, seasonality, and weather conditions to estimate the electricity demand in Jordan from 2007 to 2016.The study employed the degree-day methodology to analyse real weather data and assess the seasonal variation indices across different temporal scales, including monthly, daily, and hourly intervals. The primary finding of the study reveals a distinct monthly fluctuation in electricity demand in Jordan over the duration of the research, suggesting the existence of seasonal patterns. Two primary seasonal peaks, namely winter and summer, were identified in the study. In order to identify further trends, daily and hourly indices were employed. Based on the analysis conducted, it was deduced that the demand exhibited its lowest levels on Fridays, with both Thursdays and Saturdays also demonstrating lower values compared to the remaining days of the week. The hourly data indicates that there is an upward trend in demand during the early morning hours on weekdays, and a similar pattern is observed on weekends, albeit with a later onset. This trend continued until noon, at which point demand reaches its highest point before gradually decreasing in the hours leading up to sunset. Furthermore, during each year of the study period, data was collected on the thermal comfort zone and the rate of increase in electricity demand for temperatures exceeding this zone, utilising an optimally designed piecewise function. The findings indicated that socioeconomic factors, such as fuel and electricity prices, were causing changes in comfort zones, particularly in relation to heating. However, it was observed that the average center of thermal comfort remained largely consistent with the commonly referenced literature value of 18˚C. The most significant range of variation was observed in the heating base temperature, which spanned from 13.5 degrees Celsius in 2007 to 18 degrees Celsius in 2009. In their study, Sarkodie and Adom (2018) examined the impact of climate change on electricity consumption in Kenya. They utilised a nonlinear iterative partial least squares model to estimate the drivers of aggregate energy, fossil fuel, and electricity consumption. The researchers reached the conclusion that various factors, including price, population density, urbanisation, and the renewable energy potential of hydropower, contribute to the promotion of reduced energy consumption. The study revealed a negative correlation between increasing income and climate change with the decline in energy levels. In contrast to the positive correlation between population growth and increased demand for various energy sources, empirical evidence suggests that population growth exerts a counterintuitive influence on electricity consumption. In a recent scholarly investigation conducted by Pavlos Stamatiou (2022) , an alternative approach to modelling electricity demand in Italy was presented, which involved the inclusion of tourist arrival data within the model. The sample was created using annual data spanning from 1990 to 2018. The Autoregressive Distributed Lag (ARDL) bounds testing method and the causality method proposed by Toda and Yamamoto (1995) were employed due to the presence of numerous variables and a limited sample size. The findings demonstrate a significant association between electricity consumption, inbound tourism, and long-term economic growth as measured by GDP. Moreover, the consumption of electricity exhibits a strong correlation with fluctuations in tourist numbers and the pace of economic expansion. The results of the causality analysis support unidirectional causalities connecting economic growth and international visitors’ electricity usage. In addition, the influx of international visitors has a direct impact on electricity consumption through its effect on the economy.
From the review of the related literature, it emerged that there is a paucity of empirical studies on modeling electricity demand in the Ecowas region. This study, therefore, contributes to the existing literature on determinants of electricity demand in the Ecowas region using a novel methodology, the fixed effect with Driscoll and Kraay standard errors which accounts for serial correlation, heteroscedasticity and cross sectional dependence which previous regional studies ignored.
3. Data and Methodology
3.1. Data
This research employs annual balanced panel data encompassing eleven (11) countries within the Economic Community of West African States (ECOWAS) during the period spanning from 1980 to 2019. The group of countries included in this study consists of Benin, Burkina-Faso, Cote d’Ivoire, The Gambia, Ghana, Mali, Niger, Nigeria, Senegal, Sierra Leone, and Togo. The selection of countries and the duration of the investigation were determined based on data availability. The data utilized in this study were obtained from the Energy Information Administration (EIA) database (2020) and the World Development Indicator database (WDI, 2021) . The variables under investigation include electricity consumption, real GDP growth rate, openness, foreign direct investment, population growth rate, and industry value added. Since all the variables are in percentage, electricity consumption was transformed to natural logarithms to ease the interpretation of the results. Table 1 displays the variables, their definitions, and sources used in the study.
3.2. Model Specification
This study utilised the model proposed by Koranteng et al. (2022) to estimate electricity demand in a sample of countries in the Ecowas region from 1980 to 2019. The adapted model is outlined as follows:
(1)
3.3. Estimation Technique
This study employed a panel data regression estimation technique to examine the electricity demand within a cross-section of Ecowas countries. The advantages of each estimation technique were taken into account when the decision-making process to determine which one to implement. There are three advantages that arise from employing this estimation approach in data analysis. Firstly, it explicitly takes into account heterogeneity by allowing for individual-specific heterogeneity. Secondly, it results in increased variability, reduced collinearity among variables, a greater number of degrees of freedom, and improved efficiency (Baltagi, 2005) . According to Gujarati (2004) , the incorporation of cross-section and time-series variables in panel data can effectively mitigate the issue of omitting or neglecting pertinent variables.
The first step in the empirical strategy is undertaking an exploratory data analysis using descriptive statistics, and check for multicollinearity between the independent variables prior to moving on to the estimation phase of the panel data models. Multicollinearity is achieved by computing the correlation matrix of the independent variables and examining the variance inflation factor (VIF) and tolerance value of each variable in the model.
![]()
Table 1. Variables, definitions and sources.
In light of the panel data structure employed in our study, we sequentially conducted estimations using the pooled ordinary least squares, fixed effect model, and random effect model. The specification of the generic static panel model is as follows:
(2)
The dependent variable, denoted as
, represents the variable being studied. The explanatory variable, denoted as
or a vector of explanatory variables, represents the factors that are hypothesised to influence
. The individual specific effects, denoted as
, capture the unobserved characteristics that are specific to each individual in the study. Lastly, the standard error term, denoted as
, represents the random variation or error in the relationship between
and
. The purpose of incorporating individual-specific effects is to account for unobserved heterogeneity or factors that may influence the dependent variable. Time-specific effects can be incorporated to consider the influence of time-varying factors that have consistent effects on all cross-sectional units. Nevertheless, the estimation process overlooked the time-specific effects due to the extensive duration of this study.
The estimation of Equation (2) is contingent upon the assumption of the nature of its parameters, which can be classified as follows: 1) constant and homogeneous across all units, 2) constant but heterogeneous across units, or 3) random. In the event that the error term conforms to the assumption of classical linear regression, the method of ordinary least squares estimation may be employed in the initial scenario. The estimator obtained in this case is the pooled ordinary least squares estimator. In the second and third cases, it is necessary to employ the fixed-effects panel estimator and the random-effects panel estimator, respectively. Given the presence of a vector of explanatory variables in the panel data model, we will now proceed to outline the specifications of the standard static panel data models.
Thus, the three models pooled ordinary least squares, fixed effect model and random effect Model are specified as:
Pooled Ordinary Least Squares Model
The pooled ordinary least squares model specification posits that the individual-specific effects are regarded as constant and common among countries. Thus, the model would be specified as:
(3)
The Fixed effect model
To accommodate the inherent variability in characteristics among each cross-sectional unit, the intercept of the fixed effect model regression model is allowed to differ across individuals, as demonstrated in the following equation:
(4)
Whether or not the explanatory variable is correlated with the error term, the fixed effect estimator provides reliable estimates. However, since it only takes into account within-variations, it is ineffective if there is no correlation between them. The estimator also has the drawback of not being able to use time-invariant variables in the model, as these will be eliminated during the within-transformation process.
Random effect Model
One of the primary benefits of the random effect model is its ability to incorporate time-invariant variables as explanatory factors. This is made possible by assuming that the error term of the entity being studied is uncorrelated with the predictors. In the random effect model, it is necessary to explicitly specify the individual characteristics that have the potential to influence predictor variables. The estimation of the within-cluster correlation is conducted using the feasible generalised least squares method.
(5)
Following the estimation of the three models, a series of diagnostic tests were conducted in order to determine the most suitable model for this study. The F-test was employed to make a selection between the pooled ordinary least squares and fixed effect models, subsequently followed by the application of the Breusch and Pagan LM test to compare the pooled ordinary least squares and random effect models. Ultimately, the Hausman test is employed to determine the most appropriate choice between fixed effect and random effect models.
Next, we assessed the robustness of the preferred model. The post estimation diagnostics tests were conducted by investigating the presence of cross-sectional dependence, heteroscedasticity, and autocorrelation. Initially, the Breusch-Pagan LM Cross-sectional dependence (CSD) test was conducted, with the null hypothesis being the assumption of cross-sectional independence. The Wooldridge’s test is employed to ascertain the presence of autocorrelation with the null hypothesis that there is no presence of first-order autocorrelation. Finally, the presence of heteroscedasticity is assessed by conducting the Wald test. In the event that these issues are present within the preferred model, it is imperative to undertake the necessary adjustments in order to obtain outcomes that are both reliable and resilient.
4. Results and Discussion
4.1. Descriptive Statistics
The descriptive statistics for all the variables used in the study are presented in Table 2. The average electricity consumption in the sample of countries in Ecowas is 2.54 with a maximum of 27.96 and minimum of 0.03. The summary statistics also shows that openess has the highest average value, while industry value added had the lowest average value. Furthermore, openess exhibited the highest volatility with a standard deviation of 20.59, while population growth rate exhibited the least volatility with a standard deviation of 0.66.
4.2. Correlation and Multicollinearity Diagnostics
Multicollinearity among the independent variables was assessed through the utilisation of a correlation coefficient test, which was subsequently confirmed by the application of the variance inflation factor (VIF) and tolerance values. According to Gujarati and Sangeetha (2007) , the presence of multicollinearity can be identified when there is a correlation exceeding 0.8 between independent variables and a VIF value surpassing 10. According to the findings presented in Table 3, there is a positive correlation between lec and rgdpgr, fdi, and indus. However, a negative correlation is observed between lec and openess as well as popgr. Furthermore, it is apparent that the correlation coefficients among the explanatory variables is very low. Therefore, it can be inferred that there is no significant issue of multicollinearity. This assertion is supported by the Variance Inflation Factor (VIF) values of the variables, all of which are below 10.The obtained results provide justification for incorporating all the explanatory variables in the empirical analysis.
Source: authors’ estimation using Stata17.
![]()
Table 3. Correlation coefficients and multicollinearity.
Source: authors’ estimation using Stata17.
4.3. Choice between the Pooled ordinary Least Squares Model, Fixed Effect Model and Random Effect Model
For the purpose of assessing the most suitable model for our analysis, we initially estimated three standard static models: pooled ordinary least squares, fixed effect, and random effect models. The estimates of the three models are presented in Table 4.
In what follows, we run some diagnostic tests to determine the efficient model out of the three estimation techniques.
4.3.1. Test for Fixed Effect or Pooled Ordinary Least Squares Estimator
First, the F test has been utilised following the fixed effect estimation to determine the suitability of either a pooled or fixed panel estimation. According to the F test results presented in Table 5, it can be concluded that there are statistically significant individual country effects. This finding suggests that failing to account for unobserved heterogeneity can lead to omitted variable bias, as discussed in previous studies such as Hsiao (2003) and Skrondal and Rabe-Hesketh (2004) . Hence, it can be concluded that the estimates obtained through pooled ordinary least squares are subject to bias and inconsistency. Consequently, we acknowledge the existence of country-specific effects.
4.3.2. Test for Random Effect or Pooled Ordinary Least Squares Estimator
The Breusch and Pagan Lagrange Multiplier (LM) test is employed to make a determination between the random effect regression and the pooled Ordinary Least Squares (OLS) regression. The null hypothesis in the LM test posits that there is no variance present across entities. In other words, there is a lack of substantial variation observed among different regions, indicating the absence of a panel effect. The null hypothesis is rejected, leading to the conclusion that the utilisation of the random effect is suitable, as indicated in Table 5.
4.3.3. Hausman Test
The Hausman specification test is utilised to compare the fixed effect model and the random effect model. The statistical significance of the Hausman test (refer to Table 5) suggests that the fixed effect model is the most appropriate for the analysis when compared to the random effect model.
![]()
Table 4. Regression results for modelling electricity demand in Ecowas.
Source: authors’ estimation using Stata17 * p < 0.05; ** p < 0.01; *** p < 0.001.
Source: authors’ estimation using Stata17.
4.4. Robustness of the Fixed Effect Model Estimates
Given the compelling evidence supporting the suitability of the fixed effect model, our subsequent step involves assessing the resilience of this model through the application of tests for serial correlation, heteroscedasticity, and cross-sectional dependence.
4.4.1. Test for Serial Correlation
Wooldridge’s test (2002) was used to determine if serial autocorrelation is present in the fixed effect model. The test reveals the existence of autocorrelation since it rejects the null hypothesis at 1% level of significance (see Table 6).
4.4.2. Test for Heteroskedasticity
The existence of group-wise heteroskedasticity was tested using the Modified Wald’s test. Table 7 shows that the homoscedasticity hypothesis is rejected at a 1% level of significance, contradicting the null hypothesis. We infer that the residuals of the fixed effect model exhibit heteroscedasticity.
4.4.3. Test for Cross Sectional Dependence
The Breusch-Pagan LM test of independence was applied to ascertain whether our data showed any signs of cross-sectional dependency or contemporaneous correlation. The motivation for using the Breusch-Pagan LM test is that the time dimension of our data is more extensive than the cross-sectional components.
The Breusch-Pagan LM test findings (shown in Table 8) indicate that the null hypothesis of cross-sectional independent should be rejected. This leads us to conclude that the fixed effect model generates regression residuals that exhibit cross-sectional dependence.
Given that the null hypothesis of no specification issues has been rejected by all three tests, it is crucial to resolve the above concerns to guarantee the reliability of the statistical inference. In the panel data literature, two distinct methodologies have been proposed as potential solutions for addressing the issues of heteroskedasticity, autocorrelated error structure, and spatial and temporal dependence within the fixed effect model. The methods under consideration are the Feasible Generalised Least Squares (FGLS) estimator and the Driscoll-Kraay standard errors. These methodologies are particularly relevant when the time dimension exceeds the number of cross-sectional elements. The panel fixed effect model with Driscoll and Kraay (1998) standard errors was utilised in this
H0: no first-order autocorrelation.
H0: sigma (i)2 = sigma2 for all i.
![]()
Table 8. Results of the cross sectional dependence test.
H0: no cross-sectional dependence.
study. The choice of this approach was motivated by the robustness of its standard errors, which surpass those of the FGLS by not imposing limitations on the number of cross-sections (Hoechle, 2007) .
4.5. Analysis of the Result
Table 9 displays the outcomes of the estimation conducted on the fixed effect model with Driscoll and Kraay Standard Errors. The F-statistic (Prob > F = 0.0000) suggests that there is strong evidence to support the joint significance of all the coefficients in the model. Moreover, it can be observed that the signs of the coefficients are consistent with the apriori expectation. The findings indicate that within the Ecowas region, the growth rate of real gross domestic product, foreign direct investment as a percentage of gross domestic product, and industry value added as a percentage of gross domestic product all exhibit positive and statistically significant impacts on electricity demand. Nevertheless, it is evident that factors such as openness and population growth do not exert any discernible impact on electricity demand. Specifically, it is noteworthy that the coefficient of the growth rate in gross domestic product exhibits a positive and statistically significant relationship, as anticipated, at a significance level of 5%. The findings suggest that an increased level of economic growth is associated with an increase in the demand for electricity. In the context of this analysis, it can be observed that a marginal increase of 1% in economic growth, while holding all other factors constant, is associated with an average increase of 0.021% in the demand for electricity. This finding is consistent with the results reported by Koranteng (2022) in the context of Ecowas, Dey and Tareque (2020) in the case of Bangladesh, and Al-Bajjali and Shamayleh (2018) in relation to Jordan.
These studies collectively indicate that an upward trajectory in income levels is associated with a corresponding increase in the utilization of domestic electrical appliances. The coefficient associated with foreign direct investment exhibits a positive and statistically significant relationship with electricity demand at
![]()
Table 9. Fixed effect estimation with driscoll and kraay standard errors.
Source: authors’ computation using Stata17.
a 1% level of significance. The presence of a positive coefficient in the context of foreign direct investment suggests that a 1% rise in inflows of foreign direct investment while holding all other variables constant, results in a corresponding increase of 0.058% in the demand for electricity. The obtained outcome corroborates the conclusions drawn by Sharma and Kautish (2019) in their research conducted on India, wherein they observed a favourable impact of foreign direct investment inflows on the demand for electricity. A comparable outcome is observed in relation to industrial value added, which demonstrates a positive impact on the demand for electricity. The findings suggest that there is a positive relationship between industry value added and electricity demand in the Ecowas region, with a 1% increase in industry value added corresponding to an average increase of 0.027% in electricity demand. The result is in line with expectations, as the industrial sector is dependent on electricity as a crucial input for optimal operational performance. The empirical evidence presented in this study aligns with previous research conducted by Kwakwa (2017) , which demonstrates a positive correlation between industrialization and electricity consumption in Egypt. Similar findings have been reported by Adom and Bekoe (2013) in the context of Ghana, Keho (2016) for Benin, and Koranteng (2022) in a sample of four countries within Ecowas.
5. Conclusion
The objective of this study is to model electricity demand in the Ecowas region. The research employed a balanced panel comprising a sample of 11 countries out of the total of 15 countries within the ECOWAS region. The data spanned the period from 1980 to 2019. The study has employed a model that relates the demand for electricity to various factors, including real GDP, trade openness, inflows of foreign direct investment, population growth, and industry value added. Prior to conducting a formal analysis of the model, a descriptive statistics procedure is employed to provide a comprehensive overview of the variables included in the study. This procedure aims to describe the primary characteristics of the data used by using various measures of central tendency, such as the mean, were employed, along with measures of variability, including the standard deviation. Furthermore, the presence of multicollinearity was assessed by conducting pairwise correlation coefficient tests, which were further confirmed through the calculation of the variance inflation factor (VIF) and Tolerance values for each variable.
In accordance with the research objective, the specified econometric model was estimated utilizing three commonly employed static model estimation techniques: pooled ordinary least squares, fixed effect, and random effect estimators. In the subsequent stage, the models were subjected to a battery of diagnostic tests to determine the existence of individual-specific effects. These tests included the F-test and the Breusch and Pagan LM test. The diagnostic results indicate the presence of heterogeneity specific to each country. The Hausman test was used to determine the most appropriate model between the fixed effect and random effect models. The outcome of the Hausman test indicated that the fixed effect model was the most preferred model. The robustness of the fixed effect model against serial correlation, heteroscedasticity, and cross-sectional dependency was then evaluated using a battery of diagnostic tests. The findings of the study indicate the presence of serial correlation, heteroscedasticity, and cross-sectional dependence in the fixed effect model. The research employed the fixed effect model with Driscoll and Kraay standard errors as a means to address the issues of error misspecification that was identified in the fixed effect model.
The findings from the empirical analysis demonstrate a positive and statistically significant relationship between real GDP, foreign direct investment, and industry value added on electricity demand in the Ecowas countries included in the sample. However, there is no evidence to suggest that openness and population growth impact electricity demand. The study’s findings have substantial policy implications. To begin with, it is imperative for the governments within the Ecowas region to enhance their investment efforts in the energy sector. This strategic approach is crucial in fostering robust economic growth, generating employment opportunities, and alleviating poverty within the region. Furthermore, it is imperative to implement policies that specifically aim to enhance the business environment in order to facilitate the influx of foreign direct investment and promote industrialization. This, in turn, will lead to an increase in electricity demand for productive purposes.
While this study provides a significant contribution to the empirical research on modeling electricity demand in the Ecowas region, it is not exempt from certain limitations. Due to the paucity of data, certain explanatory variables (for example, electricity prices) that are likely to impact electricity demand were not captured when specifying the model. These issues hold potential for further investigation in future scholarly endeavours related to this topic.