Is an African Monetary Union Project for the CAEMC Countries Possible? ()
1. Introduction
What future of the CFA franc? This is the question posed by Sylviane Guillaumont Jeanneney and Patrick Guillaumont1. For these authors, this question follows the uncertainties of the global economy, the difficulties of Central African countries and the “progress” of trade integration in West Africa.
Today, this question is posed in terms of challenging the French colonial legacy, which is based on a series of African integration initiatives of regional and continental scope in six stages2. For the vast majority of authors3, the cause lies in the operating mechanisms of the Franc Zone.
The prospect of an African monetary union therefore becomes an imperative. However, if the CFA zone finds its answer in the historical evolution of France and African countries, the why of the future African monetary union is regarded as a change that presupposes a break with the principles and modalities of operation of the Franc Zone.
The questioning of the CFA franc focuses in particular on the obligation to centralize foreign exchange reserves with the French Treasury. This obligation no longer concerns the West African Economic and Monetary Union (WAEMU), as the new4 agreement of December 2019 means that the Central Bank of West African States (CBWAS) is no longer required to deposit 50% of its reserves with the French Treasury.
France’s withdrawal from the CBWAS’s governing bodies is therefore a foregone conclusion. In Africa, however, fiscal problems are far more serious and the credibility of monetary institutions is more fragile ( Masson & Pattillo, 2004: p. 11 ). As Avom (2019: p. 85) points out, “Without the stabilizing presence of France in the governance bodies of the two Franc Zone central banks, the poor quality of institutional governance observed in most countries would certainly have had an impact on the definition and conduct of monetary policy”.
Nubukpo (2012: p. 141) acknowledges, but does not emphasize, France’s stabilizing presence, when he points out that the monetary management system has enabled WAEMU member states to enjoy monetary stability over the past fifty years, unlike Ghana, Nigeria, Gambia, Guinea Conakry and others. France’s withdrawal from the central banks could also give rise to fears of a less-than-credible alternative to the CFA franc.
On the question of the adoption of a common currency, the treaty establishing the African Economic Community specifies that the states undertake to create an African monetary union through the harmonization of currency zones. However, the treaty does not specify how this harmonization of monetary zones would be achieved.
However, with his optimal currency zone theory, we recognised to Mundell (1961) , as the one who is credited with laying the theoretical foundations for a monetary union. The author describes the conditions under which a geographical area benefits from adopting a common currency. This theory was enriched5 by McKinnon (1963) , who proposed a criterion of trade openness, and Kenen (1969) , who emphasized that diversified economies can do without the exchange rate instrument and form an Optimum Currency Area (OCA).
Our aim is to ascertain whether it is possible for the African countries of CAEMC to create a solidly established monetary zone through the creation of a common African currency. The underlying question is: can the African countries of Central Africa Economic and Monetary Community (CAEMC) establish a stable monetary zone through the use of a common African currency?
The creation of a common African currency, a stable monetary zone, will be measured by the capacity to mobilize significant foreign exchange reserves, a guarantee of resilience to speculative attacks.
In the context of strengthening economic integration, the common African currency, because of its acceptance by politicians and civil society, constitutes a fundamental motive for this study, as it seems to “give the impression of magically transforming goods” in Harold’s (2018: p. 18) phrase. Based on the evolution of total reserves, this study attempts to shed light on the alternative to the CFA franc with the creation of a common African currency.
Thus, this study is organized around the following points: 1) a brief theoretical and empirical review of monetary union projects, 2) stylized facts relating to the monetary union project, 3) the credibility of the exchange rate regime, and 4) attempts to model exchange rate risk factors.
2. A Brief Theoretical and Empirical Review of Monetary Union Projects
2.1. Theoretical Review of Monetary Union Projects
The successful launch of the euro has sparked renewed interest in currency unions in other regions. However, it is sometimes forgotten that the process has been a very long one in Europe ( Masson & Pattillo, 2004: p. 10 ). Although Europe does not meet all the criteria for an Optimum Currency Area (OCA)6, production is more diversified than in the USA ( Brociner, 1993: p. 360 ).
On the question of the OCA, Wallace (2006: p. 6) believes that “Mundell posed a new and fundamental question, namely: under what circumstances is it advantageous for several countries to give up the independence of their monetary policy, or even their monetary sovereignty, in favor of a monetary union or an international system of fixed exchange rates?”. To this question, Le Héron (2015: p. 8) points out that monetary union can only be declared once the economic convergence of the various states has been achieved.
However, the central idea behind the concept of “economic convergence”, i.e. the convergence of per capita production levels in the world’s different economies, is that economic “development” would be an almost “natural” phase of the economy ( Sarant, 2017: p. 101 ).
Long-term convergence requires both structural transformation and solid fundamentals. The picture is much bleaker for Africa when it comes to achieving structural transformation ( AfDB, 2016: p. 153 ).
For Sarant (2017: p. 102) , we should rather speak of “convergences” in the plural, as there is no unified definition for the concept. Indeed, we observe that the major transformations that drive new waves of growth are those that involve taking other logics into account to understand the initial impetus for the structural transformations at the root of growth (the dynamism of emerging countries, for example).
However, it is accepted that structural transformation implies both diversification of the productive structure and its modernization. According to Brociner (1993: p. 352) , “ Kenen’s (1969) suggestion that diversification of production could be a criterion for defining an MZ is relevant to Eichengreen’s conclusion”.
This diversification, as Berg et al. (2003: p. 25) have pointed out in the case of Latin American countries, is a sensible solution for a monetary union, since the relevance of the choice of an economic and monetary union depends on the structure of trade, the similarity of business cycles in the different countries, financial factors and political and institutional considerations. In the context of a monetary union project, authors agree on the importance of price stability for the central bank ( Brociner, 1993 ; Ftiti & Goux, 2011 ). Although the effectiveness and economic performance of the7 inflation-targeting policy are not accepted by all authors, its practice on the other hand was marked by great stability observed in the early 1990s and 2000s ( Ftiti & Goux, 2011: p. 1 ).
This inflation targeting is a policy still used by central banks with the war in Ukraine. For Brunnermeier (2023: p. 6) , the resurgence of inflation we are witnessing calls for a new paradigm shift in monetary policy to make it more robust to sudden unexpected reversals in the macroeconomic scenario.
Azam (1996: p. 63) points out that the fixed parity between the French franc and the CFA franc represents a credible commitment to preventing inflation. However, this policy goes hand in hand with central bank independence ( Brunnermeier, 2023 ; Masson & Pattillo, 2004 ; Croce & Khan, 2000 ; Brociner, 1993 ). Indeed, central banks’ ability to set monetary policy and control the economy during tighter times depends on its independence ( Brunnermeier, 2023: p. 6 ).
Analyses of advanced countries assume that institutional issues appear to be resolved. However, Berg et al. (2003: p. 25) believe that the establishment of common institutions to facilitate adjustment to the ensuing economic and political pressures may take time. For the countries in the CFA zone, however, the quality of governance ( Avom, 2019: p. 85 ) and mediocre governance ( Masson & Pattillo, 2004: p. 11 ) may mean that there are no institutions capable of protecting the central bank from political pressures.
Drawing inspiration from Latin American countries, Berg et al. (2003: p. 25) point out that, given the substantial disparities in development, the establishment of a common currency would be long and complex. In this respect, the countries of the CFA zone, whose situation is less favourable, would not be able to invest in a comparable way in the establishment of common institutions that could facilitate adjustment to economic and political pressures.
The success of the euro is also attributed to the economies of scale achieved by member countries, which have enabled a reduction in transaction costs ( Masson & Pattillo, 2004: p. 10 ). The strong specialization of African countries in primary products means that their terms of trade are subject to considerable shocks, which do not have the same impact on these countries. Some countries find themselves with unsustainable budget deficits.
Although central bank statutes prohibit the financing of public expenditure, fiscal policy can indirectly exert pressure on monetary policy. Fiscal policy, through public debt, was behind the devaluation of the CFA franc in January 1994, after a long period of stability between the French franc and the CFA franc, fixed since October 1948 at one CFA franc for two centimes, or 50 CFA francs for one French franc8.
A country would not want to belong to a monetary union that was experiencing exchange rate crises. Since the most recent financial crises in Asia and Latin America, these countries have been increasingly forced to choose between a more flexible regime or the other extreme, i.e. a currency board system or full dollarization ( Croce & Khan, 2000: p. 49 ).
To establish the monetary credibility of their economies, several emerging and South American countries have opted for dollarization9, i.e. substituting the dollar for the national currency ( Le Maux, 2003 ; Bourguinat & Dohni, 2002 ; Ares, 2001 ; Berg & Borensztein, 2000 ). Ecuador and El Salvador have adopted the US dollar as their official currency ( Berg et al., 2003: p. 24 ). According to Minda (2005: p. 15) , Ecuador opted for official dollarization in 2000 and El Salvador in 2001, while Panama had adopted it as early as 1904. In some countries, the national currency competes with the dollar, as in Guatemala, which uses the quetzal (GTQ, national currency), and Guatemala, which uses the balboa (national currency). In Asia, Cambodia uses the riel (national currency) and the US dollar. In Argentina, dollarization will be a factor in the October 2023 presidential elections.
According to Le Maux (2003: p. 367) , “official dollarization or euroisation was advocated because of the persistence of speculative attacks under the currency board system. Dollarization does away with the single reserve, but it remains dangerous”. Ares (2001: p. 753) argues that “official dollarization occurs only after a state has undergone major political and economic crises: the most difficult situations favor unilateral dollarization”.
According to the first generation of models pioneered by Krugman (1979) 10, “currency crises are caused by insufficient foreign exchange reserves due to persistent balance-of-payments deficits and poor fundamentals”. A currency crisis, for D’Ornano et al. (2006: p. 92) , is a situation in which an attack on the currency leads to its depreciation. In this respect, the credibility of a monetary union depends on its resilience to a systemic currency crisis. For Bunda (2005: p. 906 ), the international liquidity ratio is a key indicator of the financial fragility of emerging countries.
It is recognized that a country’s ability to create, produce goods, distribute and/or produce services in international trade, while at the same time enjoying growing income and resource gains11, makes it possible to diversify export earnings beyond those generated by traditional commodities, and thus increase foreign exchange reserves.
In this way, revenue diversification helps to replenish the central bank’s foreign exchange reserve account. In return, these foreign exchange reserves are not only an essential counterpart to money creation, but also support the value of the common African currency against speculative attacks.
Several authors ( Brociner, 1993 ; Masson & Pattillo, 2004 ; Schalck, 2007 ; Nubukpo, 2012 ; Brunnermeier, 2023 ) advocate coordination of fiscal and monetary policies as the key to a successful monetary union. For Brociner (1993: p. 358) , the interdependence of monetary and fiscal policies enables the central bank to control inflation.
Low interest rates and reasonable levels of government debt have allowed central banks to ignore the relationship between monetary policy and fiscal policy. Since the outbreak of the COVID-19 pandemic, it has become clear that fiscal policy can be a powerful driver of inflation. This pandemic has shown that monetary policy alone cannot always control inflation. To this end, Brunnermeier (2023: p. 6) proposes the interaction between monetary policy and fiscal policy.
In the CFA franc zone, it took the severe crisis of the late 80s and early 90s to trigger a major coordination effort, culminating in the creation of new supranational institutions ( Masson & Pattillo, 2004: p. 11 ). The single adjustment of January 1994 provided an opportunity to question the lack of policy coordination in the zone in general, and budgetary policies in particular ( Fouda Owoundi, 2009: p. 320 ).
Central banks holding risky assets and paying interest on reserves can suffer considerable losses if interest rates rise. The resulting increase in public debt has increased the likelihood of the emergence of fiscal dominance ( Brunnermeier, 2023: p. 7 ).
For African countries, the IMF is a financing option as a source of emergency reserves. A monetary union requires the pooling of resources to provide liquidity support to member countries. To this end, the decision-makers of these countries must be able to overcome adverse shocks and re-establish economic resilience. For, according to Duval and Vogel (2008: p. 239) , resilience is “roughly defined as the capacity to maintain production close to its potential after a shock. This in turn depends on the capacity of the institutional framework to cushion the initial impact of exogenous shocks and reduce the persistence of the subsequent gap between actual and potential output”.
In an uncertain international environment marked by sudden reversals in economic and financial situations, it seems complicated for African countries to implement monetary union projects, insofar as the banks of these countries have never been able to impose macroprudential supervision on member countries, which consists, according to Brunnermeier (2023: p. 8) , of ensuring the robustness of individual institutions as well as the soundness of the financial system as a whole.
As a result, African countries in the CFA zone, already highly vulnerable to external shocks, would have to make trade-offs between their monetary policies and the pooling of resources that provides liquidity support to member countries.
Mundell’s (1961) optimal currency area theory suggested the foundations of a monetary union. However, we note that without having fulfilled all the criteria, a group of countries has succeeded in forming a monetary zone (European Union). Similarly, countries that are less diversified (or not at all), with structural transformation (long-term convergence) and governance problems (CFA zone) have been able to create a monetary zone with a developed country (France) by placing large foreign exchange reserves in an account.
Consequently, without going into the inadequacies of the literature, this work aims to make a contribution by examining the capacity of a group of countries to create and maintain a monetary union over time in the face of internal and external upheavals, while preserving the stability of the union. This capacity is based on resilience to a systemic exchange rate crisis, i.e. the level of foreign exchange reserves. A monetary union can therefore be formed for countries with large foreign exchange reserves.
2.2. Empirical Review of Monetary Union Projects
Using a model based on work on optimal currency zones, Masson and Pattillo (2004: p. 13) demonstrate the economic benefits of monetary union projects. For these authors, “the problems posed by the common currency project within the Economic Community of West African States (ECOWAS) essentially relate to the lack of budgetary discipline in certain candidate countries, in particular Nigeria. And a project to create a fully-fledged monetary union encompassing all the countries of the Southern African Development Community (SADC) would be compromised by the reluctance of countries concerned with budgetary rigor (South Africa and Botswana, for example) to admit countries that are not”.
The literature on currency crises is abundant. The prevalence of twin crises has led to a reorientation of analyses, making it difficult to validate models empirically. While they can identify a set of variables whose deterioration is likely to undermine market confidence, they do not offer clear-cut conclusions ( Cartapanis, 2004: pp. 6-7 ).
In the case where the notion of currency crisis becomes more complex, D’Ornano et al. (2006: p. 95) , in an econometric study, sought to show the determinants of currency crises. They began by constructing a turbulence zone index, a pressure indicator for identifying crisis situations. Among the variables selected, it emerged that the ratio of money supply to international reserves had increased, reflecting the country’s vulnerability. For the authors, this ratio of money supply to international reserves and the real exchange rate against the dollar are significant in assessing the associated exchange rate risks.
Bunda (2005: p. 931) used a model that fits into the literature on twin crises. This model found that, alongside the weakness of the banking sectors in Asia (the main cause), there was the inappropriate structure of private debt. The ratio of foreign exchange reserves to short-term debt can be seen as a leading indicator of the financial crisis.
Schalck (2007: p. 13) studies the coordination of fiscal policies in a monetary union, and considers that governments internalize the behavior of the central bank. To this end, a model using a Stackelberg-style game shows that coordination is a good way of stabilizing the eurozone. However, even if coordination gains remain, they are conditioned by differences in the national values of certain variables (size, deficit and interest rate sensitivities).
3. Stylized Facts about Monetary Union Projects
The economic literature on the implementation of a monetary union project offers a number of lessons. These include: 1) structural transformation, which positively modifies the structure of the economy, enabling both diversification of the productive structure and its modernization. Indeed, the choice of an economic and monetary union depends on the structure of trade, 2) economies of scale, which implies a reduction in production costs, 3) the budgetary rigor required to contain the ratio of foreign exchange reserves to short-term debt in the best possible proportions, since the credibility of a monetary union depends on its resilience to a systemic exchange rate crisis, 4) the improvement in the ratio of money supply to international reserves and the real exchange rate, which are significant in assessing the associated exchange rate risks.
3.1. What Can We Learn from the Structural Transformation?
Structural transformation is seen as a dynamic reallocation of resources from non-productive to productive sectors ( Touna & Ongono, 2019 ; Lectard, 2017 ; UNCTAD, 2016 ; IMF, 2014 ; UNIDO, 2013 ).
The point here is not to discuss the best policies for bringing out the sectors most likely to bring about the productive transformation of the economy as a whole, but rather to quantify structural transformation.
Among indicators widely documented in the literature to capture structural transformation include employment (agricultural and industrial sectors) and/or value added in the manufacturing sector. However, authors12 have pointed out that in Latin America and Sub-Saharan Africa, the workforce has migrated in the “wrong” direction, i.e. towards less productive activities, particularly informal ones. In the CAEMC countries, for example, with the successive crises that prompted the implementation of structural adjustment programs, many workers made redundant from privatized or bankrupt companies, or whose wages are unpaid, have turned either to farming or to crafts (carpenters, welders and others).
3.1.1. Export Diversification and Sophistication
Lectard (2017: p. 21) points out that export diversification and sophistication have emerged as the two indicators for measuring and quantifying industrial transformation.
1) Export diversification
Export diversification can take place either at product level or at trading partner level ( IMF, 2014: p. 9 ). While the IMF measures export diversification through the Theil index, here it is the proportion of manufactured goods exports to exported goods that is used. Indeed, the relevance of the choice of an economic and monetary union depends on the structure of trade ( Berg et al., 2003: p. 25 ).
Table 1 shows that the Central African Republic (CAR) is the only country over the period with a percentage above 50, averaging 58.9%. It is followed by Togo with a percentage above 38, i.e. an average of 50.9%.
These data do not allow us to conclude on the relevance of the choice of an economic and monetary union, which depends on the structure of trade. A
![]()
Table 1. Exports of manufactured goods (% of goods exported).
Source: World data bank_9/19/2023.
Source: UNCTAD-STAT.
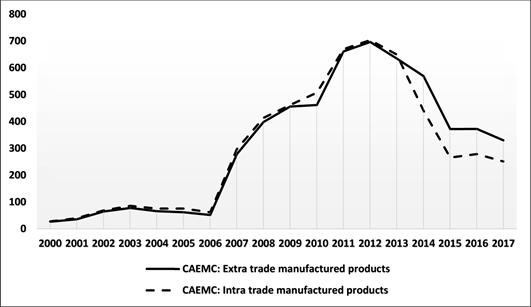
Graph 1. Extra and intra trade in manufactured goods in the CAEMC (in millions of dollars).
Source: UNCTAD-STAT.
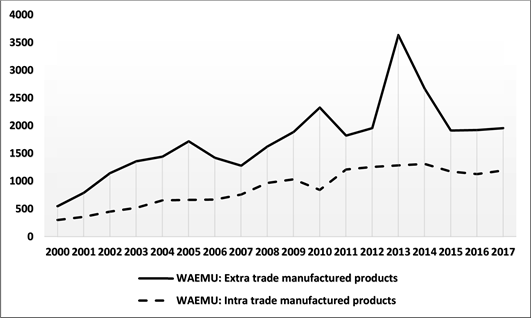
Graph 2. Extra and intra trade in manufactured goods in the WAEMU (in millions of dollars).
glance at Graph 1 and Graph 2 of extra- and intra-community exports of manufactured goods from WAEMU countries shows that the curves follow an upward trend, with a peak in 2013 for extra trade. Similarly, the value of these trade flows is greater than that of the CAEMC.
Extra- and intra-CAEMC export levels are almost identical. Exports began to rise in 2007, peaking in 2012, and since then trade flows have been on a downward trend.
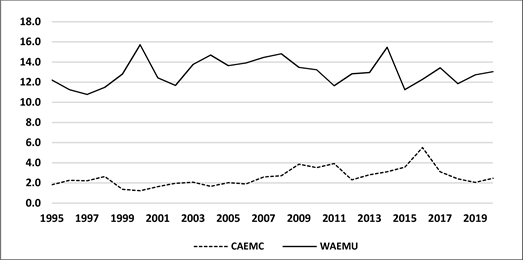
When we look at the total trade of each community from 1995 to 2020, we see that the WAEMU countries have a higher proportion than the CAEMC countries (Graph 3).
The evolution of extra- and intra-community exports of manufactured goods and intra-group trade in goods as a percentage of total trade corroborates the difficulties of Central African countries and the “progress” of trade integration in West Africa highlighted by Guillaumont and Sylviane (2017: p. 1) .
2) Export sophistication
Lectard (2017: pp. 9-10) relies on the characteristics of exporting countries and products to measure sophistication. In an increasingly competitive world, intensive specialization is a necessity (Graph 4).
According to Chiappini (2011: p. 42) , intensive specialization means measuring structural competitiveness: the more a country invests in R&D, the more dynamic
Source: UNCTAD-STAT.
Graph 3. Intra-group trade in goods as a percentage of total WAEMU and CAEMC trade.
Source: UNCTAD-STAT
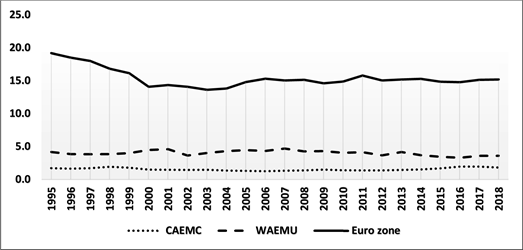
Graph 4. Evolution of the export concentration index by product.
its exports. This comes down to measuring the export concentration index. Indeed, the export concentration index13 shows how the exports of an economy or group of economies are concentrated on a few products, or spread more evenly over a range of products.
It is clear that euro zone countries invest more in R&D than CAEMC and WAEMU countries. Graph 3 shows that the WAEMU concentration index is higher than that of the CAEMC. As a result, WAEMU exports are concentrated on a few products, or more evenly spread over a range of products, than CAEMC exports.
3.1.2. Analysis of Production Costs: The Behavior of Real Effective Exchange Rates in WAEMU and CAEMC Countries
Structural transformation also means achieving economies of scale, and thus reducing production costs. These production costs can be captured through the Real Effective Exchange Rate (REER). The purpose of calculating the Real Effective Exchange Rate (REER) is “to compare changes in the production costs of internationally traded goods at home and abroad. But the significance of this rate as an indicator of competitiveness depends on the price indices used, the choice of foreign countries with which the country in question is compared, and the base year used as a reference” ( Guillaumont & Jeanneney, 1988: p. 77 ).
The REER is the average of the bilateral Real Effective Exchange Rates (REERs)
![]()
Table 2. Weighted average REER index for the five main manufactured products.
Source: OCD statistics.
between the country and each of its trading partners, weighted by the respective market shares of each partner. An increase in a country’s real effective exchange rate index illustrates the appreciation of that country’s currency, while the opposite signifies a depreciation.
The multiplicity of possible calculation methods leads us to take into account data from OCD statistics, which makes this exercise easy with its statistics, over a fairly long and recent period (1995-2016), which provide real effective exchange rate indices for all African countries, (weighted on the basis of exports) in base 100 for the year 2005 (Table 2).
Benin, with a weighted average REER index for the five main exported manufactured products of 100.7 in 2006 compared with its average level in 2005, means that production costs for these products rose by 0.7%. From 2007 to 2014, these costs rose by 0.4%, 4.7%, 7.1%, 1.0%, 1.7%, 1.1%, 3.8% and 4.6%, respectively. In Congo, on the other hand, costs rose by 3.9%, 7.3%, 13.7%, 17.1%, 13.3%, 12.1%, 8.7%, 11.7%, 16.8%, 13.1% and 17.8%.
While WAEMU countries have made efforts to reduce the production costs of exported manufactured goods between 2012 and 2016, the situation is different for CAEMC countries, with the exception of Gabon. This situation may explain the wide disparity in trade performance between CAEMC and WAEMU countries.
3.2. Credibility of the Exchange Rate Regime: Fiscal Variables and Foreign Exchange Reserves
3.2.1. Budget Variables
Fiscal variables played a key role in the January 1994 parity shift. For the proponents of this change in parity (IMF and World Bank), fiscal policy, through public debt, was at the root of this currency crisis. Indeed, despite the implementation of adjustment programs in the WAEMU and CAEMC countries, the burden of public debt was becoming unbearable (Table 3), leading to the devaluation of the CFA franc.
The structure of Sub-Saharan African economies in general, and of WAEMU and CAEMC countries in particular, is such that budget and current account balances are often negative (Table 4).
In this situation of permanent imbalance, it is therefore necessary for WAEMU and CAEMC countries to build up foreign exchange reserves, which play a
![]()
Table 3. Debt of WAEMU and CAEMC countries from 1992 to 1994.
Source: Banque de France, Franc Zone Report 1995. Notes: DT = Total Debt; GNP = Gross National Product; EBS = Exports of Goods and Services.
![]()
Table 4. Current account balance and budget balance excluding grants as % of GDP.
Source: Banque de France, Franc Zone Annual Report 2018.
stabilizing role for exchange rates in a fixed exchange rate system. A large stock of reserves can guarantee the payment of imports, for example. Indeed, it is accepted that the currency of an economy with a trade deficit should depreciate, and that of an economy with a trade surplus should appreciate, thereby restoring equilibrium.
3.2.2. Foreign Exchange Reserves
The only international monetary problem worth posing is that of the balance of power between nations14. The history of the International Monetary System (IMS) shows us that there is no economic solution that would enable a system to impose itself on its own merits. Monetary relations follow the rhythm of conflicts and the succession of dominations15.
Today, exchange rate practices are diverse and varied, and most currencies (dollar, pound sterling, euro, and yen) float. Some countries have renounced their monetary autonomy; others have pegged their currencies to another currency or to a basket of currencies, leaving it to float more or without limits; and others have let their currencies float within certain limits without giving them an anchor (see Lelart, 2000 )16.
The countries of CAEMC and WAEMU have chosen to form a monetary zone, with the CFA franc as their currency, and a fixed parity with the euro, guaranteed by France. The principles17 of this zone, well established and accepted by the countries under the terms of an agreement ratified by all, bear a striking resemblance to those characterizing the European Monetary System (EMS).
These countries believe that such a practice has stabilizing qualities, bringing confidence in the use of the currency and economic prosperity to member countries. However, the credibility of a monetary union depends on its resilience to a systemic currency crisis. A currency crisis occurs when a country is forced to abandon an exchange rate it had previously committed to defending.
The foreign exchange market in the 1980s was marked by crises, linked to the “twin” deficits (public deficit and trade deficit) of the United States. It was international cooperation that prevented speculation from turning into a brutal financial crisis.
In this context, it is accepted that reserves should cover three months of imports18. To this end, the ratio of foreign exchange reserves to months of imports is used to measure reserve adequacy.
Table 5 shows how the ratio of foreign exchange reserves to months of imports has performed in WAEMU and CAEMC countries over the period 2002-2016. It can be seen that the ratio of foreign exchange reserves to months of imports has, on average, exceeded the acceptable threshold. While all countries were on average able to exceed the required threshold of three months of imports, we note that Chad posted a ratio of 1.9 on average. Taken as a whole, each sub-region averaged a ratio of foreign exchange reserves to months of imports of 4.1.
![]()
Table 5. Foreign exchange reserves in months of imports.
Source: IMF, Africa Department and World Economic Outlook.
4. Modeling Test
In a context where currency crises are becoming increasingly complex, we won’t be looking here for the determinants of currency crises ( D’Ornano et al., 2006 ), nor for the leading indicators of financial crisis ( Bunda, 2005: p. 931 ) in CAEMC countries, but rather for the indicators that affect foreign exchange reserves.
So, here we will model the evolution of foreign exchange reserves in the CAEMC oil-producing countries, which are still experiencing difficulties ( Guillaumont & Sylviane, 2017: p. 1 ), based on the work of Gosselin and Parent (2012) . Indeed, these authors modeled the level of foreign exchange reserves as a function of GDP, the ratio of imports to GDP, the ratio of broad money to GDP, and the volatility of export earnings. These countries were chosen for two reasons. Firstly, these countries have been able to accumulate foreign currency assets as a result of favorable oil prices. Secondly, these countries are hesitant or have not yet found a credible alternative to the CFA franc.
CAEMC countries are admittedly characterized by poor institutional governance. According to Transparency International’s Corruption Perceptions Index 2020, several African countries are still in the red, including CAEMC countries. Equatorial Guinea is the most corrupt country in CAEMC, ranking 173e, followed by Congo (165e), Chad (162e), CAR (153e) and Cameroon (153e) out of 180 countries.
In this way, we capture the volatility of export earnings by assuming that they represent only 25% of exports of goods and services, since it is estimated that a large proportion of export earnings are diverted to private interests.
Using data from the World Bank (World data bank), we model total foreign exchange reserves (TR) as a function of Gross Domestic Product (GDP), money supply as a percentage of GDP (MMPIB), imports of goods and services as a percentage of GDP (IMPBSPIB) and 25% of exports of goods and services (EXPBS). However, the number of observations varies according to data availability. For Cameroon we have 42 observations, Congo 39, Gabon 38 and Chad 18. We retain here the CAEMC oil-producing countries with more than 30 observations, using a period from 1978 to 2015 for the three oil-producing countries.
We observe that there is a 55% chance of making a wrong decision if we reject the hypothesis of normality of the variables: LOG(GDP) (69.31%) for Cameroon, LOG(TR) (55.60%) for Gabon (Table 6).
The probability associated with the LOG(TR) variable for Cameroon, for example, is 0.185370 (Table 6). In other words, if we reject the normality hypothesis for the LOG(TR) variable, there is an 18.53% chance of making a wrong decision. The same applies to the variables: TR, LOG(PIB), PIB, LOG(MMPIB), MMPIB, LOG(EXPBS), EXPBS, LOG(IMPBSPIB) and IMPBSPIB, where there are respectively 2.56%, 69.31%, 6.17%, 15.46%, 21.59%, 26.88% and 4.50% chances of making a wrong decision (Table 7).
For Congo, the probabilities associated with the variables Log(TR), TR, Log(PIB), PIB, Log(MMPIB), MMPIB, Log(EXPBS) and EXPBS are 0.148436; 0.000481; 0.144347; 0.0003490; 0.408377; 0.029021; 0.323331 and 0.008466, respectively. Thus, if we reject the hypothesis of normality of the variables, there are respectively less than 14.8%, 0.05%, 14.4%, 0.03%, 40.8%, 2.9%, 32.3% and 0.08% chance of making a wrong decision (Table 8).
However, very few time series meet the conditions for stationarity, i.e. they have no trend or seasonality. Since stationarity cannot be assumed, we have to test for it.
Source: Author, using Eviews 10.
Source: Author, using Eviews 10.
Source: Author, using Eviews 10.
4.1. Test Results
To check the stationarity of the series, we use unit root tests. Taking Cameroon as an example, the Prob value of all variables is greater than 5% (or Augmented Dickey-Fuller test statistic (ADF) = −1.534022 is greater than Critical values (CV) = −3.526609), so we accept the null hypothesis of the unit root. Thus, the Log(TR), Log(IMPBSPIB), Log(PIB), Log(MMPIB) and Log(EXPBS) series are non-stationary (Table 9).
Table 10 shows that Prob’s value for all variables is below 5%. D(Log(TR)), D(Log(IMPBSPIB)), D(Log(PIB)), D(Log(MMPIB)) and D(Log(EXPBS)) are stationary. The Log(TR), Log(IMPBSPIB), Log(PIB), Log(MMPIB) and Log(EXPBS) series are therefore integrated of Order 1 (Table 10).
Insofar as all variables are integrated of Order 1, there is a possibility of cointegration. We therefore apply Johansen’s cointegration test (Table 11).
The information in Table 12 reveals the existence of a single cointegrating relationship for Gabon, while there are no cointegrating relationships for Cameroon and Congo. For this purpose, we need to estimate the Error Correction Model (ECM).
4.2. Estimation Results
The results obtained above require us to estimate the following Hendry error-correction model:
![]()
Table 9. Results of Dickey-Fuller tests on Cameroon level variables.
Source: Author, using Eviews 10.
![]()
Table 10. Results of Dickey-Fuller test on first difference variables.
Source: Author, using Eviews 10.
Estimation of the Hendry error-correction model using ordinary least squares gives the following results (Table 12).
4.3. Robustness Checks for Credible Results
Robustness is measured using the error correction coefficient. It must be negative, otherwise the error correction model specification should be rejected. If this is not the case, the error correction mechanism (catching up which allows us to move towards the long term) would then work in the opposite direction and move away from the long term target.
When the error correction coefficient associated with the recall force
Table 11. Johansen cointegration test results.
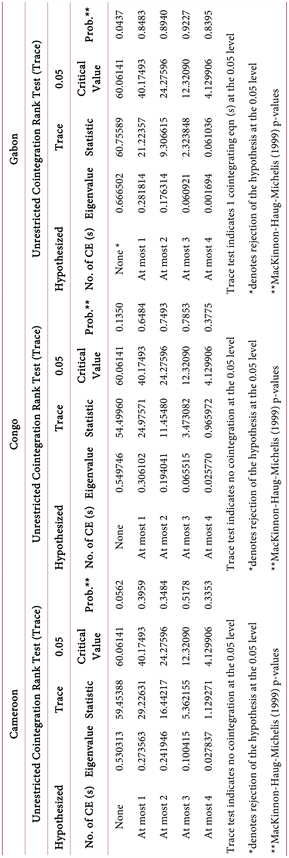
Source: Author, using Eviews 10.
Table 12. Estimation results for Cameroon, Congo and Gabon.
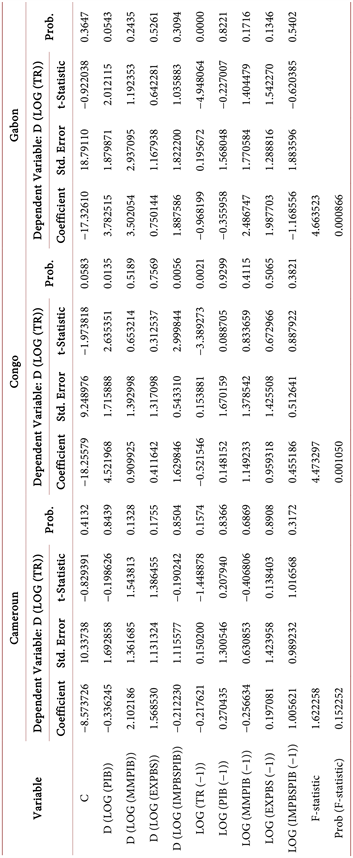
Source: Author, using Eviews 10.
(Log(TR(−1)) is negative, it must be significantly different from zero at the statistical threshold of 5% (or its Student’s t is greater than 1.96 in absolute value). So there is indeed an error correction mechanism.
The force of return to equilibrium (−0.217621; −0.521546; −0.968199), i.e. the error correction coefficient, is negative, which means that the Error Correction Model (ECM) specification is accepted.
However, only the coefficients associated with the recall force for Congo (−0.521546) and Gabon (−0.968199) are significantly different from zero at the 5% threshold (their t-Statistics are greater than 1.96 in absolute value). There is therefore an error-correction mechanism. In the long term, the explained and explanatory variables offset each other, so that the series show similar trends.
4.4. Interpretation of Results
Interpretation of the error correction coefficients in Table 12 reveals:
1) For the Congo,
That the restoring force towards equilibrium
is significantly different from zero at the 5% threshold. An error-correction mechanism therefore exists. In the long term, the imbalances between total reserves and gross domestic product, money supply as a percentage of GDP, exports of goods and services and imports of goods and services as a percentage of GDP offset each other, so that the different series show similar trends. In this way, we are able to adjust 52.2% of the imbalance between the desired and actual levels of total reserves. 52.2% of the effects of a shock in a given year are absorbed after a given time (number of years) following any shock. In other words, a shock occurring in one year is fully absorbed after
.
Short-term elasticities are:
,
,
,
.
This means that if GDP, money supply as a percentage of GDP, exports of goods and services and imports of goods and services as a percentage of GDP increase by 10%, total short-term reserves increase by 45.2%, 9.1%, 4.1% and 16.3%, respectively.
The long-term elasticities are:
,
,
and
.
Thus, if GDP, money supply as a percentage of GDP, exports of goods and services and imports of goods and services as a percentage of GDP increase by 10%, total long-term reserves rise by 2.8%, 22.0%, 18.4% and 8.7%, respectively.
It can be seen that, in the short term, the increase in GDP, in the same proportions, has a positive impact on total reserves. However, this impact is less significant in the long term, at 42.4 points less. While in the short term, exports of goods and services have a positive impact on total reserves, in the long term this impact is greater, at 14.3 points. Money supply as a percentage of GDP, which measures both the financialization and liquidity of an economy, also enables us to study the size and depth of a financial system. Thus, when the size and depth of Congo’s financial system improve, they have a positive impact on total reserves. In the long term, this impact is greater (12.9 points higher).
2) For Gabon,
That the coefficient
is also significantly different from zero at the 5% threshold. This means that an error-correction mechanism exists. The imbalances between total reserves and gross domestic product, money supply as a percentage of GDP, exports of goods and services and imports of goods and services as a percentage of GDP offset each other, so that the different series show similar trends. We are therefore able to adjust 96.8% of the imbalance between the desired and actual levels of total reserves. This means that 96.8% of the effects of a shock in a given year are absorbed after a certain time (number of years) following any shock. In other words, a shock in one year is fully absorbed after
.
In the short term, the elasticities are
,
,
,
. Thus, if GDP, money supply as a percentage of GDP, exports of goods and services and imports of goods and services as a percentage of GDP increase by 10%, total short-term reserves increase by 37.8%, 35.0%, 7.5% and 18.9%, respectively.
Long-term elasticities are:
,
,
and
.
These elasticities indicate that if GDP, money supply as a percentage of GDP, exports of goods and services and imports of goods and services as a percentage of GDP increase by 10%, total long-term reserves fall by 3.7%, rise by 25.7%, rise by 20.5% and fall by 12.1%.
These results indicate that, in the short term, the increase in GDP has a positive impact on total foreign exchange reserves, but in the long term this increase affects total foreign exchange reserves by 41.5 points less than in the short term. While the improvement in the size and depth of Gabon’s financial system has a positive short-term impact on total foreign exchange reserves, in the long term this impact weakens by 10.0 points. We also note that in the long term, as imports of goods and services as a percentage of GDP increase, total reserves fall considerably (by 30.0 points).
5. Conclusion
The common African currency is the result of a collective decision, so countries that decide to adopt this currency must collectively and individually improve their trade performance on the one hand, and promote good institutional governance (particularly monetary) on the other hand.
We pointed out earlier that the adoption of a common African currency may expose African countries to first-generation currency crises, where foreign exchange reserves and “fundamentals” play a central role. Our model shows that GDP growth has a positive short-term impact on total reserves. However, in the long term, this increase is smaller (in the case of Congo) and affects total reserves (in the case of Gabon).
Exports of goods and services also have a positive impact on total reserves in the short and long term for Congo and Gabon. These countries must therefore focus their structural transformation on activities whose supply structures adapt to global demand trends, since they enable them to accumulate export revenues. This means discussing the best policies to promote the emergence of the sectors most likely to bring about a productive transformation of the economy as a whole, as highlighted by the various authors, and thus generate substantial export revenues.
The alternative to the CFA franc in CAEMC countries is possible, but only if there is an improvement in structural transformation policies and good institutional governance. Our approach suggests two orientations. In the short term, budgetary discipline and macroeconomic policy should be scrutinized, as they are one of the sources of credibility for a monetary union, necessary to avoid increasing ratios of money supply to international reserves ( D’Ornano et al., 2006 ) and foreign exchange reserves to short-term debt ( Bunda, 2005 ). In the long term, genuine structural transformation is required, enabling the emergence of sectors whose supply structures adapt to global demand trends. Indeed, it leads to export diversification and sophistication ( Lectard, 2017 ), and diversification of production could be a criterion for defining an MZ ( Brociner, 1993 ).
The volatility of export earnings is captured by taking into account the poor quality of institutional governance by considering only 25% of exports of goods and services, as a large proportion of export earnings are diverted to private interests. As exports of goods and services have a positive impact on total reserves in the short and long term for Congo and Gabon, a monetary union can be created for countries with low volatility of export earnings.
NOTES
1“What future for CFA francs?”, Working Paper 188 November 2017 version, FERDI.
2The treaty establishing the African Economic Community, which came into force in 1994, stipulates that this economic community should be established over a period of 34 to 40 years maximum.
3See Dembélé et al. (2015) and Nubukpo (2012) , op cit. Touna and Ongono (2019) emphasize that for these authors, African countries must simply get rid of the CFA franc and create a currency specific to Africans capable of supporting and sustaining their industrialization efforts.
4This monetary agreement, initiated at the request of the member countries: Mali, Senegal, Togo, Côte-d’Ivoire, Benin, Burkina Faso and Guinea.
5Bissau replaces that of December 4, 1973. The work of Brociner (1993) , op. cit. is highly instructive on these issues.
6According to Mundell, the answer lies in factor mobility. Europe’s monetary union is a great success ( Wallace, 2006: p. 6 ).
7This is the monetary policy framework that obliges the central bank to ensure low inflation ( Croce & Khan, 2000 ), op cit, page 48.
8See Békolo-Ebéop (2001) op cit.
9It’s the U.S. dollar. With full dollarization, we move from the limited, unofficial use of a foreign currency to its official use for all transactions. In the broadest sense, dollarization is, according to Minda (2005: p. 15) , a generic term that characterizes countries whose financial transactions are carried out in a foreign currency, but not necessarily in US dollars.
10See Plihon (2012) , op cité, page 68.
11See Scott and Lodge (1985) , “US Competitiveness in the World Economy”, page 3.
12These include, in particular, McMillan and Rodrik (2011) cited by Lectard (2017) , page 7.
13This is the definition given by UNCTAD in UNCTADstat.
14See Delas (2008) , op cit.
15The gold standard, a monetary system based on the pound sterling, the currency of England’s leading economic power, saw its hegemony supplanted by that of the United States, which imposed the gold exchange standard, a monetary system based on the dollar, the American currency.
16For more information, see box on page 75.
17See Lelart (2000) , op cit.
18For this ratio, Triffin (1960) , “Gold and the Dollar Crisis” Yale University Press is the most widely cited.