Children and Workers Well-Being in Belgian French-Speaking Primary Schools during the COVID-19 Pandemic ()

1. Introduction
During the COVID-19 pandemic, a significant number of measures were taken worldwide to limit the transmission of the severe acute respiratory syndrome coronavirus 2 (SARS-CoV-2), and in many ways, changed human life. Interruption of social activities, social distancing, lockdown, curfew, and mask policies were measures taken to limit the virus transmission. Unfortunately, all these measures had harmful consequences, such as isolation, misinformation, fear, and violence, which impacted the well-being of many people. Children were one of the most vulnerable groups to these measures.
Preliminary results in China assessed that the anxiety and depression levels in children and adolescents were higher during the COVID-19 pandemic [1] .
School closures, lockdowns, and interruptions of social activities had an important impact on children’s development. School closures in the past had shown that students who had been absent for a long period of time were more likely not to return when schools reopened [2] . Several studies indicated that the physical, mental, and social well-being of children are affected by reactional activities and school closures [3] [4] [5] . In particular, the pandemic has reinforced social inequalities among disadvantaged backgrounds [6] . The pandemic has also led to economic instability, and children’s well-being also appeared to deteriorate as the economy declined [7] .
Interruption of social contact resulting from preventive measures had catastrophic consequences for adults’ and children’s well-being, including violence [6] . A study conducted in the USA investigated the various effects of historical pandemics on children and showed that almost a third had symptoms of post-traumatic disorder [8] .
In a systematic review addressing the impact of social isolation on mental health in children, authors found a direct association between social isolation and mental health, leading to future mental health problems even up to 9 years later [9] .
Another study showed that restrictions on activities and on access to school had a huge negative impact on the well-being of children with some disabilities during the COVID-19 pandemic; most respondents felt a deterioration in their well-being [10] .
We conducted the present study to assess the well-being of children in French-speaking primary schools in Belgium during the pandemic of COVID-19. In order to help professional policymakers to take actions that protect children’s development.
2. Methods
2.1. Study Design
We conducted the study DYNAtracs, DYNAmicTRAnsmission of Coronavirus in Schools, from January 14 to May 18, 2021, in 11 primary schools of the Federation Wallonia-Brussels in Belgium. Schools were selected using purposive sampling based on the extremes of three inclusion criteria.
The first criterion was the local incidence level of SARS-CoV-2 during the first wave on May 6, 2020 in Belgium, based on the Belgian Public Health Institute data, Sciensano [11] . The median of data was used as a threshold to define a low or a high local incidence. Schools with a local cumulative incidence strictly below 5.0 per 1000 persons were considered as a low incidence of SARS-CoV-2. Schools with a local cumulative incidence equal or greater than 5.0 per 1000 persons were considered as a high incidence level of SARS-CoV-2. The second criterion was the size of the school. According to the Federation Wallonia-Brussels definition, schools with less than 230 children were considered as small and above 230 as large. The third criterion was based on the school’s Socioeconomic Status (SES). This SES is a scale used to classify all schools in Belgium on a 20-points index [12] . According to this index, schools with a SES lower than 7 (the first tertile) were considered as low and those with a SES above 13 (the upper tertile) were considered as high. Schools were selected within each of the eight categories defined by containing two levels of three criteria. The study design and population are described in more detail in a previous publication related to DYNAtracs [13] [14] .
Schools were selected with the help of two administrations in charge of health at school, ONE (“Office de la Naissance et de l’Enfance”) and PSE (“Promotion de la Santé à l’École”). Investigators contacted the directors of selected schools to participate to the study.
Within each school, participants were tested by a rapid serological test by finger prick on the inclusion day. The results were analyzed according to the 3 inclusion criteria in a previous publication related to DYNAtracs [13] . A saliva antigen test of SARS-CoV-2 was performed at each visit and results are reported in another publication [14] .
Each participant received an inclusion questionnaire with demographic, and virus exposition questions. Additional specific questions were addressed to teachers and principal of the different schools, concerning the specific measures implemented in their school.
Additionally, each child received a booklet to record the virus exposure during the study period. At the end of the booklet, the child was invited to answer a 37-question well-being questionnaire based on the Revised Children’s Manifest Anxiety Scale (RCMAS), at any time of his/her choice.
Depending on the native language of the child, the booklet was translated into 5 languages: French, Italian, Arabic, Romanian and Turkish.
2.2. Study Population and Inclusion Criteria
All children and staff in selected primary schools were invited to participate. Participants were included if the consent was signed by both parents and the child or by the staff.
2.3. Exclusion Criteria
Refusal to provide written informed consent before enrolment.
2.4. Data Collection
Human data were performed in accordance with the Declaration of Helsinki. The protocol, informed consent forms, and questionnaires were approved by the Hospital-Faculty Ethics Committee Saint-Luc (“Commission d’Ethique Hospitalo-Facultaire des Cliniques Universitaires Saint-Luc”)—UCLouvain, approval number: 2020/16NOV/552.
The study investigators visited each school and interviewed each participant. The booklets were collected at the end of the study. All questionnaires and booklets were in paper format. Each response to the questionnaires was encoded in a double database and each data was encoded in an anonymized way. A verification of the double encoding was carried out. The database was then converted into an Excel file.
2.5. Well-Being Questionnaires
2.5.1. Revised Children’s Manifest Anxiety Scale
RCMAS is a scale based on 37 questions (Table 1) with “Yes” or “No” as answer. Regarding the quotation, a “Yes” response receives 1 point and a “No” response
Note: RCMAS: Revised Children’s Manifest Anxiety Scale; HAD: Hospital Anxiety and Depression; VAS: Visual Analogue Scale.
receives 0 point. A total anxiety score is then calculated using 28 items. From these 28 items, 3 subscales of anxiety can also be calculated, 1) physiological manifestations based on 10 items, 2) worry and hypersensitivity based on 11 items, 3) concentration and social anxiety based on 7 items. The first dimension, physiological manifestations, refers to difficulties in falling asleep, fatigue, and nausea. The second dimension, worry and hypersensitivity, relates to mental ruminations linked to the emotional injury and the isolation fear. The third dimension, concentration and social anxiety, refers to school problems. From the remaining 9 items, a fourth dimension allows to estimate the social desirability [15] [16] .
The anxiety dimension is calculated by analogy and by summing responses to the 28 corresponding items, with 0 as minimum and 28 as maximum. A score under 10 is defined as an absence or minimum anxiety symptoms, between 11 and 13 it is defined as an anxious state and 14 or more is defined as a definite anxious state.
Physiological manifestations were calculated by summing responses to the 10 corresponding items. It ranges from 0 to 10. A score under 3 is defined as an absence or minimum physiological manifestation, a score above 4 suggests physiological manifestations and a score equal or above 5 corresponds to a definite state of physiological manifestations.
Worry and hypersensitivity dimension was calculated by summing responses to the 11 corresponding items. It ranges from 0 to 11. A score under 4 is defined as an absence or minimum worry and hypersensitivity, a score equal to 5 suggests worry and hypersensitivity symptoms and a score of 6 or more corresponds to a definite state of worry and hypersensitivity.
Concentration and social anxiety dimension is the sum of responses to the 7 corresponding items, ranging from 0 to 7. A score under 2 is defined as an absence or minimum difficulties of concentration and social anxiety, a score of 3 suggests difficulties to concentrate and social anxiety, and a score of 4 or more corresponds to a definite state with difficulties to concentrate and social anxiety.
Social desirability score was calculated by summing responses to the 9 corresponding items. This score has 0 as minimum and 9 as maximum. A score under 3 is defined as an absence or low social desirability, a score above 4 is defined as a social desirability suspicion and a score equal or above 5 is defined as a definite state of social desirability.
2.5.2. Hospital Anxiety and Depression Scale
The adult inclusion questionnaire included 14 questions based on the Hospital Anxiety and Depression (HAD) scale (Table 1) in order to assess the staff well-being. HAD refers to the anxiety and depression symptoms using 7 questions for each dimension. Each question has a 4-points response with a value from 0 to 3. A total anxiety and a total depression score can be calculated with a maximum of 21 points each. A score under or equal 7 is defined as an absence of both anxiety and depression, a score between 8 and 10 is defined as a suspected anxious or depressive state, and a score equal or greater to 11 is defined as a definite state of anxiety or depression [17] .
Staff were also invited to report their perception of their current life and their future life in 5 years on a Visual Analogue Scale (VAS) (Table 1). This score has 0 as minimum and 10 as maximum. A value of 0 corresponds to the worst possible life and a value of 10 represents the best possible life.
2.6. Statistical Analysis
Results are represented as mean ± Standard Deviation (SD) for continuous variables and number with proportion for categorical variables. Student t-test and Analysis of Variance (ANOVA) with F-test were used to compare means between subgroups.
Association between continuous variables was assessed using Pearson r correlation coefficient.
Multiple logistic regressions were performed to assess the relationship between suspected or definite state in the well-being analysis and other explanatory variables.
All these RCMAS scores were analyzed considering sex, age, participation in organized fixed activities (such as sports practicing, music lessons) and participation in outdoor/street activities of children. School inclusion criteria were also considered, such as local incidence of SARS-CoV-2, size and the socioeconomic status for this analysis. The age was computed by the birth date and the inclusion study date and 3 categories were considered based on the school level as 6 - 7, 8 - 9 and 10 - 12. For the school inclusion criteria, the extremes were used: a low (<5.0/1000 persons) or a high (≥5.0/1000 persons) local incidence of SARS-CoV-2, a small (<230 children) or a large (≥230 children) school and a low (SES ≤ 7) or a high (SES ≥ 13) socioeconomic status.
HAD anxiety and depression scores were analyzed considering sex, age, and school inclusion criteria. For the age of the staff, 4 categories were considered as 18 - 29, 30 - 39, 40 - 49 and above 50.
Statistical significance level was set to 0.05. Data analysis was performed with R 4.2.2.
3. Results
3.1. Inclusion
3.1.1. Children
Inclusion questionnaires were completely or partially answered by 99.7% (929/932) of children (Table 2). Mean age of responders was 9.0 ± 1.7 years, and 52% (479/929) were girls. 79% (731/924) lived with both parents. 85% (777/917) lived in a house, and 81% (746/929) had a garden. 67% (618/922) had their own bedrooms, and the remaining 33% shared bedroom with at least one relative. 56% (514/912) had at least one parent teleworking at least once a week.
62% (565/914) had at least once a week an organized fixed activity (such as dance, music lessons, soccer team, scout). 38% (347/917) had at least once a week an outdoor/street activity (such as playing soccer in the street, going to the playground).
3.1.2. School Staff
Inclusion questionnaires were completely answered by 96% (233/242) of school staff (Table 3).
The mean age of school staff was 42 ± 11.8 years, and 86% (198/230) were women. 95% (218/229) staff reported having a good health, but 10% (22/218) of them recognized having a disease problem. Among the eleven who didn’t feel in good health, 1 had diabetes, 4 had asthma, 2 had lupus, 2 had a heart disease, 1 had multiple sclerosis, and 1 have a crohn’s disease. In the school, 4% (9/227) were directors, 67% (152/227) were teachers, 4% (9/227) were secretarial staff, 13% (30/227) were supervisors or daycare, 4% (10/227) were in the school maintenance, and 8% (17/227) had another function, such as childcare, invigilator. Staff had sometimes multiple functions in the school. 42% (94/223) staff had a family budget above 3000?
3.2. Well-Being Analysis
3.2.1. Revised Children’s Manifest Anxiety Scale
30% (281/932) of children have answered to at least one of the 37 questions and 25% (231/932) answered completely to the 37 questions. Among these 231
![]()
Table 2. Characteristics of children interviewed in schools during COVID-19 pandemic (January-May 2021).
Note: n: number; SD: Standard Deviation.
children, mean age was 9.0 ± 1.7, and 58% (135/231) were girls.
Among RCMAS anxiety score, no significant mean difference was observed between categories of sex, age, social activities, local incidence, school size and SES.
There was however a significant difference between those who practiced outdoor/street activity and those who did not (11.8 ± 6.1 versus 9.8 ± 5.8; p < 0.05).
53% (122/231) had symptoms of anxiety (RCMAS anxiety ≥ 10), and 31% (72/231) had a definite state of anxiety (RCMAS anxiety ≥ 14).
Girls reported more anxiety symptoms (≥10: 59%; Adj OR = 2.25; 95% CI [1.28; 4.03]) than boys (Table 4). Younger children had more often anxiety symptoms (6 - 7 years: ≥10: 59%; Adj OR = 1.38; 95% CI [0.66; 2.91] 8 - 9: ≥10: 54%; Adj OR = 1.37; 95% CI [0.73; 2.60]). There was no difference between children who participated in organized fixed activity and those who did not (≥10: 57%; Adj OR = 1.06; 95% CI [0.54; 2.09]). Children who did not participate in outdoor/street activity were less likely to have anxiety symptoms (≥10:
![]()
Table 3. Characteristics of school staff interviewed in schools during COVID-19 pandemic (January-May 2021).
Note: n: number; SD: Standard Deviation.
49%; Adj OR = 0.60; 95% CI [0.33; 1.07]). There was no difference between children in schools with a low or a high incidence level of SARS-CoV-2 (≥10: 52%; Adj OR = 0.79; 95% CI [0.43; 1.46]). Symptoms of anxiety were more frequent in larger schools (≥10: 57%; Adj OR = 1.62; 95% CI [0.90; 2.97]) compared to smaller schools. Children in lower SES schools were more likely to have anxiety symptoms (≥10: 61%; Adj OR = 1.52; 95% CI [0.72; 3.28]).
In the 3 subscales of anxiety, girls had a higher hypersensitivity score (5.20 ± 2.96 versus 4.27 ± 2.93; p < 0.05). According to social activity, children who practiced outdoor/street activity (physiological manifestations score: 4.26 ± 2.18, concentration score: 2.33 ± 1.92) had a lower score than those who did not (physiological manifestations score: 3.46 ± 2.24, concentration score: 1.74 ± 1.76; p < 0.05).
Girls were more likely to have hypersensitivity (≥5: 52%; Adj OR = 2.42; 95% CI [1.35; 4.41]). Children between 6 and 7 years were less likely to have difficulties to concentrate and to have social anxiety (≥4: 10%, Adj OR = 0.33; 95% CI [0.10; 0.91]). Outdoor/street activity were associated with RCMAS physiological
Table 4. Association between RCMAS anxiety and characteristics using logistic regression.
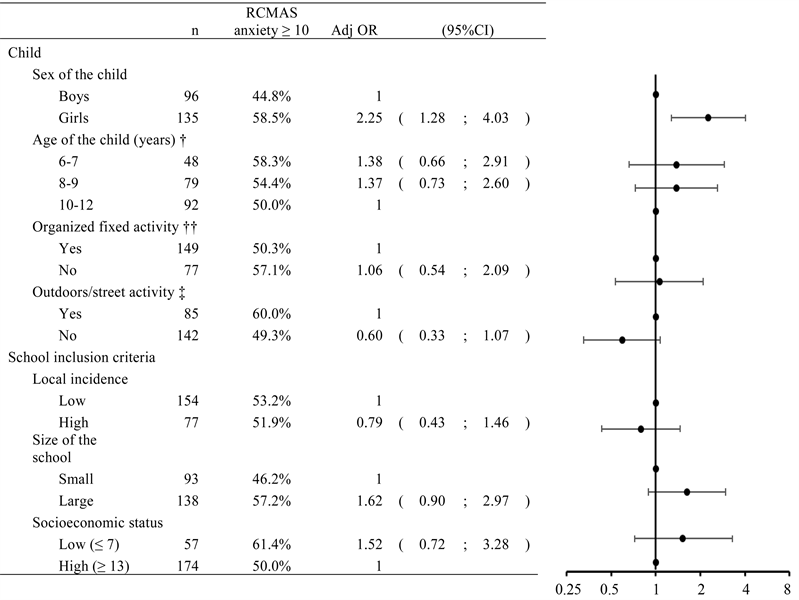
Note: n: number; Adj OR: Adjusted Odds Ratio in multiple logistic regression; CI: Confidence Interval; †12 missing values; ††5 missing values; ‡4 missing values.
manifestations (≥5: 31%; Adj OR = 0.52; 95% CI [0.29; 0.94]), and RCMAS hypersensitivity (≥5: 42%; Adj OR = 0.49; 95% CI [0.27; 0.89]). In larger schools, children were more likely to have hypersensitivity (≥5: 51%; Adj OR = 1.87; 95% CI [1.02; 3.46]).
3.2.2. Social Desirability
Girls had a higher RCMAS social desirability score over boys (4.76 ± 2.41 versus 4.07 ± 2.35; p < 0.05). According to the age of the child, youngest children (6 - 7 years) had a higher RCMAS social desirability score (5.08 ± 2.33) than other children (8 - 9: 4.63 ± 2.29; 10 - 12: 4.05 ± 2.47; p < 0.05). According to social activity, children who practiced a social activity (organized fixed: 4.23 ± 2.49, outdoor/street: 3.96 ± 2.48) had a lower score than those who did not (organized fixed: 5.00 ± 2.15, outdoor/street: 4.79 ± 2.31; p < 0.05). According to socioeconomic status, children in schools with a lower SES (SES ≤ 7) had a higher RCMAS social desirability score (5.26 ± 2.16) over higher SES (SES ≥ 13) (4.22 ± 2.43; p < 0.05).
65% (150/231) of children had a suspicion of social desirability (RCMAS social desirability ≥ 4), and 52% (120/231) had a definite state of social desirability (RCMAS social desirability ≥ 5).
Girls had more social desirability (≥5: 57%; Adj OR = 1.74; 95% CI [0.95; 3.23]) compared to boys (Table 5). According to age, youngest (6 - 7 years) and middle aged (8 - 9 years) children had more social desirability (≥5: 6 - 7: 71%; Adj OR = 3.44; 95% CI [1.53; 8.09] 8 - 9: 51%; Adj OR = 1.50; 95% CI [0.77; 2.96]) than oldest (10 - 12 years). Children who did not practice a social activity had more social desirability (≥5: organized fixed: 64%; Adj OR = 1.90; 95% CI [0.93; 3.93]—outdoor/street: 60%; Adj OR = 2.59; 95% CI [1.38; 4.99]). In schools with a higher local incidence of SARS-CoV-2, children had more social desirability (≥5: 64%; Adj OR = 2.15; 95% CI [1.13; 4.17]). In schools with a lower SES, children had more social desirability (≥5: 72%; Adj OR = 2.74; 95% CI [1.23; 6.37]).
Higher RCMAS anxiety (r = −0.18; p < 0.05), physiological manifestations (r = −0.23; p < 0.05), concentration and social anxiety (r = −0.20; p < 0.05) scores were associated with a lower social desirability score.
Table 5. Association between RCMAS social desirability and characteristics using logistic regression.
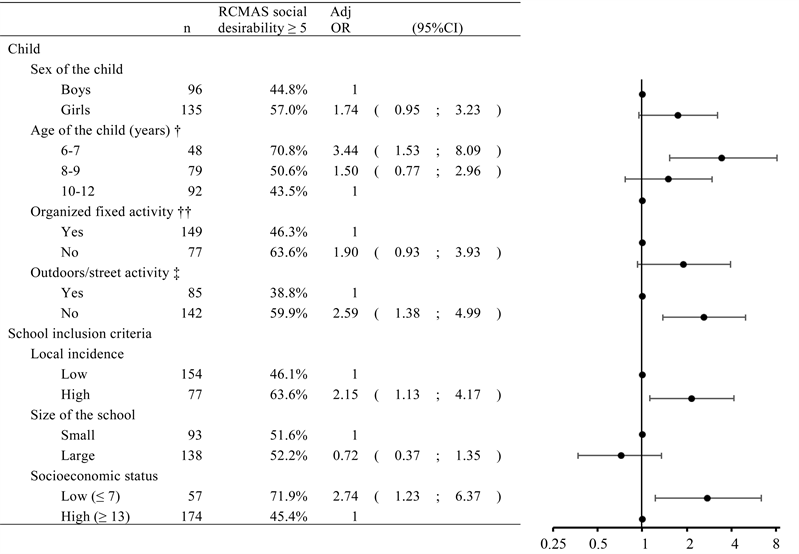
Note: n: number; Adj OR: Adjusted Odds Ratio in multiple logistic regression; CI: Confidence Interval; †12 missing values; ††5 missing values; ‡4 missing values.
3.2.3. Hospital Anxiety and Depression Scale
96% (233/242) of staff have answered to at least one of the 14 questions and 91% (221/242) answered completely to the 14 questions. Among these 221 staff, mean age was 41.7 ± 11.9, and 86% (190/221) were women.
3.2.4. Anxiety
Among HAD anxiety score, no significant mean difference was observed between categories of sex, age, local incidence, and SES.
There was however a significant difference between those who worked in small schools and in large schools (7.90 ± 4.08 versus 6.53 ± 3.28; p < 0.05).
42% (92/221) staff were susceptible to have anxiety symptoms (HAD ≥ 8), and 16% (35/221) had a definite state of anxiety (HAD ≥ 11).
Women reported less anxiety (≥11: 15% Adj OR = 0.44; 95% CI [0.17; 1.26]) than men. Staff aged between 18 to 29 (≥11: 20% Adj OR = 1.46; 95% CI [0.47; 4.53]), and 40 to 49 years (≥11: 19% Adj OR = 1.29; 95% CI [0.45; 3.83]), had more anxiety than the others. There was no difference between staff working in low or high local incidence level of SARS-CoV-2 (≥11: 14% Adj OR = 0.98; 95% CI [0.43; 2.28]). Staff working in larger schools reported less anxiety (≥11: 10% OR = 0.34; 95% CI [0.15; 0.77]). In schools with a lower SES, staff had more anxiety (≥11: 19%; OR = 1.72; 95% CI [0.77; 4.07]).
3.2.5. Depression
Among HAD depression score, no significant mean difference was observed between categories of sex, age, local incidence, school size, and SES.
13% (29/221) of staff were susceptible to have depression symptoms (HAD ≥ 8) and 5% (12/221) had depression symptoms (HAD ≥ 11).
Women reported being less depressed (≥11: 5% Adj OR = 0.62; 95% CI [0.14; 4.32]) than men. Staff aged between 18 to 29 years (≥11: 5% Adj OR = 1.41; 95% CI [0.16; 12.40]), 40 to 49 years (≥11: 7% Adj OR = 2.05; 95% CI [0.36; 16.00]), and above 50 years (≥11: 6% Adj OR = 2.19; 95% CI [0.40; 16.60]), reported being more depressed than the others. Staff working in high local incidence level of SARS-CoV-2 reported being more depressed (≥11: 6% Adj OR = 1.40; 95% CI [0.37; 5.61]). Staff working in larger schools reported being less depressed (≥11: 4% Adj OR = 0.43; 95% CI [0.11; 1.57]). In schools with a lower SES, staff reported being more depressed (≥11: 6%; Adj OR = 1.48; 95% CI [0.42; 6.17]).
3.2.6. Perceived Life
Lower scores in the perception of life during the COVID-19 pandemic were reported by staff compared to the perception of life in 5 years (Figure 1). Higher perception life in 5 years was associated with higher perception life now (r = +0.35; p < 0.05).
4. Discussion
Anxiety symptoms take a severe burden on children, which can lead to serious consequences and can have a significant impact on their present and future lives.
![]()
Figure 1. Perceived life on visual analogue scale now and in 5 years according to staff.
Alongside this, previous research into past pandemics has shown several consequences for children’s well-being. The pandemic reinforced social inequalities, social contacts, activities interruption, isolation and confinement, and it led to an imbalance in the well-being of children. This study is the first to our knowledge to investigate self-reported children’s well-being, especially in the primary schools during COVID-19 pandemic in Belgium.
In 2019, before the COVID-19 pandemic, the prevalence of anxiety and depressive disorders in children aged between 0 and 9 years were <1% and <0.1% worldwide, and 2% and 0.2% in Belgium, respectively. In adults (over 20 years old), the prevalence of anxiety and depressive disorders were 5% worldwide, 6% and 5% in Belgium, respectively [18] .
Our results showed that anxiety and depression in children and staff were higher during the pandemic than before. 53% of children were susceptible to developing anxiety (RCMAS anxiety ≥10), and 31% had a definite state of anxiety (RCMAS anxiety ≥14). 52% had a high score of social desirability (RCMAS social desirability ≥5), suggesting that the anxiety may be underestimated.
Children between 4 to 11 years of age reported that their most common symptoms of COVID-19 were concentration and mood swings [19] .
Anxiety is influenced by the entourage of the child. The well-being of relatives and other adults surrounding her/him has a significant impact on the actual well-being of the child. On the contrary, a happy child whose well-being is balanced becomes a generator of balance for those around her/him [20] . When an adult is anxious, she/he shares unconsciously this anxiety with the child, and this is reinforced during isolation and lockdown.
In staff, anxiety was more frequent than depression. 42% of school staff had a possible anxiety (HAD ≥ 8), and 16% had a definite state of anxiety (HAD ≥ 11). For depression, 13% had a possible depression and 5% had a definite state of depression. A study in China reported that 16% had anxiety and 27% suffered from depression [21] . In a systematic review of the long-term effects of COVID-19 on mental health, 18% of those tested with COVID-19 experienced at least mildly severe anxiety symptoms [22] .
The COVID-19 pandemic was very anxiety-inducing. All the changes in the protective’s measures and all the information worldwide given in order to limit the virus transmission have reinforced the anxiety and isolation. Children who did not practice outdoor/street activities were less anxious, hypersensitive, less tired, and more concentrated than the others, but the social desirability suggested that the RCMAS scores were probably underestimated in those children.
During COVID-19 pandemic, social activities were highly impacted because of the different protective measures and social distancing. In the United Kingdom, a study among 125 children with some disabilities reported that 61% changed negatively their physical activities during the lockdown period. 42% of children rated their well-being as worsening and 23% had worsened a little, as a result of the various distancing measures [10] .
A systematic review found that existing evidence of well-being appears to be impacted by psychological factors, such as confinement, lockdown, and interruption of social activities, in contrast to the limited association between long-term effects and the virus itself [22] . It can also explain that in our results, there was no difference in anxiety and other scores regarding low or high local incidence of SARS-CoV-2. Social desirability was higher in high local SARS-CoV-2 incidence, suggesting that the RCMAS scores were underestimated in children. This suggests that difficulties at school were not necessarily related to the fear of the virus itself.
In large schools, children seemed to develop more anxiety symptoms, to have more physiological manifestations, to be more worried and hypersensitive than in small schools. School size was not related to social anxiety in our results. Anxiety in large schools can be explained by a greater number of measures to limit social contact and the virus transmission, and it can lead to a fear of isolation and anxiety. Due to the increasing number of social contacts, the probability of being in contact with the virus was higher in large schools, which led to a sense of reassurance in isolation.
Staff were more anxious in small schools than in large ones. This can be explained by the number of staff working in the school. In larger schools, there are more staff workers, so it may be easier for everyone to relate to certain co-workers and it results in more emotional support.
As the pandemic reinforced social inequalities, the well-being of children and staff deteriorated. Anxiety, hypersensitivity and schools’ problems were higher in schools with a low SES. Social desirability was strongly higher in schools with a lower SES (SES ≤ 7). A negative correlation between anxiety, physiological, concentration and social desirability score indicates that children with a high desirability score reported a lower anxiety score, and therefore anxiety was probably underestimated in schools with a low SES.
Staff reported a higher score about their future life (in 5 years) than during the COVID-19 pandemic. These results suggest that staff are experiencing some insecurities during the pandemic, but these insecurities may disappear once the situation improves.
The COVID-19 pandemic has weakened the life of adults, and has caused problems other than the well-being of the child, and these problems have a direct impact on the well-being of the child.
In Belgium, the Centre PMS (“Centre Psycho-Medico-Social”) is a service composed of psychologists, social assistants and nurses. This service offers support to children and adolescents in primary and secondary schools. Its missions are essentially to provide assistance in the harmonious development of children and adolescents, but also to ensure that everyone has equal opportunities for personal emancipation [23] . The school can ask them for support to help the child and raise awareness among parents. This was already in place long before the pandemic, but with the imbalance caused by the sanitary crisis, the resources provided might not be sufficient to effectively support every child. With the COVID-19 pandemic, the demand for support from PMS has strongly increased. The government has established a special unit called “COVID support” to help the Centre PMS respond to the increasing demand. This unit was initially scheduled for a 3-months period of time, but the demand didn’t decrease and the period was extended until November 30th, 2022 [24] [25] . Unfortunately, the demand did not decrease and the Centre PMS was overloaded.
In Belgium, besides the PMS, the INAMI (“Institut National d’Assurance Maladie-Invalidité”) is a social security structure that ensures access to health care for everyone. During the COVID-19 pandemic, to ensure that everyone can access to emotional support, they set up a system of first-line psychologists with a set up number of sessions at a low-cost [26] . Since the “COVID support”, in order to help the Centre PMS, was not extended after November 30th, 2022, the government proposed a collaboration between the first-line psychologists and the center PMS. This collaboration would aid children who are not yet in care [27] .
Anxiety can be indirectly linked to the inaccessible health care during the pandemic. At the beginning of the pandemic, a person with susceptible COVID-19 symptoms (e.g. temperature at 38˚C) was asked to stay at home. Hospital and physician’s consultations were maintained for urgencies only. Video consultations were recommended to limit the virus transmission [28] . Indirectly, the inaccessibility to health care induced the incapacity of individuals to improve their health and well-being.
RCMAS scale is an interesting tool, because it does not only compute children’s anxiety. The different related dimensions, physiological manifestations, hypersensitivity, and concentration give us information such as fatigue, isolation fears, concentration problems, and social anxiety. In addition, the dimension of social desirability, which can be an important bias in self-reported questionnaires, is interesting information in understanding the other dimensions of this scale.
5. Limitations
Our study presents some limitations. Well-being questionnaires were answered by 30% of children and 96% of staff at least partially. Non-respondents’ well-being may be more altered than responders. This figure is, however, unconvincing. 25% of children have answered this questionnaire completely. This low percentage can be explained by the well-being questionnaire distribution; well-being questionnaire was introduced within a booklet with tips and the child had 6 weeks to answer and give it back to the interviewer. A lot of booklets were lost (≈70%). Such a missing process can be ignorable, but the well-being questionnaire was completed by children back home. The results may be influenced by the degree of understanding, especially for the youngest children who may require support from a relative.
As a cross-sectional study, some other factors can play a confounding role in the well-being. Analysis was made on COVID-19 and related factors. COVID-19 and its consequences are not the only factors that have impacted the well-being of children and workers. Family situations, personal situations and many other factors can have an impact on the well-being of the child and staff.
6. Conclusions
Nevertheless, our findings demonstrated a loss in the well-being of children during the COVID-19 pandemic. COVID-19 has caused many imbalances in many sectors and has changed the routine of every human being. Special attention must be focused on the most vulnerable groups, as the consequences can be catastrophic in the long term. Our results showed that the well-being of children was impacted during the COVID-19 pandemic. It is important to evaluate and document children’s well-being after the COVID-19 pandemic in order to assess if the decrease in well-being maintains and set up interventions in order to limit consequences later in life.
In order to detect signs of imbalance in children’s well-being, the school environment should receive more appropriate training to improve their consciousness of this issue. Appropriate questionnaires could be developed so that teachers and school directors can easily help children who need specific help and refer them to the right services.
Acknowledgements
The authors wish to express their sincere gratitude to the participants and the participating schools who made this study possible.
Compliance with Ethics Guidelines
Study Registration: The protocol, informed consent forms, and questionnaires were approved by the Hospital-Faculty Ethics Committee Saint-Luc (“Commission d’Ethique Hospitalo-Facultaire des Cliniques Universitaires Saint-Luc”)—UCLouvain, approval number: 2020/16NOV/552. It was registered on clinicaltrials.gov on 16/09/2021, identifier number: NCT05046470, and on ISRCTN on 20/04/2022, identifier number: ISRCTN16837012.
Funding
This work was supported and funded by the Federation of Wallonia Brussels. The study funder was not involved in the study design, data collection, data analysis, data interpretation, or in report writing.
NOTES
*Corresponding author.
#These authors shared last authorship.