1. Introduction
The reality, which we derived from studying the world shipbuilding, is that there is plenty of room for a beneficial co-operation between ship-owners and shipbuilders. This is the result, in particular, of the 70-yearly cooperation between the ship-owners of Greece, from the land of Acropolis (Picture 1), and the shipbuilders of Japan, in the Land of the Rising Sun!
As shown, the above is the upper fortified part of the ancient Greek city of Athens, situated on a hill about 76 meters high, and richly adorned, especially in 5th c. BC, with architecture and sculpture, with particular interest to the Parthenon, the temple of Athina. Acropolis has nothing to do with shipbuilding, but as the Rising Sun is a symbol of Japan, Acropolis is a symbol of Greece.
Japan wanted, mainly in 1952, to build ships…for exports. Its main customers were the Greek ship-owners, managing similar buildings, built mainly in UK. The central feature of Japan was its cooperation. This was a “modus operandi”. In order to achieve this, we believe, one had to consider the other equal, having common memories, mentioned below.
In few words, the Greeks became a kind of “teachers” for the Japanese shipbuilders. For example, the Greeks, as seamen, “taught” Japanese the safety of ships. The Japanese offered a robust “steel hull”, at a faster1 time than hitherto, at a lower price, with bank finance and a subsidy…
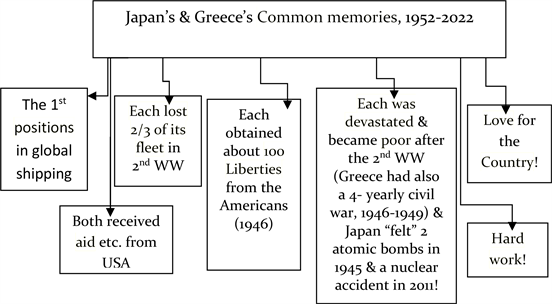
Greece and Japan experience the following common memories (Graph 1)!
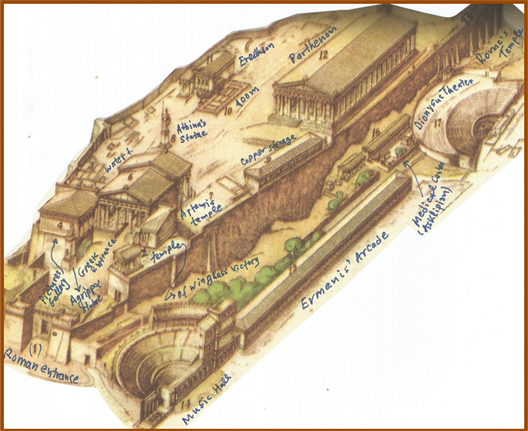
Source: ground plan of the Acropolis of Athens, drawn by A Dourm, 1925, modified.
Picture 1. The Acropolis of Athens.
Source: author.
Graph 1. Japan’s & Greece’s Common memories, 1952-2022.
Moreover, the Japanese love discipline, and obey to their leader, unlike Greeks where all their, indeed admirable, achievements, are… with reference to persons each time!
Japan started its development from scratch (1948). Characteristic was that when the Japanese used to import grain, corn & scrap-iron, having then no proper port facilities, the port labor, made-up by 60% by women, worked 8 hours for themselves, and… 8 hours for Japan, used “nets” and loading cargo in barges!
2. Aim and Structure of the Paper
Paper’s aim is to present analytically the results of the cooperation of the shipbuilders of Japan, and of S Korea, since 1952, with the Greek Ship-owners. This paper is a companion to the paper of Dr. Goulielmos (2023) . Shipbuilding is a case of transnational competition, we reckon, but also of global cooperation.
The paper is structured in 11 parts, after literature review: Part I, dealt with the Hellas-Japan friendship agreement (1899); Part II, dealt with the Greek-Japanese maritime background; Part III, dealt with the Greek orders placed in Japanese yards, 1952-2022, 1st case-study; Part IV, dealt with the cooperation of the Athens-Piraeus ship-owners with the Japanese shipbuilders (1952-2022)-(1st case-study continued); Part V, dealt with the question: “Why Greek ship-owners build ships in Japan during the last 22 years (2001-2022)”? (the 1st case-study continued). Part VI, dealt with the mini bulk carriers built in Japan for a Greek company; Part VII, dealt with the Chinese shipbuilders; Part VIII, dealt with the S Korean Shipbuilding, (a 2nd case-study); Part IX, dealt with the building of the 1st shipyard in the land of the Morning Calm (the 2nd case-study continued); Part X, dealt with the topics for further research and Part XI, dealt with a proposed “economy” shipyard. Finally, we concluded.
3. Literature Review
Pires Jr. (2001) presented the shipbuilders of Brazil since the end of the 1960s, when Brazil drafted a yard policy. By 1985, this policy collapsed, and by 2001, the Brazilian shipbuilders had no order. Brazil debated, in particular, over the relationship between shipping and shipbuilding, wondering whether the two can be integrated… The governmental policy implied a massive net economic transfer mainly from the Brazilian importers to country’s shipbuilders!
Dikos (2004) tested the stabilizing role of the freight rates (on new-building prices). Maritime economists believed that “the new-building prices stabilize shipping industry”. He argued: “if the demand for oil increases, the time charter rates increase, and the ship orders increase”. “But the prices of the new buildings do not adjust as fast”. This issue is proposed for a further research.
Glen (2006) presented the shipbuilding output (in cgt), between 1976 and 2003, in EU, the rest of Europe, Japan, S Korea and China (Figure 1).
As shown, Japan produced more ships than EU2, from 1976 to 2003 (27 years; except in 1986). S Korea surpassed Japan in 2002 and in 2003. The impact of the 1981-1987 crisis in dry-cargoes can be traced: production varied from 14 m cgt in 1981 to 11m in 1991. The cyclical character of shipbuilding is also shown: production from ~22 m cgt, in 1976, returned almost to it, in 2003 (~23 m cgt) (in 28 years)!
Veenstra & Ludema, (2006) answered the questions: “How a ship-owner can have the right ship” and “when is she performing best”? They argued that the earning potential of a vessel is determined by: her cargo capacity, speed &
![]() Source: Data from Glen (2006) ; (*) Croatia, Norway, Poland & Romania.
Source: Data from Glen (2006) ; (*) Croatia, Norway, Poland & Romania.
Figure 1. The output of world shipbuilding (per main area), 1976-2003 (selected years).
versatility. Mulligan (2008) produced a model for estimating the new-building costs (2003-2007). He concluded that “if capacity constraints exist, then shipbuilders charge higher prices”… He, we suppose, meant during a boom.
Shi & Li (2017) found that in the research area of “shipbuilding, scrapping, new orders & 2nd hand ships”, only 37 works published out of 1292 in 19 journals3 (2000-2014; = 3%)! Goulielmos (2023) mentioned also that only 23 works on shipbuilding appeared, in the two main journals of the industry, since 1982 and till 2009 (28 years)!
Goulielmos (2022) showed that building a ship may last up to 8+ years, during an exceptional boom, like that in 2003-2008. We assume that there were few new berths constructed by the yards to respond to that high demand… An old question was there: “Are the yards reluctant to build nowadays new berths, unlike what Zannetos (1966: p. 80) believed?” Zannetos (1966) argued that in a period of high time-charter rates, shipbuilders do not quote higher prices, but instead look to expand, having a higher capacity for the future, and cutting current one! This issue is proposed for further research.
Summarizing, the limited research about shipbuilding is obvious. Moreover, it is clear that shipbuilding “travels” from country to country, using the time as a vehicle!
4. Part I: The “Hellenic-Japanese Friendship Agreement”
In 1899 an “agreement of Friendship, Trade and Shipping” signed between Greece and Japan (a treaty of amity, commerce and navigation, 01/06/1899 in Athens; ratified 16/08/1899 and revived and published 04/08/1953) (https://www.mofa.go.jp). This treaty had as a purpose to declare a firm and perpetual peace and amity between the Empire of Japan and the Kingdom of Greece and to consider both as the most favored nations. Freedom of commerce and navigation established.
Moreover, the very old Greeks remember the Japanese vessel “Tokei-Maru”, which rescued hundreds of Greeks from the Smyrna port in flames in 1922.
5. Part II: The Greek-Japanese Areas of Shipping Activity
The fleets of Greece and Japan worked in parallel markets during the pre 2nd WW, serving different geographical areas (Graph 2).
Japan, and Greece, after the 2nd WW, suffered from high unemployment and the effort of the Governments was to provide a steady employment and fair wages. Moreover, the Japanese were aware that great shipbuilding European nations before them were: Britain, Germany, Belgium & Scandinavia ( Goulielmos, 2023 ). Japan carefully, and intensively, designed the development of their country as a universal shipbuilder, and as early as 1952, it was in a position to compete all European yards!
The Greeks, named the post 2nd WW period “golden”, because not only their fleet reached its pre-2nd WW level, but also it has been modernized, thanks to the eventual cooperation with the Japanese shipbuilders!
The End of the Liberties
Both Greeks, and Japanese, realized that the “Liberties” ships, which both owned by hundreds, had to be replaced! They carried a rather low amount of cargo, about 10,000 tons, at a rather low speed (10 k). They were economical ships, no doubt, but till to be replaced they would pass the 20 years of age! Worth noting was also that ship-owners discovered at that time the economies of scale, given the fast growth of the seaborne trade!
The philosophy, however, of the Japanese, as shipbuilders, from the beginning was to build ships to last! The philosophy of certain Greek ship-managers was different: they wanted a new dry cargo ship sized 25,000 dwt or even 40,000 (1966)! The Greeks, at that time, had to improve also the working conditions on board4.
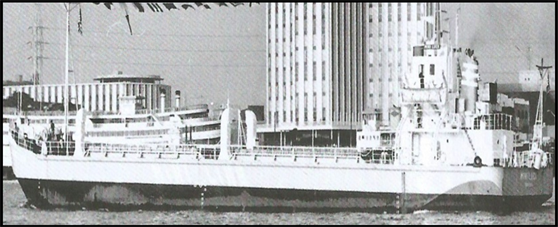
The Japanese proposed a new design, named, apropos, “Freedom” (Picture 2), of 14,093 dwt, with speed of ~14 k, (a rather middle speed), with only 20 persons
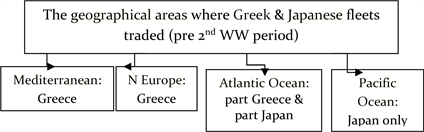
Source: author.
Graph 2. The geographical areas where Greek & Japanese fleets traded (pre 2nd WW period).
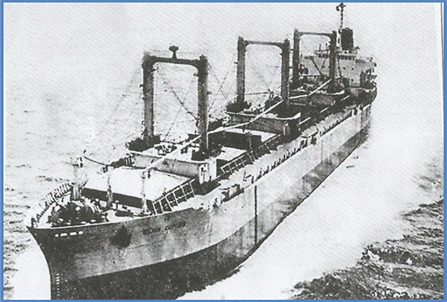
Source: “Naftika Chronica” journal, 2022 special edition, modified.
Picture 2. The 1st Freedom: a Japanese-Canadian production, 1968.
for crew, giving a focus on a reduced crew for manning the engine-room!
Schoyen & Erichsen (1995) showed that the Liberties consumed 27 tons of oil/day, against 20 of their replacement, and she also had 30% more cargo capacity… The Greek5 ship-owners corrected the initial Japanese plans6, and produced new specifications! They soon built more than 42 ships of this type in Japan (1968-)!
The Japanese, cleverly, we believe, wanted, all along, to reduce the total cost of the ship-owners, by reducing 1st the number of crew in the engine room, as well the cost7 of the entire vessel through a lower price providing a quality vessel to last at least 20 years! This effort, we believe, is one of the main reasons in attracting customers there…
6. Part III: The Greek Orders in the Japanese Yards, 1952-2022: 1st Case-Study
Historically, there were only 1 or 2 Greek ship-owners to order ships in Japan at the beginning! Both Greeks and Japanese celebrated8, in 2022, in Athens, the 70 years of their cooperation, since 1952! Worth noting is that in 1956, when Japan surpassed the traditional dominant UK shipbuilding, ½ of the tonnage built in Japan, was for… the Greek ship-owners!
One of the 1st Greek ship-owners, who ordered 40 ships in Japan, since 1960, argued, that at that time (1960-1980), only Japan was in the shipbuilding horizon, and moreover, it was more competitive than all W European yards! Even in 2022, this company, built ships in Japan, for having the latest technology!
6.1. The Good Chemistry between Greek Ship-Owners & Japanese Shipbuilders
The Greek ship-owners and the Japanese shipbuilders developed a good chemistry, due, we believe, to certain common properties (Graph 3).
6.2. The Japanese Shipbuilding Policy (1952-2022)
Shinohara (2010) presented shipbuilding etc. in Japan up to 1999. Shipyards contributed there 5.2% of GDP, among 12 sectors! Shipping created 14.2% of the total value (=$111b; 1 $ - 110.5 Yen). Shipbuilding9 provided ~38,000 working posts vis-à-vis 59,500 of shipping, out of a total of ~2 m.
We distinguish 4 phases in Japan’s shipbuilding policy (Table 1).
Japan’s order-book increased till 1973-74, and up to 1980. But neither Japan, or Greece, expected the 1981-87 shipping crisis in bulk carriers, which followed
![]()
Graph 3. The Common properties leading to a good chemistry between Greek ship-owners & Japanese shipbuilders, 1952-2022.
![]()
Table 1. The phases of the Japanese shipbuilding policy, 1952-2022.
Source: author; data from “Naftika Chronica” journal, 2022; (*) Not subject to… inspections.
the ones in 1975 and in 1979 of tankers, as well the last financial and shipping crisis (2009-2018), the Pandemic (2019-23) and the Russian invasion in Ukraine (2022-).
The Japanese also realized that the speed in building ships depended on technology and on methods of production. Japanese soon adopted automation and standard designs, but only when they were mature, and as a counter-measure for their increased costs! The fast delivery, of course, is very important for the yards, especially when the profit margin is narrow, but not for the ship-owners if markets are depressed10…!
Each ship, in Japan, made-up by 7, or so, blocks11. The blocks carried at the erection place by proper cranes and/or trucks. The assembly of the blocks together, the connection of pipes between them, and melting, were of high quality and accuracy. One factor that needed more time is the daily inspections from all persons involved, and for the repairs that had perhaps to be made as a result, or after ship’s sea trials (very important!).
The Japanese gradually improved their methods of production, starting first with scaffoldings, baskets that could be raised-up, the, so-called, “cherry pickers” and with small blocks! An “Aframax”, however, needed 8 - 9 months to be built, faster than hitherto (!); 1000 to 2000 Japanese workers built 20 - 30 vessels (1985; holidays?)! One vessel needed 50 - 70 workers to be finished.
7. Part IV: The Cooperation of the Athens-Piraeus Ship-Owners with the Japanese Shipbuilders (1st Case-Study Continued), 1952-2022
In 2023 (Feb.), the Greek-owned shipping owned 4709 ships (valued $153b) of which 2272 bulk carriers (48%), 1450 (31%) (valued $61b) tankers, 430 containerships (9%), 252 gas carriers (5%) of which 137 LNG (19% globally, out of 710) and 305 others (7%), in accordance with the yearly maritime transport review of UNCTAD for 01/01/2022 for ships above 1000 GT.
In the Greek cities of Athens-capital and Piraeus-port, now, one will find, in 2022, the offices of the majority of the shipping companies of Greece, though not all the “millionaires”. The millionaires in 2018 were 30 (Figure 2).
As shown, the 30 top shipping companies owned ~244 m dwt in 2018. The smaller company owned 3 m dwt (Polembros). In more detail Table 2 presents the relevant companies.
In Piraeus now, 563 companies managed, in end-2022, 519112 ships (441 m dwt of average size: 9.22 ships; 783,304 dwt each company). From these 563
![]() Source: author’s archive.
Source: author’s archive.
Figure 2. The tonnage owed by the 30 top Greek-owned shipping companies (2018) (the “millionaires”).
![]()
Table 2. The tonnage owed by the 30 top Greek-owned shipping companies (2018) (the “millionaires”).
Source: the same as in Figure 2.
companies, the 331 (~59%) (which managed 109 m dwt or ~329,000 dwt on average), built 1482 ships in Japan. These companies cooperated mainly with 5 Japanese shipyards, building there 920 ships (62%). The 1482 ships meant ~21.2 ships p.a., since 1952 (Figure 3).
As shown, from the 1482 ships, 70% were bulk carriers and 21% tankers. The dry cargo ships (built in Japan) were as follows (Figure 4).
As shown, 39% were Panamax, 29% Supramax and 24% handy (= 92%). Greeks in 2023 owned ~15% of the world tonnage in dry cargoes. The 10 top companies had 511 dry cargo ships and 37 on order (Table 3).
The situation with the tankers was follows (Figure 5).
As shown, from 305 tankers, the majority was Aframax (32%), a type recognized as the “work-horse” of tankers. The “medium range” tankers followed
![]() Source: data from “Naftika Chronica” journal, 2022.
Source: data from “Naftika Chronica” journal, 2022.
Figure 3. The ships built in Japan by the Athens-Piraeus Shipping companies, per main type, 1952-2022.
![]() Source: as in Figure 3.
Source: as in Figure 3.
Figure 4. The Bulk Carriers built in Japan (1952-2022).
![]()
Table 3. The 10 top Greek dry cargo fleets, 2023 Feb., in number of ships and on order.
Source: Naftika Chronica, 2023.
![]() Source: as in Figure 3.
Source: as in Figure 3.
Figure 5. Tankers, by type, built in Japan (1952-2022).
with 28% (=60%).
8. Part V: Why Greek Ship-Owners Built Ships in Japan during the Last 22 Years (2001-2022)? (1st Case-Study (Continued))
There are, indeed, Greek shipping companies, which ordered ships in Japan, (Ultramax, Kamsarmax etc.) since 2001! This phenomenon, one may call it a paradox, given that Japan builds ships for the Greeks for 70 whole years! Moreover, 2001 was a shipping recession year, but… it provided a perfect timing ( Goulielmos, 2021 )!
The reasons which made ship-owners to choose the Japanese as their shipbuilders were, we reckon (Graph 4).
The family yard, we have in mind, built 142 ships for Greek ship-owners so far, out of 920 (~15%). The Japanese, during negotiations, resist in accepting changes, arguing that they offer: a lower price, a faster delivery and having an accumulated experience of 7 decades! In fact, 6 vessels delivered during this
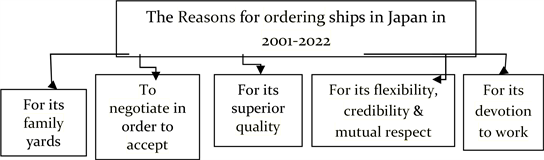
Source: author.
Graph 4. The Reasons for ordering ships in Japan in 2001-2022.
case-study in 22 months (110 days per vessel13; 3 months & 20 days!).
The Greeks, as ship operators, mainly of bulk carriers and tankers, argued that they know what they want, and why. Greeks, e.g., knew the importance of painting for the vessel to last, while the Japanese proposed one coat! Greeks also knew about the “segregated ballast tanks”...
In the operation of the ship, the knowledge obtained from her supervision during building, it effectively contributed in solving problems after delivery! In addition, the Japanese yards keep an after sales communication with their customers, and records of all discussions!
In another example, a newcomer Greek shipping company (2006 est.), ordered more than 10 bulk carriers in Japan, trusting the Japanese knowhow and its ship-building experience. Also, for prestige reasons, we believe! Another, traditional, Greek company, (est. in 1875!), in 2001, submitted a shipbuilding plan to Japan for building 30 ships there, including Eco ones (2013-16), which can achieve notable fuel economies and cause less air pollution!
Thus the reasons for building ships in Japan, even after 70 years, for the Greek ship-owners, can be summarized as follows (Graph 5).
As shown, the clever Japanese asked from their steel-mills for a lighter, we believe, equally strong, steel, so that to build cheaper vessels! The Japanese were also able to build fuel-economy main engines, smaller also in size, we believe, after the oil crises of 1975 and 1979. In addition, the faster ship production it could achieve lower fixed cost per vessel for the yard. The improved Japanese hydrodynamic designs could also provide lower oil consumption, higher speed and more voyages at the unit of time! The stronger loading/unloading meant a reduced stevedoring cost.
The best yard, however, is not only the one building a quality vessel to last at a lower price, which is paid once, but also a ship with lower total operational cost after delivery, which is more important and has to be paid 20 at least years!
9. Part VI: The Mini Bulk Carriers Built in Japan for a Greek Company
This is a ship (Picture 3) designed to transport cargo in lakes/rivers, “conceived”
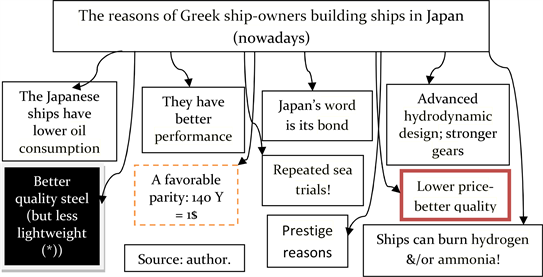
(*) The less steel made the ships lighter, and cheaper, we believe, but these steel plates need higher maintenance to retain their… fat. Also, less scrap money can be collected. The Japanese shipbuilding is supported by the large chartering companies NYK, K-Line, MOL, etc. These order ships through Japanese ship-owners in Japan, and charter them back, usually for 10 years. The NYK apropos ordered, in Feb. 2023, one “LPG/liq. ammonia VLCC”, burning twin fuels & carrying also ammonia & LPG. Electricity consumed by the ship will be produced using her LPG. She is expected to release 95% less SOx and 20% less CO2!
Graph 5. The reasons of Greek ship-owners building ships in Japan (nowadays).
Source: “Naftika Chronica”, 2022, modified.
Picture 3. The 1st Mini Bulk-Carrier, named “Mississippi River”, 1969.
by a Greek ship-owner and his staff. There were built 50 of them in Japan, having, originally, in mind, the trade of grain between “USA N W states’ and “New Orleans”, served at that time by barges etc. The bulkers had a rather small engine, but low oil consumption, fully automated, with a rather small crew (8 persons). Later they have been used in the trade in the “Pacific Ocean, connecting the N America with the Caribbean, carrying minerals via Orinoco River, sugar from Venezuela and grain, in return, to USA”.
10. Part VII: The Chinese shipbuilders
China having lower wages than Japan and S Korea & an abundant labor14 force, and creating also a substantial seaborne trade15 for some rather long time, shipbuilding could not be absent from its plans (1990-2000). Of course such an endeavor needed a prior technological progress, which China eventually achieved, or obtained.
Lu & Tang (2000) argued that Shipbuilding in China faced a number of challenges (1970-1990) (Table 4).
The Chinese decided to build ships for exports in 1980-90 (a bad timing). The 1981-1987 depression brought to them losses of ~$6 m. The provision of infrastructure and the adequate power supply to yards could easily be solved. Building main engines & equipment, as well steel & all other materials, at home, is strongly recommended!
For keeping excessive stocks, the solution is to apply the “just in time” procedure. This method invented by the Japanese in their effort to make labor fixed! The Japanese wanted it in their original philosophy of “life employment”, but they needed a factor to make it variable in its place, and they chose16 all kinds of stocks! Our estimation for the Chinese shipbuilders is that they will become first
![]()
Table 4. The challenges faced by Chinese shipbuilders, 1970-1990.
Source: Data from Lu & Tang (2000) .
in the world orders in 2023 and thereafter.
11. VIII: The S Korean Shipbuilding: A 2nd Case-Study
The S Korea, the land of the Morning Calm, emerged17 as a shipbuilding nation mainly in 197418. The S Korea thought shipbuilding as suitable medium for country’s economic development, though this had to be done more carefully as a strong competitor existed already out there... The paradox here is that the S Korean shipbuilding begun with… 2 VLCCs at a very wrong timing! This reveals that not only ship-owners, but also shipbuilders are unable to forecast markets! Only Greeks have found the solution to this puzzle and shipyards must follow them as their policy is win-win.
One must take into account also the commendable initiative taken by the manager of the 1st S Korean yard: Chung Ju-Yung. He foresaw the benefit of the economies of scale, particularly in the VLCCs19, equipped with steam turbines! Such ships were already designed by the British shipbuilders and built in S Korea!
The S Koreans, wisely, asked the cooperation of UK! In fact, the two 259,000 dwt VL tankers could be built in S Korea, provided a ship-owner was found, who would be able to obtain the required finance. G S Livanos emerged, a Greek, to add the one VLCC to his fleet in Nov. 1974, and the other in 1976! The Greeks are everywhere when opportunities arise!
But the Livanos’ decision has not taken into account the Arab-Israeli conflict, known as the 1st “oil crisis”, in end-1973 (-1975)! Forecasting is the weak point of all ship-owners! In 1975, 1979 and thereafter, many very/ultra large crude carriers led from delivery to scrapping and from order to cancellation, till the 2nd half of 1987 (e.g., the Colocotronis case)!
Greeks built in S Korea, since 1972, 1828 ships in 50 years. This means, 118 ships more than those built in Japan but in… 70 years! If this trend continues, S Korea will build finally more ships for Greeks. Greeks since 1992-95 ordered there 1 vessel per less than 1 week!
The wages in S Korea were lower than that in Japan, but this was also true for quality (1985), but it improved (by 2000). Certain Greek ship-owners built ships in S Korea including chemical tankers of 30,000 tons and Suezmax ones of 150,000 tons (1990-2000).
Worth noting is that the S Korean yards’ workers trained in Japan. In fact, the former shipbuilding countries and engineering nations, like UK, Germany, USA, Canada etc., sold their knowhow/their patents and their equipment, as well their cooperation/consultation, to the new shipyards, after the 2nd WW!
We believe that shipbuilding should be seen better as an international relay-race, where the 4 athletes belong to different nations and the length of the race is 4 × 30 years! The end athlete, however, obtains alone the gold medal and the other two the bronze and the copper…
For the reader to understand the complexity of the endeavor to build ships, Picture 4 may help.
12. Part IX: Building a Shipyard in the Land of the Morning Calm: The 2nd Case-Study (Continued)
The 1st modern S Korean shipyard project correctly realized that the 1st 2 important steps were: 1) to have building docks 650 m × 80 m and 2) to have one goliath crane, 450 tons at 140 m span! One mistake was that the steel plates had to arrive by sea. Moreover, the Government was fully supportive.
The number of ships, from 1974 to 2022, built by the S Korean shipbuilders and delivered to companies under the management of a Greek shipping group20, was 1828 (quoted by Foustanos, 2022 , and counted by us). Figure 6 shows 1837 (9 more).
![]() Source: author’s archive; worth noting is cranes’ lifting capacity & the length of the shipbuilding berth (=190 m). Strong point of this yard is its 400 t gantry crane.Picture 4. The outlay of a Greek shipyard.
Source: author’s archive; worth noting is cranes’ lifting capacity & the length of the shipbuilding berth (=190 m). Strong point of this yard is its 400 t gantry crane.Picture 4. The outlay of a Greek shipyard.![]() Source: data from Foustanos (2022) .
Source: data from Foustanos (2022) .
Figure 6. The Greek activity in S Korean yards, 1974-92; 1993-2022.
As shown, the Greek ship-owners were reluctant to order ships in S Korea at the beginning21, and thus only 32 ships delivered (1974-1992) (19 years)! This means that the shipyards expect the support of the domestic owners for their first say 10 years. The exceptional peaks in S Korean shipbuilding occurred in 2009-2012, when 513 ships delivered (28%). Of course these plethoric orders placed 2-4 years, or even 8 years, ago, and delivered when crisis started (2009) and thereafter (2012-). If we disregard the rather experimental period, 1974-1992, thereafter the ships delivered22 to Greeks by S Koreans were ~60 p.a. and thereafter, 80 p.a.
Table 5 shows the activity of each one of the 20 S Korean shipyards since 1974 (to 2022).
As shown, the 32 S Korean yards delivered 1836 ships to Greeks, where the lion’s share delivered by Hyundai, (in 5 locations), with 40% and 746 ships, followed by Daewoo, (in 3 places), with 243 ships and 13%, and Samsung with 211 ships and 11.5% (=64.5%). Worth noting is that 11 yards showed no delivery in 2022 (34%)!
Lee (1999) wrote about the restructuring of the S Korean economy and its impact on shipbuilding –after the Asian crisis. He argued that the industry began to expand rapidly due to exports (1972-76). The Government set a shipbuilding plan (1975), so that to provide to S Korean ship-owners attractive finance (till end-2000)! The above practice followed almost by all shipbuilding counties, i.e., to try to benefit domestic ship-owners, if possible, exclusively. Thereafter they realized that their business interests were to export, collecting revenue and foreign exchange.
![]()
Table 5. The S Korean production in number of ships per shipyard, 1974-2022.
Source: Data from Foustanos, 2022 .
The lesson we have been taught from studying shipping economics since 1971, is never influence the commercial decisions of the national ship-owners, but allow them to decide freely. Great political personalities like e.g., El. Venizelos, committed mistakes in their shipping policy! Politicians need two years to understand international shipping, which they hear about it, but they do not see!
In 1996, S Korea became a member of OECD, and its shipbuilding policy had to change. The 3 big shipbuilders secured orders then to keep them busy for the next 21/2 years, but they were asking some heavy payment in advance (about 70% - 80% of ship’s price!).
Certain S Korean yards, however, offered prices, for VLCCs and Containerships, 10% lower than their competitors... (a price war?). Moreover, the S Korean currency was weak, given also that the 65% of the building costs paid in it. The materials were paid by 50% in dollars and 10% in Yen! In 1999, 2 yards targeted ~$9b of sales. Shipbuilders, however, had to monitor not only the parity of their own currency, but also that of their competitors. At that time, Yen devalued against the $! Japan became cheaper.
The S Korean shipbuilders decided to put eventually more emphasis on tankers. Lee (1999) admitted that the severe competition against S Korean shipyards came mainly from Japan, and expected it also to be the case for the LNG ships (in 1999-2004).
The S Korea, in Jan.-Feb. 2023, received an order for 12 large containerships valued $2b-burning methanol (to be delivered by 2026)! In addition, it had orders of $500 m, for 2 LNGs, and before that, for an “LNG floating unit”, valued $1.5b!
Worth noting is that the demand for LNGs estimated to be 382b cubic meters, to be served by ~854 ships, where… 144 of them have to be built, valued approximately $36b!
Talking, however, about business and billion $, we forgot to mention the “lost people’s quality of life” (Table 6).
![]()
Table 6. The future main challenges for humanity in next 25 years.
Source: author. aHas ever one imagined how valuable will be the energy when Sun will stop warming the planet?
13. Part X: Subjects for Further Research
![]()
Table 7. The subjects proposed for further Research
Source: author.
![]() Source: data from ISL 2008 yearbook.
Source: data from ISL 2008 yearbook.
Figure 7. The contracting prices of 2 new-buildings, 1996-2007 (end-year).
![]() Source: data from ISL, 2008, p. 155.
Source: data from ISL, 2008, p. 155.
Figure 8. Time charter index 1972 = 100, 2002-2009.
![]() Source: data from Lloyd’s shipping economist, 1985.
Source: data from Lloyd’s shipping economist, 1985.
Figure 9. Time charters per day vs. shipbuilding prices.
As shown, the new-building prices of a tanker and a bulk carrier followed the same trend between 1996 and 2007, while in 2004 (no 8) both trends exploded. The time charter index (Figure 8) fell after 2005 and in 2006, unlike contracting prices (FR1) (2003-2007)!
14. Part XI: A More Economical Shipyard
Let us take a layout of an existing shipyard to work with (LO1). Given author’s experience as an economic advisor of a Greek shipyard, in 1970s, he/she is in a position to recommend changes in designing a more “economical” shipyard.
As shown, there are 17 centers, and certain others, which added latter. Our aims are as follows (Table 8).
Following the above aims it seems not to be needed to dig dry docks. A ground of armed concrete to bear the required weights is adequate. Our concept is to design a shipyard village served by a railway network, where 6 buildings
![]()
Source: from “Made in S Korea” (2022); modified.
LO1. The Plant layout of a shipyard.
![]()
Table 8. The aims of an economy shipyard.
Source: author.
from the above 17 to be the stations, (1, 3-5, 8 & 12) as shown.
![]()
Source: Internet.
The above aims have as a main target to reduce the cost of building and operating a shipyard! Moreover, in their entirety, aim at a shipyard to be built. Aim 8 is revolutionary, indeed, but important: the customer to design the ship he/she wants for her type, size, and also for her time of delivery!
The ship-owner to design his/her ship, and then the plans to be checked by the yard, not the other way round! This way, each ship-owner can apply his experience for the sake of his/her company, keeping also the patent rights for his/her company! I am sure that the ship-owners will prefer this. The hitherto practice is the clever proposals from the side, especially of Greek ship-owners, to apply to all yard customers thereafter, i.e. to their competitors! This change will require having an R & D department, a performance engineer, and a ship architect by the shipping companies.
15. The Main Innovations and Research Contributions
This work has revealed, through analyzing the history of shipbuilding, since 1952, how a shipbuilding nation, like Japan, excelled in this very important and capital intensive industry. It targeted by all means (research, new ideas, quality and efficiency, empirical wisdom etc.) to reduce the total cost of their clients, the ship-owners, in the short and in the long term! This explains why Japan even after 70 years and especially, as shown, in the last 20 years (2001-2022) attracted orders from Greek ship-owners. If there is a secret in shipbuilding this is the one, and we believe the unique, to follow also by S Korea and China.
Moreover, we proposed quite a number of further research projects because we have considered shipbuilding as the neglected industry within shipping economics as shown.
In addition, given author’s previous job as an economic consultant of a Greek shipyard, we wrote down certain ideas for a more efficient shipyard, increasing the weight of end-unit-product known as block, reducing the number of cranes and heavy transporters and moving and building a ship on metal berths on railway rails! Each berth accommodates one block and the berths can be extended as long as 650 m and beyond, as the rails can be. The vessel under construction and under erection visits a reduced number of shops located along the rails, which can serve two berths, taken ideally as shipyard’s railway stations! Moreover, we proposed a solution for shipyard’s electricity from hydrogen. But the most revolutionary of all contributions is to allow ship-owners to order the ship they want at the time they want her, drawing also ship’s plan themselves! We transformed shipbuilders from selling certain, about 7 standard ship models, to become… the famous tailors of ships!
16. Conclusion
The Japanese shipbuilders, eventually, adopted the “mass and series” production, automation, robots and welding. Also, they established offices in the main maritime world ports. At times of a shipping depression, the Japanese delayed delivery as long as 12 months, showing a care for the problems of their customers! They also understood from the start that they had to buy the relevant know-how first of building main engines there, and then to produce the steel! They were also watching their other industries and copied them in buying the proper equipment, and adopting the modern methods in transporting heavy items and reducing labor accidents.
Japan gained the reputation of a high-technology shipbuilder, along with its pioneering programs of research and development, improving their products constantly, especially in building bulk carriers and tankers, the popular types of Greeks! They achieved the most optimum designs, and the most efficient ships, as admitted by their customers! The customers were proud to say that their ships were built in Japan! It is also expected that the Japanese will provide a solution nowadays for the de-carbonization of shipping.
The Japanese yards have a very strict hierarchy as well specialization, and any questions asked they had to be answered exclusively by those who knew: the persons in charge! Everyone, in Japanese yards, focused exclusively on his/her job.
Japanese were aware that the Greek-owned shipping companies were family-ones, and that the interpersonal relationships with the ship-owner mattered. They had/have the slogan: “Tradition & Innovation”! Their yards were, par excellence, customer-oriented, of course within the proper limits. They negotiated hard in order to accept, if convinced, and not in order to reject!
Many believe that only the special and very sophisticated ships, (e.g., ships using as twin fuels ammonia and hydrogen), are perhaps left for Japan, in 2023 and thereafter. But they forget, of course, the sales of spare part to the owners of the thousand ships they have built! Japan in 2007 collected about $2.5b from exporting marine equipment! Also they forget section V, which showed that the Greek ship-owners’ ordered ships in Japan in 2001-2022!
The Greeks are indeed fond of the bulk carriers and the tankers. Their preference for the Panamax, Supramax and Handy bulk carriers, and the Aframax and Medium range tankers, is, however, based on the fact that more cargoes are available for them! Last of all other ship-owners, Greeks turned also to LNGs, despite my suggestions years ago (before 2008).
The procedure in building ships in Japan nowadays is as follows: the ship’s specifications are decided, but after hard negotiations lasting even 7 whole days, and certain times at the offices of the customer, leading… to a number of changes. If a ship-owner wishes to find the old Japanese tradition now, where to discuss changes in the standard specifications, and in order for them to be accepted, he/she may better choose a family yard in Japan.
The Japanese ships are preferred for their excellent performance and quality, as well efficient, effective and lasting operations, provided they are built according to the Greek specifications! The good-quality ships of course live longer and need less to be spent in dry-docks. The Greek word “synergy” is understood well by the Japanese!
The S Korean shipbuilding owes its success in the following factors (Graph 6), we believe:
‘Chung Ju-Yung targeted at ships as large as VLCCs in 1972! The S Koreans
![]()
Source: author.
Graph 6. Factors which made S Korean shipbuilding successful since 1972.
![]()
Source: author’s archive.
Picture 5. A new building in S Korea, Feb. 2023: Quite impressive!
cleverly based their endeavor on building ships with the aid of consultants etc., who used to do the same job before. The Greeks who never arrive first at something new, but they want to watch others to burn their fingers, ordered ships in S Korea at the pace of 1.7 ships p.a. (1974-1992). When S Korea gained the trust of the Greek ship-owners, 60.2 ships ordered there p.a. (2002-2022), and latter 80 ships p.a. (2009-2013), and in total ~1837 (like the one in Picture 5)!
NOTES
1One VLCC, very large crude carrier, could be built in 3 months! The Japanese built 3 ships per day in 1974!
2EU building ships (in 1976) consisted from: Belgium, Denmark, Finland, France, Germany, Greece, Ireland, Italy, Netherlands, Portugal, Spain, Sweden & UK. These 13 countries used to build ~6 m CGT in 1976, falling down to 3.6 m by 2003, and to 9 countries...
336% in “Maritime Policy & Management”, 22% in “Maritime economics & Logistics”, 9% in “Transportation Research” (part E) & ~8% in the Int. Journal of “shipping & tranport logistics” (=75%).
4The better working conditions had to be expected, for the Greek crew, at least, after the “luxuries” provided by the Liberties!
5One Greek ship-owner asked for his ships to have a library…
6The 1st Freedom was defective having a low speed, consuming excessive quantity of lubricants & producing weak engine room ventilation!
7Worth noting is that the price of a vessel, newly built, covers up to 51% of her total cost!
8“Naftika Chronica” journal, 2022 (special edition).
9These statistics undervalued the Japanese “maritime cluster” by including a dominant “wholesales & retail” sector providing 5.1b Yen (~41%)!
10Japan knew that and delayed delivery by 12 months, but this is not adequate when a crisis lasts 6 - 10 years!
11For a ship of 25,000 tons; building ships by blocks meant to build all ship’s parts at the same time. The weight of each block depended on the power of the cranes etc. to lift it up and transport it to the erection place. S Koreans e.g., can lift items of up to 450t and transport them by “heavy transporters” and/or cranes.
12In the abstract we mentioned 4,709 vessels. This happens if one adds only the ships sized over 1000 GT or over 100 GT.
13During the exceptional boom in 2003-2008, this new building time of less then 4 months is “exceptionally” positive!
14Japan, in 1995, could not easily find staff for their shipyards and recruited people from S E Asia…
15China was “responsible” for the last exceptional boom (2003-2008) & partly for the depression (2009-18), given also the pandemic (2019-23). The boom was due to China’s fast past growth rates of round 7%-8% p.a., and the fact that it lacks enough oil, iron ore, gas and coal (to a smaller degree), where some of these carried by Capes. Panamax also used to carry grain. So, shipping depends from then-on on the China’s, mainly, and India’s, secondarily, imports. Of parallel importance are also the containerships, which carry the means of the economic development, and which hurt by Covid-19 (2019-21).
16Unnecessary funds are embodied in materials till to be used. Some of them, in the meantime, are wasted, stolen, damaged, lost, and rusted! Engineers order usually twice of what they are going to need to be on the safe side! The Japanese placed a card on each item and when the last one used, the “card” ordered the next one, which, however, had to arrive just in time. The stocks which become useless sometimes are not shown in the balance sheets in their real quantity and value, like the loans which the banks show as claims, but all know they will never be paid…
17The S Koreans distinguished their yards’ 24 years as follows: 1) establishment: 1974-78 (5 years); 2) take-off: 1979-83 (5 years); 3) growth: 1984-89 (6 years); 4) maturity: 1990-1997 (8 years).
18Its first step made in 1937 with the establishment of the “Korean Shipbuilding & Engineering Corporation”, which used to build ships maximum 25,000 dwt, mainly for domestic owners (1970-80).
19“Economies of scale” is a simple, but dangerous, economic concept, understandable by even empirical ship-owners like Onassis.
20The shipping companies located in Greece are not all necessarily owned by Greeks, like e.g., Cosco.
21The S. Korea in order to meet the rapid demand for skilled manpower established also a training center, in Sept. 1972, for 1000 students.
22The 1st ship delivered was the VLCC “Atlantic Baron”, 267,801 dwt, to Sun Enterprises (1974).