Earth-Moon Barycentre Excursions and Anomalous Quaternary Sea Level Highstands ()
1. Introduction
There are very few studies that relate the Moon and the geology of the Earth. Keeling & Whorf [1] associate a 1800-year tidal cycle with gradually shifting lunar declination supported by findings from sedimentary records of ice-rafting debris. They propose that strong tidal forcing causes cooling at the sea surface by increasing vertical mixing in the oceans.
1.1. Previous Canary Data Used
Some time ago, the first studies of the Quaternary marine deposits focused on the presence of a faunal group within them, the so-called Senegalese fauna, especially its most striking representative Strombus bubonius (now Persististrombus latus). But, the existence of other much older Strombus from the Early Pliocene has misled some studies. This confusion was confirmed with the first K/Ar ages [2] [3] and 40Ar/39Ar ages [4] [5] of associated lavas and with the study of these fossils, and consequently the deposits that contained them, confirming that they were not Quaternary. Subsequently, attention was focused on the list of other elements of the Quaternary fauna, confirming the mix of cold and warm faunas and dating corals by Uranium-series [6]. Finally, the mean sea surface temperature (SST) was calculated by remote sensing, comparison of extant and fossil habitats [2] [7], analysis of oxygen isotopes [8] [9] and alkenone SST from core ODP 658C [10]. Most of the mentioned publications, which are not exhaustive, have a detailed description of the multiple and comprehensive methodologies used.
1.2. The Aim of This Work
Very recently, it has been proposed [11] that force imbalances in the Earth-Moon-Sun system cause 1) plate tectonics and intervene, 2) in the mechanism of radial monthly excursions of the Earth-Moon barycentre inside the Earth’s mantle. Furthermore, the lunar inclination also varies, 3) moving the internal barycentre location vertically. Our study combines the relationship between marine and terrestrial deposits of the Canary Islands with 1) plate tectonics, 2) the excursions of the barycentre, and 3) the variation of the Moon’s inclination, on the scale of millions, thousands and hundreds of years respectively.
2. Geological Setting
2.1. Situation with Respect to Global Models
Geologically, Lanzarote and Fuerteventura are the oldest volcanic Canary Islands and the closest to the African coast. They can be considered a single block ( [12]: p. 485), especially the centre of Fuerteventura and its extension in the south of Lanzarote, separated by a shallow strait. The Canary Islands are located on the African lithospheric plate (Figure 1). This plate spreads on both sides of the equator ( [13]: Figure 1) and has always been free from ice weight during the Neogene. The Canaries are also far from any subduction zone that could produce uplifts on their coasts. Moreover, this eastern zone is in a far-field region in the model of Glacial Isostatic Adjustment (GIA) processes [14] [15] or effects of weight change by fusion of the distant Fenoscandian and Laurentian ice sheets, where the coasts would be subjected to Holocene uplift ( [16]: Figure 6). The remoteness in time and space to the ice-sheets is favourable in making tectonic stability visible. The proto-island of Fuerteventura-Lanzarote, near Africa, is in an area lacking subsidence [12] and partially or totally above the African craton [17]. Geographically, this proto-island is located in the midst of the Canary Current meeting with the African coast upwellings [9]. Finally, the Canary Islands are
![]()
Figure 1. The lines are projections used to display the excursion of the barycenter in the lower mantle and reflect the astronomical situation between the Earth and the Moon. The Holocene line is roughly parallel to the MIS11 one while the MIS 5e one is tilted with respect to the others.
close to the tropics (at ~ 27.5˚N and ~ 29˚N), in the 20˚N - 30˚N insolation zone ( [6]: Figure 15). These features make the easternmost Canary Islands (Figure 2(a)) a singular observatory of local (relative) and global (eustatic) sea level.
![]()
Figure 2. Global sea-level and tectonic stability from dated lava flows of the Canary Islands. (a) Significant localities of western Canaries with tectonic stability (squares) and anomalous places (circles). (b) Marine deposits containing identical Pliocene littoral fossils.
On the other hand, the Canarian dated lavas help to understand the degree of tectonic stability of these islands (Figure 2(b)) and, as a consequence, the global sea level at the beginning of the Pliocene, and its participation in the largest climatic events.
2.2. Degree of the Tectonic Stability of the Lanzarote Island
There are hardly any data to quantify the tectonic stability of the Canary Islands during the Quaternary. The only uplifts detected are those in the Late Miocene and Early Pliocene deposits, which we have used to calculate the maximum Quaternary uplift rate.
These Canarian late Miocene marine deposits correspond to an old intertidal zone and are directly covered by lava flow on the western coast of Lanzarote, in Janubio. The lava has an age of ca 9.6 My, using 40Ar/39Ar dating, and the height of the deposits is ca 36 m above sea level (ASL) [5]. As the sea level was close to the present level during the formation of Miocene marine deposits [18], we can consider them coincident, with an approximate rate of 3.75 m∙My−1 [5]. In the case of the Upper Pleistocene (starting about 130 ky ago), the deposits have a height of a few centimetres (<5 cm) and for the upper Holocene (the last 5 ky) a few millimetres (<4 mm). As a consequence, we calculate the global mean sea level during the early Pliocene as follows.
2.3. Global Sea Level at Early Pliocene
Considering 70 m of early Pliocene marine deposits measured in Ajaches, Lanzarote [5] and subtracting the approximately 40 m of the tectonic uplift from Tortonian to present, we obtain about 30 m of early Pliocene relative sea level. This result coincides with the global eustatic mean sea level from ca 5 My ago calculated at 28.4 ± 11.7 m ASL [15] (Figure 2(b)).
2.4. Tectonic Stability of Gran Canaria Island
In the north of the island of Gran Canaria intertidal marine deposits from the early Pliocene were dated using 40Ar/39Ar at ca 4.8 My and 4.2 My. These deposits have heights of 97 and 24 m ASL respectively [4], revealing an early Pliocene tectonic activity simultaneous with a global sea level drop [18], but also a late Pliocene to present day uplift rate of 5.71 m∙My−1. For this reason, we broadly consider both Lanzarote and Gran Canaria tectonically stable during the final Quaternary or last half a million years.
2.5. Tectonic Stability of Central Fuerteventura Island
Lastly, on the west coast of the central part of Fuerteventura, the maximum height of the deposits is 30.35 m in Puerto de La Cruz, 36.6 m in La Solapa and 28.0 m in Chilegua. These marine deposits extend parallel to the current coast for more than 50 km and their K/Ar ages are about 4.8 My [4]. If we compare this data to the value from the global mean sea level [15], they show a total stability of central Fuerteventura from the lower Pliocene to the present. This data has allowed us to quantify the influence of local tectonics in the interglacials that occurred during the last half a million years. An uplift of 2.52 m would correspond to the marine deposits of MIS 11, 0.42 My ago, which are at 30 - 35 m ASL in the north of Gran Canaria and 0.72 m for those of MIS 5e, 0.12 My ago, which are 12 m ASL from Las Palmas de Gran Canaria. However, the Holocene marine deposits of central Fuerteventura have not been affected by any local tectonics.
3. Canarian Evidence of the Imbalanced Earth-Moon-Sun System
3.1. Consequences of Plate Tectonics
Astronomical Connection: A Certainty
The ages of the lavas intercalated between the sedimentary deposits (Figure 3(a)) have allowed us to reconstruct the geological history of huge areas of this part of the Earth and relate it with the closure of Panama, consequently with Moon effects. The Canary Islands conform to a geological example of Hofmeister et al.’s [11] mechanism (Figure 3) as has already been described in previous works [4] [19] [20].
3.2. Consequences in the Pleistocene of Barycentre Excursions
If there were any sign or consequence of the past barycentre excursions (Figure 4) in the marine environment, it would be anomalous, controversial or unexplained sea-level, but with a quiet character, not violent, and without eustatic origin. Nevertheless, the consequences of these excursions could only be visible in the interglacial, when the sea level was higher than the current one.
The Quaternary history of sea level above that of the present day is discontinuous in time and space. It requires reference to a stable place, from the age of the marine shoreline remains and the measurement of its maximum height with respect to present and relevant past average levels. The fact that these local circumstances have global value at the same time is very rare. Studies on the Canary Islands have highlighted that the maximum heights reached by some of the deposits coincides with the presence of cold fauna [6].
3.2.1. The Warmest Mid-Pleistocene Interglacial or MIS 11
1) Global data, the controversy
The palaeoclimatic context of MIS 11 is well known with few known tectonically stable places with marine deposits of MIS 11 in the world. A few years ago, some researchers ( [21]: Figure 1) pointed to only three, the Bahamas, Bermuda and South Africa. However, we consider that a hypothesized MIS 11 high-sea stand in the Bahamas [22] needs further study, because the authors’ interpretation does not contain corals or molluscs in the study of the beach deposits, only peloids and ooids. Such remains are also dominant in aeolian deposits on the Bahamas [23], in South Africa [24] and in another location of Curaçao [25], which makes the standardisation of the data for a global study impossible.
![]()
Figure 3. Global events after Panama Seaway closure trapped by dated lavas flow from Canary Islands. (a) Lavas’ radiometric ages intercalated between marine and terrestrial deposits. (b) Marine and eolic fossil deposits related to the Mio-Pliocene cooling. Plate tectonic action is due to the Earth Moon barycenter.
![]()
Figure 4. Forces on Earth-Moon barycenter after Hofmeister et al. [11]. Earth-Moon barycenter position changes with distance and inclination. Horizontal and vertical forces within the lower mantle of the Earth.
Estimates of sea level height during MIS 11, ~ 420 ± 30 ky ago, obtained in the Bahamas and Bermuda have been 20 ± 3 m ASL [22] and 21 m ASL [26] respectively, with marine remains attributed to both a giant megatsunami [27] and tectonic elevations during a sea level stand similar to the current one [28]. In South Africa the observed height of marine deposits of ~390 ky ago is 14 m ASL [24], using the contact between the shoreface and the foreshore or intertidal zone as a sea level indicator. Although South Africa’s far-field south coast experienced low GIA ( [24]; see also Figure 5(a), [15]) and is tectonically stable, it requires a precisely measured MIS 11 sea level to 13 m ± 2 m ASL (corrected for tectonic uplift and GIA). This figure approximates to that previously deduced for the Bahamas and Bermuda, using a GIA model produced by the disappearance of ice on the North American ice sheets, with a theoretical result of ~6 m to 13 m ASL during the second half of MIS 11 [29]. The ~400 ka evidence (MIS 11) on Curaçao may have formed from a palaeo-sea level of +8.3 to +10.0 m, or (less likely) +17 m to +20 m [25] (Figure 5(a)).
We can register the latitudes in the Atlantic Ocean of Bermuda and the Bahamas in the west Atlantic, and the Canary Islands in its eastern extreme, all of them at around 30˚N; this is similar to South Africa, although in the southern hemisphere, located around 30˚S (Figure 1).
2) Records in the Canary Islands
a) Pillow lavas and hyaloclastites
In the Canary Islands, the MIS 11 marine deposits (Figure 6) have an indisputable calm origin, due to the presence of pillow lavas [2] [6], hyaloclastites and sands with fossils arranged in parallel layers. These deposits are in the Arucas coast, in the centre of the north coast of Gran Canaria. The K/Ar age of a cooled pillow lava in contact with seawater in the locality of Gran Canaria [2] places these marine deposits in MIS 11, ca 421 ± 20 ky.
b) Sea surface temperature
On the other hand, the presence in the deposits of Saccostreacucullata allows a comparison with its present habitat in the Gulf of Guinea. Thus, the compared SSTs in waters around the Canary Islands were at least 4.2˚C higher during MIS 11 than today. Middle Pleistocene fossils of S. cucullata have also been found in
![]()
Figure 5. Anomalous sea-levels in Pleistocene interglacials. (a) MIS11 and (b) MIS 5e sea level highstands. Sea level peaks above present global level and the highest marine deposits in the Canary Islands and those in the opposite hemisphere (after Barlow et al. [40] and Hearty et al. [35]).
the western Mediterranean Sea and Morocco, as well as the Cape Verde Islands, and MIS 11 SST warming could have been a regional phenomenon, including much of the eastern Atlantic Ocean and Mediterranean Sea [30]. However, these results are not corroborated by the isotopic temperatures; according to published isotopic fractionation equations, the marine deposits from Arucas (northern part of the island of Gran Canaria) have on average SSTs of 15.9 ± 2.2˚C [8]. The current SST recorded by remote sensing on the east coast of Fuerteventura is 21.23˚C [7], but for the Arucas deposits is extraordinarily low for being outside the influence of the upwelling, ca 5˚C lower than the Fuerteventura value.
c) Lack of tsunami features
The Bermuda deposits have been attributed to a large tsunami that occurred during the Middle Pleistocene and they would have been due to the collapse of a volcano flank on an Atlantic island [27], such as the submarine landslides of Julan
![]()
Figure 6. Passive character of the highest anomalous MIS 11 deposits at the Arucas coast (Gran Canaria). (a) Heights and (b) synchronous lavas. The pilowed lava (c) and the laminated sands (d) show a quiet origin.
or La Orotava in the Canary Islands, or because of a giant underwater landslide on the Atlantic continental margin. Nevertheless, the giant underwater landslides mentioned have turned out to be of other ages, such as during interglacial MIS 13 [31]. The deposits considered here as anomalous have a quiet character without trace of abrupt origin, such as the mixture of marine fossils with terrestrial and autochthonous marine fossils of different depths, by the angularity of the fragments and volcanic fragments with crusts and pothole erosion surfaces.
3.2.2. The Last Interglacial or MIS 5e
1) Global data
The marine deposits of the last interglacial have a relatively wide global distribution [32] [33] [21] [34]. Hearty et al. [35] distinguish several intervals that exceed the current sea level from before 130 ky. From 125 to 130 ky the sea level maintained a height between 2 and 3 m ASL during which terraces were formed. A descent to zero meters or less followed at 125 ky and, finally, a second elevation to 3 - 4 m ASL between 124 and 122 ky. Towards 120 ky there is a rapid rise from 6 to 9 m ASL (Figure 5(b)), confirmed by notches and banks.
So, it is possible to consider Start MIS 5e [33] and End MIS 5e ages. The high sea level during the End MIS 5e has been attributed to frequent superstorms of intensity never seen today [36], which would explain the Bahamas and Bermuda records. Unfortunately, the existence of this special intensity was subsequently denied [37], but the sea level rise during the End MIS 5e has been repeated in Western Australia [38]. To explain this paradoxical sudden rise in sea level when SST falls sharply and ice is accumulating at the poles, complex and complicated models have been created with the formation of superstorms as one of their consequences [36] [39], or the sudden and catastrophic collapse of ice sheets [38]. However, other researchers [40] find no evidence, for ice-sheet regrowth within the warm interglacial climate.
Above and beyond, in the antipodes of the Canary Islands, relatively close to 30˚S in the Yorke Peninsula, southern Australia, the maximum elevation of the sea level of the last interglacial (MIS 5e) reached 4.8 ± 1.0 m ASL [41] with Uranium-series ages between 127.3 ± 2.1 ky and 115.0 ± 5.4 ky, corresponding to “only one highstand (rather than multiple highstands)”. The Yorke Peninsula is located on the eastern margin of the tectonically stable Gawler Craton and in one of the world’s geographically most remote far-field locations from the ice-sheets.
In western Australia, O’Leary et al. [38] show that between 127 and 119 kyr ago eustatic sea level remained relatively stable at about 3 - 4 m above present sea level, but stratigraphically younger fossil corals with U-series ages of 118.1 ± 1.4 kyr are observed at elevations of up to 9.5 m above present mean sea level; accounting for GIA and localized tectonics, the eustatic sea level rose to about 9 m above present at the end of the last interglacial. These authors suggest that in the last few thousand years of the interglacial a critical ice sheet stability threshold was overstepped, resulting in the catastrophic collapse of polar ice sheets and substantial sea-level rise.
On the other hand, the numerical models conceived by Creveling’s research group [33] consider that the highstand markers or the eustatic sea level peaks, and its equivalent the minimum volume of continental ice, contain possible large errors due to tectonic displacements. This is because the method followed, consisting of calculating the uplift or subsidence rate at one site, assuming it constant and applying it to another site, introduces possible large errors (for details [33]). GIA numerical models for the last interglacial quantify errors between 2 - 4 m or more, even in far-field locations from the ice-sheets. This does not seem to be absolutely true and so in certain places (for example on Bermuda [23] with ages by Uranium-series on coral between 126 and 114 ky) there is a poor agreement with GIA model simulations for the last interglacial.
A global compilation of U-series-dated fossil coral ( [34]: Figure 1 and Table 1) shows a clear grouping of sites in the latitudes of both tropics, differentiating according to regional tectonics in subsiding sites (5), uplifting sites (18) and stable sites (22). The stable sites are concentrated in the south-eastern North American islands, between Yucatan and Bermuda, in the Red Sea and in Australia. The uplifted sites are mainly concentrated in the California Sea, Indonesia and islands in the northeast of Australia. Finally, the few subsiding sites are dispersed without apparent relationship. Although, there are numerous data on the relative sea level (RSL) of the Mediterranean region, they are far from satisfactory [42] and this prevents us from using them for our purpose.
2) Records in the Canary Islands
a) Uranium-series ages
In La Guirra, a town on the central east coast of Fuerteventura, the marine deposits of the last interglacial have been dated by Uranium-series (not on coral) at 124.3 ± 3.2 and 118 ± 6.2 ky [43] and its topographic height is 5.36 m ASL [7], very close to that obtained (~4.8 m ASL) in its antipodes in the Yorke Peninsula in South Australia [41].
In other parts of the Canary Islands there is no record of tectonic stability. These areas are found at the same height of ~5 m ASL (e.g., in north Gran Canaria at El Altillo and Juan Grande in the southeast), but also at other heights. In Las Palmas (Figure 7) the maximum transgressive is 12 m ASL [2] and in the north of Lanzarote it is at 9 m ASL.
The coral ages by Uranium-series in the north of Lanzarote (La Santa) (8 - 9 m ASL; 130.2 ± 0.8 ky) and Las Palmas (12 m ASL; 120.5 ± 0.8 ky) [6] would indicate the beginning (Start MIS 5e) and the end (End MIS 5e) of MIS 5e, if they could be interpreted with exact measurements. Nevertheless, there is no evidence of the existence of more than one highstand and at some key points, such as in Las Palmas (12 m ASL), there are examples of a single powerful highstand without any hint of storm ( [2]: Figure 5) meaning a relatively durable highstand.
b) Sea surface temperature
Another very notable feature is the presence of a well-represented fauna, known as “Senegalese” because its components currently inhabit the entire Gulf of Guinea [2] [30] [6]. Temperature estimates have been obtained by comparing both fossil and extant habitats using tele-temperatures with a result of 3.3˚C more than today [30], but the results are of 20.4˚C ± 1.3˚C and 22.2˚C ± 1.3˚C [9] if d18O isotopes are analysed. As the present mean temperature on Fuerteventura is 21.23˚C [7], both present tele-temperature and isotopic data fully agree in their highest values. Therefore, it is the same SST at 12 m height.
3.2.3. Anomalies
In summary, the anomalies detected are present and similar in both interglacials studied, from which a common cause is inferred. In the case of Arucas, MIS 11 marine deposits are at 30 to 35 m ASL and with a 421 ky K/Ar age. We believe its
![]()
Figure 7. Passive character of the highest anomalous MIS 5e deposits at Las Palmas coast (Gran Canaria). (a) Representative section of Las Palmas de Gran Canaria MIS 5e deposits. (b) Las Palmas deposits of quiet origin, and no superstorm nor current storm.
ASL height is anomalous [2] as it exceeds by at least 10 m the maximum heights reached in the other worldwide deposits attributed to MIS 11. It is also important to highlight the presence of North Atlantic mollusc species [6] and the low isotopic temperature detected, about 5 ºC below the current SST [8].
The MIS 5e deposits of Las Palmas de Gran Canaria with a Uranium-series age of 120 ky are ones of the highest in world at 12 m ASL, being at least 2 m higher than the tallest ones, and with quiet origin. The arrival of the cold fauna [6] from the north to the Canary Islands is also anomalous, although the isotopic SSTs are higher than the current ones as they correspond to the last interglacial [9].
3.2.4. Astronomical Connection: A Hypothesis
We point out that there are marine deposits in the Canary Islands and in their antipodes at heights that are the expected for interglacial 5e deposits (between 5 and 6 m ASL), but both with anomalous heights as well. There are also anomalous heights at mid-Atlantic latitudes in both hemispheres for MIS 11. If we join the points of those anomalous heights on a map, we obtain what would be a possible reflection of an accumulated response of the Earth to a periodic excursion of the barycentre into the lower mantle [11] (Figure 1 and Figure 4). This line is perpendicular to the direction of plate movement from Europe and Africa to Australia (http://sideshow.jpl.nasa.gov/mbh/series.html). This allows us to find out the inclination of the Earth’s axis with respect to the ecliptic, know the astronomical similarity between interglacials MIS 11 and MIS 5e and to compare them with the Holocene and present situation.
4. Consequences of the Variation in Lunar Inclination (and Declination)
4.1. The Holocene
4.1.1. Global Data
There have been various attempts to obtain a global curve of Holocene variations of sea level. This task has had numerous obstacles attributed to the diversity of geological evidence and the means applied in their study [17] [44] having dissimilar results.
A double wave behaviour of sea level (Figure 8), with very similar values to the Canary Islands, is also found on the Mauritanian coast [45] and in Southern Africa ( [46]: Figure 2) and, in general, more modified in the Indo-Pacific ( [44]: Figure 7), where the double waveform and latitude would be more interesting than the heights and ages.
Although in the isostatic model of response to ice melting Atlantic Morocco and Senegal have been considered regions where late Holocene marine deposits (between 2.5 and 5 ky) have suffered uplift and tilting ( [16]: Figure 6) rather than a eustatic fall of sea level, the double wave behaviour of these deposits [7] is incompatible with this.
The numerical model considers that there is a deformation in the Earth’s surface
![]()
Figure 8. The Holocene imprint of the barycenter in Fuerteventura. (a) Holocene sea level peaks above present level. (b1) El Matorral, more than 80 m wide, is the largest beachrock in the world and is made up of more than 70 steps one per year. (b2) Detail of (b1). (b3) Conventional and calibrated ages from the beachrock at La Monja (left) and La Jaqueta (right).
and in its geoid due to the change in the supported weight because of ice melting. Thus, the sea level rises in some areas and falls in others. The latter would refer to the far-field areas of the ice-sheet regions which should not vary significantly the mass redistribution (deformation) of the barycentre excursion or the gravitational pull of the Moon. However, the opposite might hold true, too.
There have been scientific studies that linked events in the Holocene climate to cycles of hitherto unidentified causes [47] [48] [49], but none were directly applicable to the Canarian anomalous sea level highstands. However, Keeling and Whorf [1] are very close to our hypothesis.
4.1.2. Records in the Canary Islands
Fuerteventura is considered a far-field region tectonically stable and immune to ocean syphoning. At the La Jaqueta, El Matorral and La Monja sites (Figure 8) there is evidence of what we will call a double wave. This is composed of (a) the last sea level highstand above present mean sea level; (b) sea level fall to present sea level zero m or below zero; and (another ‘a’) the penultimate sea level highstand. The wave inflection between the two heights cannot be described by isostatic reasons.
1) Calibrated radiocarbon ages
The last sea level rise in Fuerteventura was 3.5 m ASL ~1450 years B.P. (1423 - 1476), median probability calculated from calibrated radiocarbon ages [7]. The previous sea level fall to 0 m or less occurred at ~2900 - 3000 years ago and the penultimate sea level highstand of ~4 m ASL took place ~ 4067 - 4909 years ago [7]. That is, a double wave (M-shaped) with a wavelength or period of ~3000 (2500) years and an amplitude of ~3 to 4 m ASL.
2) Sea surface temperature
Finally, the marine deposits of the end of the Holocene are higher (3.5 m ASL with a 14C-age calibration of ca 1450 yr) than the present ones when the SST temperature was lower than at present (an obvious anomaly that eliminates the previous ice melting as the cause). The present SST in ODP658C point allows a comparison with the Holocene SSTs [11] and they show that the RSL highstands on Fuerteventura and Mauritania happened at lower SST than at present [7]. Additionally, between two nearby highstands there is a drop in sea level that eliminates the cause as being the GIA. If the coast were progressively rising, sea level cannot go down as this would not represent a progressive rise or GIA. So, between both highstands the sea level was equal or lower than the present one about 3000 years ago.
3) Hint of astronomical origin
We believe Fuerteventura’s beach-rocks [7], of those described until now, are the most notable in the world. Their relationship to the tides is evident and the number of steps that form them, about seventy progressively farther from land, suggests a retreating sea and an Earth that moves in its changing orbit around the Sun for as many years as steps. It appears to be the trail of an orbital degree travelling (~72 years, exactly 71.548 years) along the axis of the Earth in its movement of precession of the Equinoxes [7]. But these beach-rocks and other tropical ones [3] [46] are not formed in any year. Their formation coincides with stable circumstances. In this regard, we observe that the formation of these beach-rocks (in the lowest part of the beach and its corresponding deposits in the highest part) took place every ~ 3000 years (actually ~2600 - 2700 according to radiocarbon ages and according to the starting year of the starting point), with an uplift ridge (3 - 4 m ASL at 30º latitudes) and a fall groove (at <0 m). This phenomenon is visible during approximately the last 6000 years in which the volume of ice on Earth is considered to have been constant [50] and seems to strongly indicate an unrecorded periodic variation in the Earth-Moon relationship at this time scale.
4.2. Astronomical Connection. A Proposed Mechanism
For half a million years the sea level has been above the present level only three times coinciding with the end of the last three interglacials [51]. In all three, anomalous sea level rises have occurred that have given place to controversial explanations [29], from tsunamis [27] and super storms [36] [39] to unexpected collapses of the polar ice [22] [38]. Nevertheless, as we argue below, part of the marine deposits of the last three interglacials in the Canary Islands [2] could be a consequence of the oscillatory movements of the Moon along the ecliptic (which is the barycentre ecliptic around the Sun) due to barycentre excursions within the Earth (or rather Earth excursions around the barycentre), and due to the not rigid-body condition of the planet (i.e. its materials undergo plastic, elastic and viscoelastic deformations, as well as fractures, brittle and ductile, and liquid and gas movements), while the Moon can be considered a rigid body in this approximation.
4.2.1. Tidal Bulge Displacement
If the tidal bulge, representing the attraction of the Moon on Earth ( [47]: Figure 1) in the form of an ellipse, were displaced with a similar periodicity, the tropical, subtropical and inter-tropical or equatorial zones would hardly undergo variation (Figure 9). Then, what do these oscillations depend on? They depend on the Lunar declination of the angle between the axis of the Earth and the inclination of the Moon with respect to the ecliptic (angle α in Figure 9(a)).
By direct geometric observation on the chart (Figure 9), the tidal bulge moves north when the precession angle is at a maximum and the angle between the Moon’s orbit and the ecliptic is at a minimum. This produces a sea level rise in these middle latitude regions. Conversely, when the precession angle is at a minimum and the angle between the Moon’s orbit and the ecliptic is at a maximum, the tidal bulge moves south and the sea level falls in tropical regions (Figure 9). The angle between the Moon’s orbit and the ecliptic (inclination with respect to the ecliptic) currently varies between 4˚58' (4.967˚) and 5˚19' (5.3167˚), but greater oscillations were possible in the past about the ecliptic [11].
4.2.2. Length of Day (Lod)
On the other hand, the days lengthen as the Moon moves away from Earth [52]. If the length of the day (lod) over a few years is constant (Figure 9(b)), it seems to be because the Earth-Moon distance remains constant. This would only occur if there is an inflection or change in the axis of the Earth or the Moon. That is, if its trajectory forms an angle, or a point of inflection, or a change in its trajectory, these positions are almost equidistant from the Moon when they are very close and with slightly different and successive trajectory. The latest fluctuations were recorded by the Chinese emperors’ astronomers [53] and the date of the last fluctuation exactly matches the last sea level rise recorded in Fuerteventura [7] (Figure 8).
![]()
Figure 9. Length of day proves the Moon intervention through the lunar inclination. (a) Changes in the Moon’s inclination (α) affect the angle β with the ecliptic and produce displacements of the tidal bulge. volumes of water that move in tropical zones produce apparent rises and falls of the sea level, (b) coincidence of Holocene sea level variations with the inflection points on the lod chart.
4.2.3. The Harmonic Distortion at the Earth Surface System
Finally, in Hofmeister et al.’s [11] mechanism the barycentre excursion in the lower Earth’s mantle obeys two forces: one horizontal, because the Moon’s orbit around the barycentre is not circular but quite elliptical, and another vertical, due to lunar inclination (Figure 4). Over the lunar month the distance between the Earth-Moon and the inclination of the Moon vector to the barycentre orbital plane both vary. The corresponding inner forces are resisted by the lithosphere and crust layer, but the remaining forces do affect waters over the oceanic crust. The latter are elastic and free to move. The sea level varies with the lunar gravity pull (as the inverse of the relative distance squared) and the inclination. There are many other factors involved in sea level variation rate including ocean seiches-like oscillations or slosh due to the existence of some ocean “boundaries” in polar direction, and atmospheric phenomena (most likely not involved at this time scale, as discussed earlier). Consequently, there are two theoretical components of the forcing mechanism observed on the Earth’s surface represented by the interplay of two sinusoidal curves: one according to the declination and another according to the barycentre (Figure 10(b)). As we will see the response of the Earth’s surface system to the fundamental oscillation of the Moon is
![]()
Figure 10. Mechanism that causes tropical sea level changes and maximum lunar declination. (a) Orbit of the barycenter (after Hofmeister et al. [2]). (b) Holocene Moon’s behaviour. A broader superposition wave of declination coincides with the sea level elevations in the tropics. Curves legend on the image.
apparently concentrated (in terms of energy involved) in two components: fundamental frequency and third harmonic. This harmonic distortion is responsible for the rise and drop phases of the Tropical Sea Level changes and a resulting curve is produced (“superposition wave” in Figure 10(b)). There is no other significant contribution to these changes in terms of energy components (see Suppl. Material 5), such as the (minor) influence of other planets on the barycentre. We observe a certain coincidence of the variations in sea level with the Bond events, hitherto of unknown origin. Bond events refer to the sudden deposition of materials by melting of displaced ice in the North Atlantic [49].
4.2.4. Mathematical Calculations
We have conducted a complete set of Fourier transforms for the double triangular wave formed by data observations (Figure 8(a)), tackling its unknown periodical nature. Some of them are presented in Suppl. Material 5. From the FFT spectrum in its absolute amplitude value, |FFT|, which once squared gives the energy distribution of the signal, we discard the continuous component at frequency X = 0, there are two major contributions that make up the observed data: one at a fundamental frequency of X = 0.33 (3 kyr) and another one at a third harmonic X = 0.99 (1 kyr). This is consistent, no matter the approach about periodicity or limited duration. Consequently, if the surface system is linear (LTI o LTV) at this age, we can prepare Figure 10, with the superposition wave of fundamental and third harmonic, and suggest that the observed data of Figure 8(a) can be a response of the Earth surface system (tidal bulge, oceanic water, Figure 9) to the apparent oscillation of the barycentre. This is due to imbalances in the Earth-Moon astronomical movement, although the precise mechanism explaining the ocean oscillation remains unknown.
5. Discussion
A hypothesis for Pleistocene anomalous marine deposits
We find it difficult to accept a conventional explanation in tectonics, GIA or fortuitous events for the anomalies detected in the marine Quaternary deposits of the Canary Islands. These anomalies, consisting of greater height of the marine deposits when the SST is lower, seem to be located in proximity to the tropics and have a periodic character (interglacial MIS 11, 5e and the Holocene) so, their cause would be periodic and at a global level. This would respond to an astronomical geometry (classical three body problem) related to the inclination of the Moon and the axis of the Earth, since both (declination) are responsible for the variations of the tidal bulge. We suggest that force imbalances in the Earth-Moon-Sun system could then explain periodic movements of oceanic water volumes to the tropics. These volumes of ocean water make it slowly and progressively cold or warm about every millennium and a half according to the Holocene marine deposits data. Their effects add to and subtract from those glacial and interglacial isotope stages. Observations in the Holocene, as a magnifying glass of the past, show the mechanism by which a variation in the excursion of the barycentre caused by an oscillatory change in the inclination of the Moon, periodically moves volumes of ocean water.
Pleistocene anomalous marine deposits show a relationship with their antipodes or with places in the opposite hemisphere that, when joined, reveal hypothetical excursions in the Earth mantle of the Earth-Moon barycentre. This would be reinforced by: 1) tracing on the plates that move the least, because 2) they are perpendicular to the displacements of the plates, and 3) one extreme of the trace-line is geographically related to the Holocene Bond Events in the North Atlantic, the only open ocean up to the North Pole (Figure 1). These possible excursions would reveal similarities between MIS 11 and the Holocene and a significant tilt of the Earth’s axis during MIS 5e.
A certainty about the Pliocene evolution of the North Atlantic after the closure of Panama Seaway
As the influence of the Moon is also responsible for plate tectonics, the Pliocene lavas of the Canary Islands make a perfect example to show the involvement of the largest events that affect the Earth surface such as the North Atlantic currents, ice volume, the desertification of North Africa and the seasonality of Southern Eurasia (Figure 3).
6. Conclusions
Our article is based on a new field of research, investigating the relationship between anomalous sites in the Earth and the Earth-Moon barycentre trajectory with their impact on Quaternary geology. This explains anomalous sea level changes during the Quaternary which have had a periodicity of about 1450 years during the Holocene.
Since plate tectonics and oscillations of oceanic waters are a consequence (at different time scales) of the presence of the Moon, the Moon has exerted its geological influence during the Quaternary and continues to do so today. We have made visible 1) the possibility of the Moon’s intervention in the formation of anomalous marine deposits of the interglacials MIS 11, MIS 5e and the Holocene, and 2) we have described the mechanism by which this is possible. This has had a periodicity of about 1450 years in the Holocene, after radiocarbon ages of the anomalous marine deposits of the Canary Islands-Mauritania and South Africa, and astronomical periods of constancy in the duration of the day, giving the maximum values of the Moon’s declination.
Data Availability Statement
The original contributions presented in the study are included in the article and the Supplementary Material, further inquiries can be directed to the corresponding author.
Author Contributions
JM designed the study, helped by CS an AL. All authors contributed to previous field work. Al and JM designed and draw the figures, CS and AL wrote the manuscript draft, AN did and interpretated the mathematical calculations and all contributed to the revision of the manuscript. Supplementary material was designed and done by AL, CS, A.N. and JM.
Funding
J. Meco, A. Lomoschitz and J.F. Betancort’s work benefitted from a research contract on paleoclimate proxies of the Canary Islands awarded by IU-ECOAQUA, Scientific & and Technological Marine Park of the University of Las Palmas de Gran Canaria, ULPGC. Their work was also benefited by the Ministry of Environment of the Government of Spain (CN-62/03-02139). The work of M.J. Huertas benefitted from the MINECO project CGL2017-86241-R and a grant as a member of UCM Research Group 910469.
Acknowledgments
We thank Richard S. Gross (Jet Propulsion Laboratory NASA) for comments about the Historic inflection point in the length-of-day curve, Richards D. Ray (NASA, Goddard Space Flight Center) for observations on the lack of information of any astronomical cycles in ca 3000 years’ frequency that could affect sea level, Mark Lewis (NHM, London) for help with editing, and Daniel R. Muhs (Geosciences and Environmental Change Science Center. U.S. Geological Survey) for observations in the geological part of the manuscript.
Supplementary Material
The supplementary Material for this article can be found online at:
https://doi.org/10.6084/m9.figshare.17085983 (supp. Material 1):
https://doi.org/10.6084/m9.figshare.17086028 (supp. Material 2):
https://doi.org/10.6084/m9.figshare.17086172 (supp. Material 3):
https://doi.org/10.6084/m9.figshare.17086199 (supp. Material 4):
Mathematical calculation by A. Nuñez (Supp. Material 5)
Mathematical Calculations, Fourier Analysis
The Earth-Moon-Sun system shows significant imbalances that evolve over time because of the Moon origin and initial torques applied. These imbalances amount to oscillations in the orbital, tilt, inclination and declination parameters of the Moon and Earth orbits around the barycentre or mass centre of the system, which falls within the geometry of the Earth. The resulting forces generate complex reactions of Earth materials in the inner layers, according to their solid/viscous composition, and in the lithosphere layer. Still, the crust is solid enough to resist to a high degree the inner forces, as they cause tectonic movements. But the main material over the oceanic crust, water, is liquid and undergoes major movement and displacement as is well known. We can consider the Earth surface system as a non-linear time varying system responding to input oscillations of centripetal forces operating from the barycentre over the Earth and Moon revolving around it. These input oscillations are related to the “periodical barycentre excursion”. The system response takes the form of a double wave signal with apparent period of 1500 yr. This deduction is reached after studying the recorded, mainly Holocene, samples from the Canary Islands and other places (see section 4.1). We conduct data analysis using Fourier transforms and assume several simplifications for the sake of clarity.
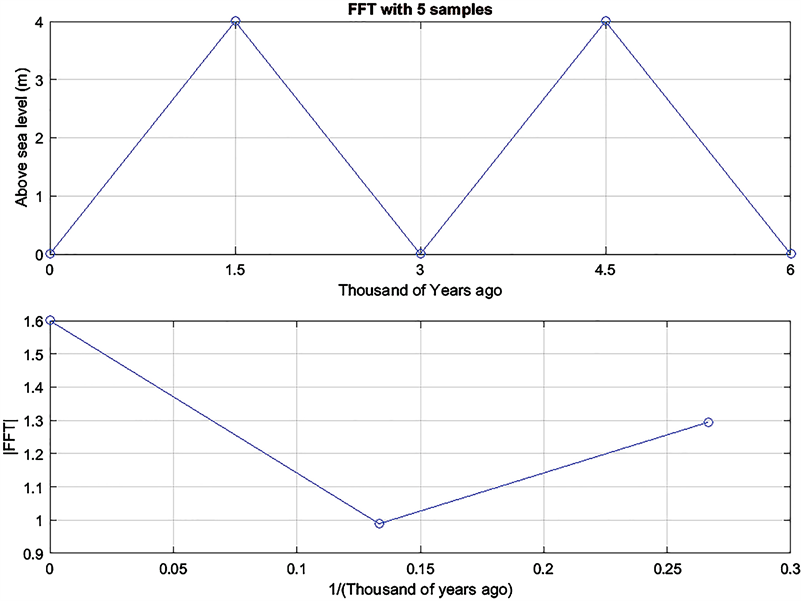
Firstly, we simplify the observations for a primary approximation by ignoring the small differences in the value of the height above present sea level. So, we take the observed 1500 yr height of 3.5 m as 4.0 m. The same is done for the observed 4500 yr, and take the data for present, 3000 yr and 6000 yr as 0 m (although they could oscillate around a small value below zero). Also, we do not consider the small time-variation (2700 - 2900 or 3000 yr) of that zero point and consider it as occurring at time 3000 yr. Since we are interested in a first approximation of spectral energy, these simplifications of the double peak waveform to the triangular wave are not significant.
Secondly, we need to consider the mathematical nature of this observational response or signal. Time-domain and frequency-domain can be used for the analysis of signals and systems. Although signals occur in the time-domain, the analysis in the frequency-domain is more efficient. The Fourier series is used to analyse continuous-time periodic signals (CTFS) in terms of an infinite number of harmonic related sinusoids, for a CTFS analysis. The Fourier transform analyses continuous-time aperiodic signals in terms of an infinite number of sinusoids with continuum of frequencies, for aperiodic CTFT analysis. The continuous-time Fourier transform of periodic signals or periodic CTFT is harder to compute, and usually it is derived from a CTFS analysis. The discrete-time Fourier series (DFS) analyses discrete periodic signals. The discrete-time Fourier transform (DFT) is used to analyse discrete aperiodic signals in terms of an infinite number of sinusoids with continuum of frequencies over a limited range. The DFT is Fourier analysis in finite and discrete form that decomposes a periodic extension of finite discrete signals in terms of a finite number of discrete sinusoids. This version can approximate all the other versions due to its finite and discrete nature, through fast numerical computation (FFT). We must be aware that they are approximations. In addition, FFT has the easiest and most significant physical interpretation. Again, the version accuracy depends on the characteristics of the signal, such as continuous or discrete, periodic or aperiodic. We might ignore the true nature of a signal if we focus on the spectral information, since CTFS spectra shapes are just samples of the CTFT spectrum and have the same “shape”. The DTFT spectrum is periodic, but not the CTFT spectrum. We can take one period of the finite version of DTFT and sample it in an N-point discrete-frequency sequence to obtain its DFT. If the discrete-time signal is really periodic with period N, the DFT provides an exact spectrum, then called discrete-time Fourier series DTFS, or simply DFS. CTFS, CTFT, DTFT, DFT/DFS and its fast computation algorithm FFT, are related and the spectral information can be interpreted and approximated easily.
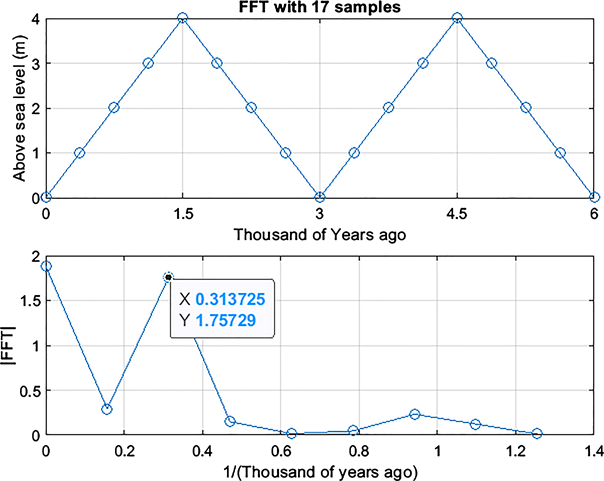
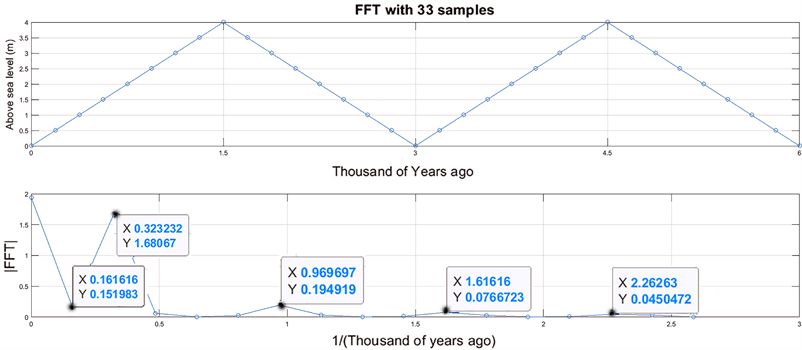
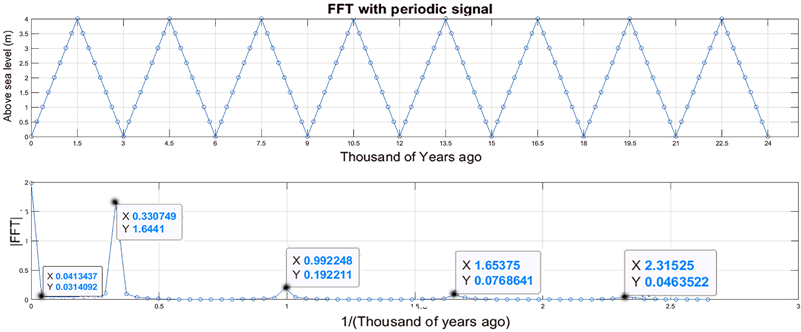
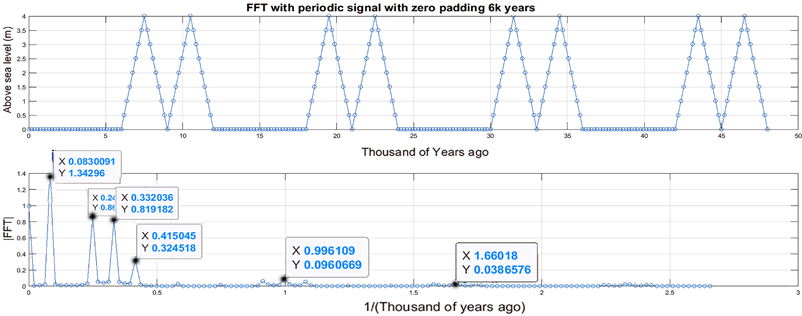
We have conducted a complete set of Fourier transforms for the double triangular wave formed by the simplified data observations, tackling its unknown periodical nature. Some of them are presented in this Suppl. material 5. We arrange the original observations as a discrete-time finite duration signal with only 5 observations. (a); present our hypothesis, for assessing consequences, a continuous-time finite duration signal as a sequence of 17 samples (b); as (b) using 33 samples (c); consider the signal as fully periodic (and potentially infinite in time, forever repeating) (d); consider the signal as a double wave time limited to 6 kyr and then using zero padding for another 6 k yr time-span, and then periodic (e); and consider the signal as a double wave time limited to 6 kyr and then periodic but using 120 kyr time-span, as suggested for MIS 5e (see section 3.2.2) (f).
From the FFT spectrum in its absolute amplitude value, |FFT|, which once squared gives the energy distribution of the signal, we discard the continuous component at X = 0. There are two major contributions that make up to the observed data: one at a fundamental frequency of X = 0.33 (3 kyr) and another one at a third harmonic X = 0.99 (1 kyr). This is consistent, no matter the approach about periodicity or limited duration.
As an additional analysis, now in the time domain, we consider taking the first derivative of the double triangular wave of the observations. This is a square wave with discontinuities at time points zero, 1.5 kyr, 3.0 kyr, 4.5 kyr, 6.0 kyr and so on, with duration intervals of 1.5 kyr, and period of 3.0 kyr. This implies that the trend in oceanic level at this time scale was constant (the time derivative or trend, not the level) in between those points, but alternating in sign (height going downwards, then upwards…etc.). If we take now the second derivative, a train of pulses is obtained, one pulse at each discontinuity with different sign and magnitude, which would trigger the change of the cycle every 1.5 kyr. These pulses could imply a long term (and long wavelength) interaction between ocean dynamics (accumulated tidal bulge movements forced by the barycentre oscillations) and mainly (north-) polar boundaries of the ocean basin.
(a)
(b)
(c)
(d)
(e)
