SAR Image Compression Using Integer to Integer Transformations, Dimensionality Reduction, and High Correlation Modeling ()
1. Introduction
Synthetic-aperture radar (SAR) is an active form of radar used to create two-dimensional or three-dimensional reconstructions of objects, such as landscapes, by bouncing a microwave wavelength signal off the Earth’s surface and analyzing the backscattered results, as illustrated in Figure 1. There are specific advantages to this approach as it allows imagery to be obtained regardless of illumination and weather conditions. However, there are also common artifacts of this imaging
![]()
Figure 1. SAR image acquisition from flying platform.
process such as speckle effects, mainly due to altitude variations over the scanned area, which often manifest in an increase of the approximate linear dependence of the data, as characterized by the singular value decay rate [1]. SAR data are often presented in complex form, with real and imaginary parts or equivalently in polar format with magnitude and phase information [2]. Effective compression of complex SAR data is often necessary for storage and transmission applications, yet often challenging due to the need for high reconstruction accuracy, in applications such as interferometry. The techniques applied here can vary based on the available format of the SAR data, either encoded as PNG, or in raw format with magnitude and phase components. In both cases, it is interesting to exploit redundancy in the data via lossy compression, prior to the application of lossless compression techniques. We propose two different methods to do this, one tailored for sets of integer data and one for floating point data.
2. Methods
In what follows, we provide some details on different SAR data formats, which are also common to various remote sensing type data, discuss blocking and transform application, which is an essential parallelizable step for the redundancy reduction direction, and then present the proposed algorithms for integer and floating point data which combine redundancy reduction and compression techniques.
2.1. SAR Data Formats
We consider complex SAR data available for download from the Sandia National Laboratory [3]. There are several data sets, some available as 8 bit gray scale PNGs and binary general feature format (GFF) files, which can be parsed for magnitude and phase (
) matrix components, with the image reconstructed in Matlab/ Octave as
;
. The singular decay for both matrices is typically non-linear, as illustrated for a sample image in Figure 2. Depending on the situation, the matrix components can be integer (noise-free) or floating pointing quantities. The PNG sizes range from about 2.8 to 3.0 MB, while the GFF files are 16 - 32 MB each. It is easily seen that in many instances, such as in transmission of multiple images between remote locations or during recording for storage, effective lossy compression techniques for the data or its subset could be desired. In the case of integer data, it is important to try not to convert it to floating point representation, via the use of general purpose transforms from signal processing applications, as floating point data generally take more space to store and are harder to compress. On the other hand, if the original data is in floating point form then a wavelet or Hadamard type transform is suitable for use in order to accelerate the singular value decay and/or possibly group similar data values closer together, as desirable to achieve better compression.
2.2. Data Blocking and Transform Application
In the presented algorithms, we propose to subdivide the matrix data into sub-blocks and separately apply a linear transform to these blocks, then further process the resulting output. This step is useful for preparing the data for redundancy reduction. Previously, Gabor type transforms have been demonstrated to be effective for improving compression [4]. However, in the case of PNG images or integer magnitude/phase data, such blocks would contain integer data and an integer to integer (int-int) transform would be the most appropriate to apply, to avoid transforming integer data to floating point. One option for such an invertible transform matrix can be derived from a rounded and scaled Discrete Cosine Transform (DCT) matrix. For the case of floating point data, a multi-level wavelet transform can be used. The idea is that the transformed nearby blocks (or even blocks across different images in a set) would exhibit some similarity, such that either the combined matrix of transformed blocks would exhibit greater singular value decay than that of the original block data or that the sorted block values would have high pairwise correlation, which would allow some block values to be predicted in terms of another and a retained integer permutation index set. The linear transform matrix M must be invertible (such that
is sufficiently away from zero) and well-conditioned. For that, suitable scaling is necessary to be applied before rounding to avoid setting certain small
![]()
Figure 2. Illustrations of a SAR image and the corresponding singular value decay of its magnitude and phase components from the open Sandia data set.
entries to zero. As one candidate in Algorithm 1, in Octave syntax, we can use the int-int transform matrix
, based on the DCT formulation
for
. Other transform examples can be found in [5].
2.3. Approximate Linear Dependence
For both the PNGs and the GFF files, which contain the magnitude and phase data, approximate linear dependence and redundancy amongst data columns can be observed both in the original data and under suitable transformations. In our proposed methods, we attempt to take advantage of this via a reduced rank linear transformation, the Interpolative Decomposition (ID), which retains only a portion of the permuted data columns and a small floating point matrix. The ID is factorization based on the QR decomposition, which returns a factor containing a selection of columns (or rows) of the original matrix. We can start with the pivoted QR decomposition,
, which can be written as
for a column index
, with details given in [6]. This results in the approximate factorization:
with
, a subset of the columns of A based on the pivoting strategy in the QR factorization and the remaining V factor a well-conditioned matrix. Notice that when we apply the ID to the matrix transpose we get
, where
represents a subset of k rows of the matrix, corresponding to the employed pivoting strategy. The use of the ID allows us to retain only a subset of the available columns or rows of a matrix when it’s singular values decay nonlinearly, thus enabling us to substantially reduce the amount of data in the target matrix, which when used together with image compression and lossless compression techniques, acts to improve performance.
2.4. Lossless Compression
The lossless approach consists of either the Burrows-Wheeler based or zlib compression [7] [8], chosen adaptively, depending on which gives better results. In the case of the former, a Burrows-Wheeler local similarity transform (BWT) is used to reversibly transform the input into a better compressible form based on string sorting, followed by a variant of the move to front (MTF) transform and run length encoding (RLE) for rearranging frequently appearing symbols to the front and compressing sequences of identical data and finally entropy coding (EC), such as Huffman or arithmetic coding, for more efficiently representing the input data. The goal of BWT is to reversibly transform the input into a better compressible form based on string sorting. The lossless approach is applied to the transformed data after the lossy steps are employed. The zlib approach consists of the LZ77 algorithm which replaced repeated symbol occurrences with a reference to the symbol in dictionary and Huffman coding, or optionally, Arithmetic coding, which represents the data in terms of a floating point interval. Data can be split into byte sets and separately compressed. For floating point data, specialized methods can be employed [9].
2.5. Proposed Algorithms
We propose approaches to compress SAR type and similar data sets in different formats more efficiently than can be done with the use of general purpose compression tools such as bzip2 or zlib, or regular image compression (e.g. JPEG) by taking into account the approximate linear dependence which is further revealed via the use of suitable transform methods. The methods discussed are general enough to also apply to data from other remote sensing and imaging applications.
· Method 1 for image data saved in PNG and similar formats, from which we can extract the integer pixel data, is based on blocking, the application of an int-int mapping transform, the interpolative decomposition and lossless encoding or optionally, JPEG type compression. The matrix of transformed blocks displays faster singular value decay compared to the matrix of original pixel blocks, by which principle a low rank ID decomposition can be utilized to represent the data efficiently with a fraction of retained columns. Subsequently, lossless compression is utilized to store the resulting ID components (a subset of the transformed block data and a small floating point matrix) more efficiently. Reconstruction is accomplished by uncompressing the ID components, multiplying out the ID factors to form the transformed block matrix approximation, and then applying the inverse transform to the blocks.
· Method 2 for image data saved in binary format with magnitude and phase components (assumed to be floating point data due to noise) is based on the use of blocking and a high correlation low order polynomial modeling scheme, whereby transformed (under a wavelet or Hadamard transform) absolute value coefficients for each block, with original signs recorded by a bit array are sorted, log transformed, and used with a pairwise model between data pairs in order to reduce the number of retained floating point data vectors, replacing them with a few model coefficients, and an integer based permutation vector for the sort order. A clustering scheme can be utilized based on the correlation information between data vectors to identify similar data clusters and to approximate elements of each cluster.
2.6. SAR PNG Data Compression with Block Transforms
In order to transform the SAR PNG data set, we load the pixel values for one or more images from the lossless PNG representation. The described method shown in Algorithm 1 is likely to work better if the block wise compression is applied to several images at once from the same set, as some similarity between different images in the same set is likely. In both cases, a matrix representation is formed from the pixel values. For example, from the realccd1 set [6], the PNGs are 8 bit with dimensions 3000 × 1754 and we can use a block size of 256 × 256 to subdivide the pixel data into 84 blocks. Each of the values in these blocks will generally be on the range
. Yet, the direct compression of such blocks may not produce the most efficient representation in terms of size/quality tradeoff. Instead, we apply an integer to integer transform to each block, using an invertible (nonzero determinant) linear matrix of integer elements which maps integers to integers, based on the scaled rounded DCT. The resulting transformed block set would have some similarity, in the sense that it’s singular value decay will be more rapid than the decay of original blocks from the image pixel values. After the application of the transform, the entries would occupy a greater range and include both negative and positive numbers. We can subtract the smallest number (largest magnitude negative value) from each block in order to make all the block members non-negative. Optionally, prior to this, we can compute the median of every p blocks, and subtract the median block from every block in the corresponding set, to attempt to further increase similarity between block data. Following these steps, the ID (see Figure 3) is applied to the matrix of transformed blocks with a reduced rank, which significantly reduces the amount of retained data. The remaining data, including the ID factors I,
,
and any scaling factors or median blocks used for scaling and subtraction are losslessly compressed. Lossy reconstruction is readily achieved by computing the approximation
to the matrix of transformed blocks and then applying the appropriate scaling. The ID and int-int transform structure are shown in Figure 3. When the approach is utilized on multiple images at once, it is likely to lead to overall better compression by exploiting similarity between blocks of different images under an int-int transform. If this is done, the images are appended together column wise to form a larger overall matrix and a larger block size may be suitable (e.g. 512 × 512, 1024 × 1024). One possibility is to consider image compression techniques applied to the data in the MI matrix, which is a subset of the transformed pixel data, prior to the application of lossless methods.
![]()
![]()
Figure 3. Illustration of int-int transform structure and the ID decomposition, which selects a subset of rows or columns of a matrix based on the QR decomposition pivoting vector output.
In Figure 4, we may observe how the decay of singular values is accelerated with the use of the invertible int-int transform. As can be observed, the decay (illustrated in log scale for the example block sequence given in the numerical experiments example) is sufficient enough to warrant the use of the dimensionality reduction techniques prior to the application of the traditional data compression methods.
2.7. Compression of Magnitude/Phase Data with High Correlation Modeling Approach
Sometimes, SAR data is taken directly from the imaging instrument without post-processing into an image format. In the case of complex data, magnitude and phase data recordings are available, such that the image can be formulated via the computation
, with floating point
and
matrix components, which are generally more challenging to compress well losslessly [9]. In the case of similar data, such that when many images of a common area are considered, the amount of floating point data across the image set can be reduced by high correlation modeling techniques with a model used to represent transformed and sorted absolute value coefficients sets for a block of data in terms of one of the retained pillar blocks. In this approach, we take separately the
and
data, divide the data in blocks, apply a transform, and seek to reduce redundancy via the ID, as in the previous approach. For the remaining block pairs retained in the MI factor of the ID, we compute the correlation coefficient between sorted transformed absolute value coefficients for each data block and construct low order polynomial models between transformed sorted block coefficients which have high correlation. The transform used can vary, but a wavelet transform such as the CDF 9/7 family, typically works well on floating point data [8]. The idea behind this scheme in Algorithm 2, is that the decay of sorted absolute value coefficients after the application of the linear transform on block data is approximately exponential and becomes approximately linear under a log transform. This then allows to model portions of the decaying by magnitude coefficients with respect to a retained pillar floating point vector, if the permutation indices and signs data is retained for every data block. The non-negative integer permutation data can generally be lossless compressed efficiently and the sign data can be compressed using bit arrays. The reconstruction can be accomplished by reversing the sort order using the permutation data and inserting the correct signs, followed by the application of the inverse transform.
In the center of Figure 4, we can see the exponentially decaying shape of the sorted absolute value transformed coefficients of the magnitude data. It’s important to note that this general decay will be observed for any particular data sequence. Under a log transform, the decay will be approximately linear, especially if the sorted coefficients are separated into several portions and the portions are separately compared to those of different instances. The linear correlation between such approximately linearly portions corresponding to different instances will in many cases be high (>0.95), as indicated by the correlation plot on the right of the figure. In the case of high correlation, the coefficients from
![]()
![]()
Figure 4. Left: singular value decay of original and int-int transformed data blocks. Center/Right: Transformed and sorted absolute values of SAR magnitude components under CDF 9/7 transformation and sample block pair correlations.
one portion may be used to predict those of another portion with a linear or low order polynomial model. The matrix of one minus the pairwise correlation values can be utilized as a dissimilarity measure by a clustering algorithm in order to group similarly transforming data blocks together. Within each cluster, one or more floating point vectors can be designated as pillar(s) and used to predict the remaining floating point vectors of absolute value sorted transformed coefficients with a suitable polynomial model. Using retained re-indexing data from the sort and the transformed coefficient signs, the original floating point data for the target instance can be approximately recovered from the retained pillar reference(s). For better performance, the exponentially decaying curve of the sorted absolute value coefficients can be pre-divided into several portions and separate models for each potion can be formed between the pillar(s) and the other floating point vectors in a cluster. In the case of several pillars, the pairwise model with the least error is used in each case, corresponding to a particular pillar element for each member.
3. Numerical Experiments and Discussion
In this section, we summarize experimental results for the two proposed algorithms for sets of one and multiple SAR images obtained from [3]. We first consider a set of 8 images, each with dimensions 1754 × 3000 and size 5.3 MB in uncompressed raw format (PPM). In lossless PNG format, the images are 2.7 - 2.9 MB each, with slight variation between images depending on the contents. The combined image in PNG format is of approximate size 22.5 MB. With JPEG, we can significantly reduce the size with downsampling, depending on the acceptable level of quality, which we can quantify as the PSNR score between the output image and the original. Here, we describe the performance of our first method with respect to this input. Separating the merged image data in 256 × 256 blocks yields a matrix structure M of size 168,960 × 256. Performing an ID decomposition of rank 60 on this matrix, we have a subset of columns MI of size 168,960 × 60, and a small floating point matrix Vt of size 60 × 256, which together approximate the M matrix within 2%. After the application of the int-int transform to each block and the subtraction of the largest magnitude negative value to make the resulting matrix M2 non-negative, the singular value decay is accelerated and a smaller rank 25 can be used to obtain MI2 of size 16,890 × 25 and with a correspondingly smaller floating point matrix Vt2 achieve a slightly smaller approximation error to M2, the matrix of int-int transformed blocks, of within 1%. The storage requirements then come down to a 168,960 × 25 non-negative integer matrix and a small 25 × 256 floating point matrix, a significant reduction from the original M or M2 matrix size. The original image can be recovered via the multiplication of the ID decomposition elements, followed by the addition of the stored previously subtracted negative value for each block, the application of the inverse int-int transform to the blocks, and rearrangement of the blocks into the original geometry, and then interpreted as pixel values and exported to PNG with a header. This will be a non-exact reconstruction due to the use of the lossy ID. The ID portion, mainly represented by the
matrix and the small floating point multiplier
and scaling factors can then be compressed with lossless methods. If this is done, the file size and PSNR numbers can be comparable to or best JPEG compression with subsampling. For the discussed example, the output size of BWT/AC based compression of the ID components of the factored block transformed matrix is shown in Figure 5. It’s worth noting, that the JPEG algorithm can be applied to the MI matrix entries, as these are a subset of the columns of the original block image data. The MI2 data are a subset of int-int transformed pixel values, with applied translation to make them non-negative. On these entries too, techniques from image processing can be attempted. Thus, the fact that the output size is comparable to subsampled JPEG even without additional image compression methods is indicative of the fact that dimensionality reduction (made possible via the int-int transform application to the blocked data) paired with lossless compression, is a promising direction for this and similar data types.
Next we discuss the processing of the GFF files. Each file consists of a header and magnitude and phase component data for a total of about 16 MB. The image can be formed by extracting the magnitude (M) and phase (P) data, evaluating the complex form
, taking the absolute value and scaling to the range
. Direct compression yields small improvement on the file size, bring it down to about 14 MB. Extraction and individual compression of magnitude
![]()
Figure 5. Original image set and reconstruction from compressed data. Comparison of output sizes with different compression schemes.
and phase data gives additional gain to about 12 MB. However, both the magnitude and phase data exhibit non-linear singular value decay, and as with the previous data, the decay can be accelerated by the application of the block based int-int transform, prior to lossless compression. Doing so, yields from the original magnitude and phase integer data matrices of size 2512 × 1638, matrices MI2 and Vt from the ID decomposition of the scaled int-int transformed data, of size 17,920 × 100 with rank 100 (of 256), with respective reconstruction errors of 4.7 and 3.8 percent. The ID derived data compress significantly better than the original matrices, for a total of around 7 MB, compared to 12 MB for the compressed magnitude and phase data. The rank can be varied to achieve the desired PSNR value. For the stated approach, the reconstruction with the approximation from the ID of the block int-int transformed individual (only magnitude or phase) and both components are given at the top of Figure 6.
The last case illustrated in Figure 7, is where the magnitude and phase data have additive noise, so that they are floating point matrices and compress significantly worse with lossless techniques (for example, with 70 blocks for the magnitude matrix data, they are of size approx. 32 MB and zlib can decrease the
![]()
Figure 6. GFF integer data file reconstructions (top): original, with respective phase and magnitude approximation, and both approximated. Output file sizes (bottom left) with int-int-ID compression compared to bzip2 individually compressed components. Illustration of pairwise high correlation modeling approach for reconstructing transformed sorted coefficients from pillar data (bottom center, right).
![]()
Figure 7. GFF file components with additive noise (floating point). Illustration of pairwise high correlation modeling approach for reconstructing transformed sorted coefficients from pillar data. Actual vs recovered signed transform coefficient data and actual data. Bottom: clustering silhouette measure and sample dendrogram.
size to at most ≈ 30 MB). The floating point entries can be due to aberrations in the collection process or e.g. introduced during data transmission from remote locations. As before, we propose to subdivide the magnitude and phase data into blocks, which are now with floating point values. After the application of the CDF 9/7 wavelet transform, the absolute value sorted coefficients from some pairs of different blocks would have high correlation (as they would decay exponentially in a similar matter, with the curve split in several parts for separate modeling) and Algorithm 2 can be applied for compression, whereby one minus the pairwise correlation matrix entries is utilized as the dissimilarity matrix for clustering. This way, high similarity blocks of transformed floating point data are clustered together and can be all predicted based on a single retained member of each cluster and the associated polynomial model fitting parameters (several models for each part of the curve). If necessary, for larger clusters more than one member can be retained and the rest can be approximated with respect to either member depending on reconstruction error. As illustrated in Figure 7, only a fraction of absolute value vectors in each block need to be stored as pillars to approximately recover all the transformed floating point data. That is, in Octave notation, we take e.g.:
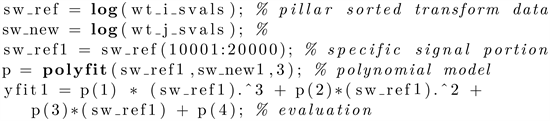
and approximate the sorted transform coefficients from the pillar reference as  where the beginning and ending values (of the exponential decay curve) are retained for member j and the rest approximated via the polynomial model with respect to the pillar. For example, with 35 blocks, we can take 10 clusters (based on the analysis of the silhouette measure), and only store one or two floating vectors per cluster. The wavelet coefficients of the non-pillar (reference) blocks are recovered this way to small error (below 0.1%), but on application of the inverse transform the error increases, as illustrated on the top right. The method is most appropriate for compressing sets of magnitude/phase floating point blocks from a collection of several related images.
4. Conclusion
We have presented new methods applicable to the compression of integer based and floating point imaging data. For both cases, the described new direction is the introduction of additional steps prior to the application of traditional lossless or lossy techniques. One of the key steps is dimensionality reduction, which can be utilized more effectively after the application of a suitable transform. We describe a simple integer to integer rounded DCT based transform construction for this purpose. For floating point data blocks with inherent similarity, we discuss a correlation based approach for reducing the number of floating point elements, where the transformed and sorted absolute valued coefficients are clustered and modeled with respect to retained pillar data, allowing for a reduction in floating point vectors in each identified cluster. Both of the approaches are lossy but can be tuned to different reconstruction tolerance levels.