Food and Nutrition Sciences
Vol. 3 No. 5 (2012) , Article ID: 19069 , 10 pages DOI:10.4236/fns.2012.35082
School Feeding Programme in Nigeria: The Nutritional Status of Pupils in a Public Primary School in Ile-Ife, Osun State, Nigeria
![]()
1Department of Chemistry, Obafemi Awolowo University, Ile-Ife, Nigeria; 2Department of Agricultural Economics, Obafemi Awolowo University, Ile-Ife, Nigeria; 3Center for Energy Research and Development, Obafemi Awolowo University, Ile-Ife, Nigeria.
Email: sadewusi@oauife.edu.ng
Received November 23rd, 2011; revised February 23rd, 2012; accepted March 1st, 2012
Keywords: Anthropometry; Amino acids intakes; Body mass index; Macronutrients; School feeding programme
ABSTRACT
About 7.3 million children are estimated to be out of school in Nigeria; majority of them are girls. The Federal Government school feeding programme is to provide one meal per school day to all primary school pupils in Nigeria with the objectives of improving the health of school age children, increase their enrolment, retention and completion rate in the primary school. The nutritional status of 160 pupils (80 boys and 80 girls) of a selected public primary school in Ile-Ife, Osun State, Nigeria was assessed using anthropometric parameters. Meals were collected and analyzed for nutrient composition and compared to the requirement for their age group. The mid-arm circumference (MAC) ranged between 15 and 21 mm and the body mass index, (BMI) was within the WHO reference standard for healthy children. The crude protein (CP) content of the served foods varied between 12% and 28%. The average intake of amino acids per meal ranged between 122 and 684 mg, vitamins from 0.1 to 0.8 mg while mineral intake varied from 2.7 to 85 mg. The protein digestibility corrected amino acid score varied between 50% and 114%. These results indicated that the feeding programme has greatly improved the nutrition status of these children. The continuation of the programme would go a long way to preventing malnutrition among the public school children.
1. Introduction
School feeding programme has been adopted in many countries throughout the world to fight short-term hunger by ensuring at least one daily nutritious meal to support access to education. The high level of food insecurity, significant incidence of malnutrition and economic meltdown all combine to make school feeding relevant [1]. In the poorest pockets of the world, this simple strategy can double primary school enrolment in one year, as is happening in Nigeria. For a child suffering from hunger, going to school is not important; having enough food to eat is. Among the poor, there is often not enough food at home, and most schools in the developing countries do not have a canteen or cafeteria. On empty stomach, children become easily distracted and have problems concentrating on the school lessons [2].
The majority of the estimated 7.3 million children out of school in Nigeria are girls. In 2005, the Federal Government of Nigeria launched the School Feeding Programme with the assistance of the United Nations’ Children Education Fund (UNICEF) and the New Partnership for Africa’s Development (NEPAD). The objective is to provide one meal per school day to all primary school pupils in Nigeria with the objectives of improving the health of school children, increase their enrolment, retention and completion rate. Since then the enrolment rate had increased while the attendance of pupils in school is stable especially among girls who used to leave school for street trading and house-help jobs [3].
So far, no empirical research has been carried out on the quality of the school meals in terms of nutrient content per serving to these pupils, yet it is important to ascertain that the food can achieve at least 30% of daily nutrient requirement target of the programme. Childhood is an important stage for both physical and mental development and it is believed that overweight children are more likely to be overweight adults and vice versa [4]. A suitable diet should therefore ensure that all nutrient requirements are met in order to protect current and future health in addition to being palatable. Nutrient requirement during childhood is at their highest for many nutrients, due to extreme physical changes including increase in height, bone and muscle growth and also active participation in sports and exercises, which result in increased demand for energy and specific nutrients.
The objective of this research is to carry out the anthropometric measurements of the pupils; predict the nutritional status of the school children; carry out the nutrient analysis of the school meals; calculate the nutrient intake therefrom and then compare it with Recommended Dietary Allowance (RDA) for children.
2. Materials and Methods
2.1. Anthropometric Measurements
This study was conducted according to the guidelines laid down in the Declaration of Helsinki and all procedures involving human subjects were approved by the Ethics committee of the College of Health Sciences of the Obafemi Awolowo University, Ile-Ife, Osun State, Nigeria. Verbal informed consent was obtained from the head teacher and all the teachers standing loco parentis for the subjects.
Anthropometric indices of 160 pupils (80 boys and 80 girls) of a selected public primary school in Ife East Local Government area of Osun State, Nigeria were measured. The weight of each subject was measured without shoe to the nearest 0.1 kg, using a standardized digital scale. Height was measured to the nearest 1 mm using a portable Stadiometer. Body Mass Index (BMI) was calculated as weight (kg) divided by the square of the height (m2) (kg/m2) and BMI percentiles for age were calculated using BMI calculator developed by Halls [5]. This was compared to America’s weight and used to classify the subjects into underweight, normal weight, overweight or obese [5,6]. The mid-arm circumference (MAC) was taken at the left hand side of the body of all the subjects. All measurements were carried out according to the standard WHO [7] techniques.
2.2. Experimental
The samples of the meal prepared for the primary school pupils on a daily basis were collected in plastic containers and treated within four hours of preparation. The samples were weighed, dried in the oven (Gallenkamp oven Model SA 9059 B) at 50˚C, ground into powder and then sieved with No 72 mesh size (Griffin and George Ltd., London). The samples were stored in plastic containers with screw cap and kept in the freezer until analyzed.
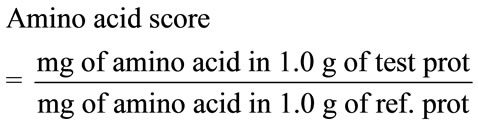
Analysis of moisture, ash, crude protein, crude fibre and fat content was carried out by the method of AOAC [8]. The ash was solubilised and its content of iron, zinc, calcium and magnesium was determined by the Atomic Absorption Spectrophotometer (Alpha 4 Model, Fisons Chem-Tech, Analytical, UK). The amino acid profile of the samples was determined using the Technicon Sequential Multi-Sample Amino Acid Analyzer (TSM) (Technicon Instruments Corporation, New York, USA) with nor-leucine as the internal standard. Digestibility corrected amino acid and amino acid score were calculated using egg as reference protein according to FAO/ WHO [9] method. The equation for the Amino acid score is given below:
The content of water soluble vitamins—thiamin, pyridoxin, folic acid, nicotinc acid and ascorbic acid in the samples was determined simultaneously by the modified method of Khor and Tee [10] using High Performance Liquid Chromatography (Agilient Technologies Model 1200, Germany). The calorific value of the samples was estimated from the proximate data based on 17 kJ/g carbohydrate, 17 kJ/g protein and 37 kJ/g fat [11].
2.3. Nutrient Intake
The nutrient data were used to calculate the nutrient intake from the weight of the composite meals and the result compared with the Recommended Dietary Allowance (RDA).
2.4. Statistical Analysis
Results were expressed as mean and standard deviation of three determinations except for anthropometric parameters. Data on food composition were subjected to one way analysis of variance to determine the levels of significant difference by performing a multiple comparison post test (Tukey) and considered significant at p < 0.05. The computer program used for these analyses is GraphPad InStat version 3.06 for Windows 2003.
3. Results and Discussion
3.1. Anthropometric Measurements
The result of anthropometric measurements of the sampled population is presented in Table 1.
The weight of the subjects ranged from 13 to 33 kg, height from 1.0 to 1.4 m and the Mid Arm Circumference from 15 to 21 mm. The Body Mass Index (BMI), which is widely used to measure adiposity [12], associated with increased morbidity and mortality in adults and adolescents [13] ranged from 12 to 17 kg/m2. When the determined BMI percentile for the specific age of the pupils was compared with the National Health and Nutrition Examination Survey reference data 1 (NHASES 1 Annex 3) adapted by WHO [6], it was observed that most
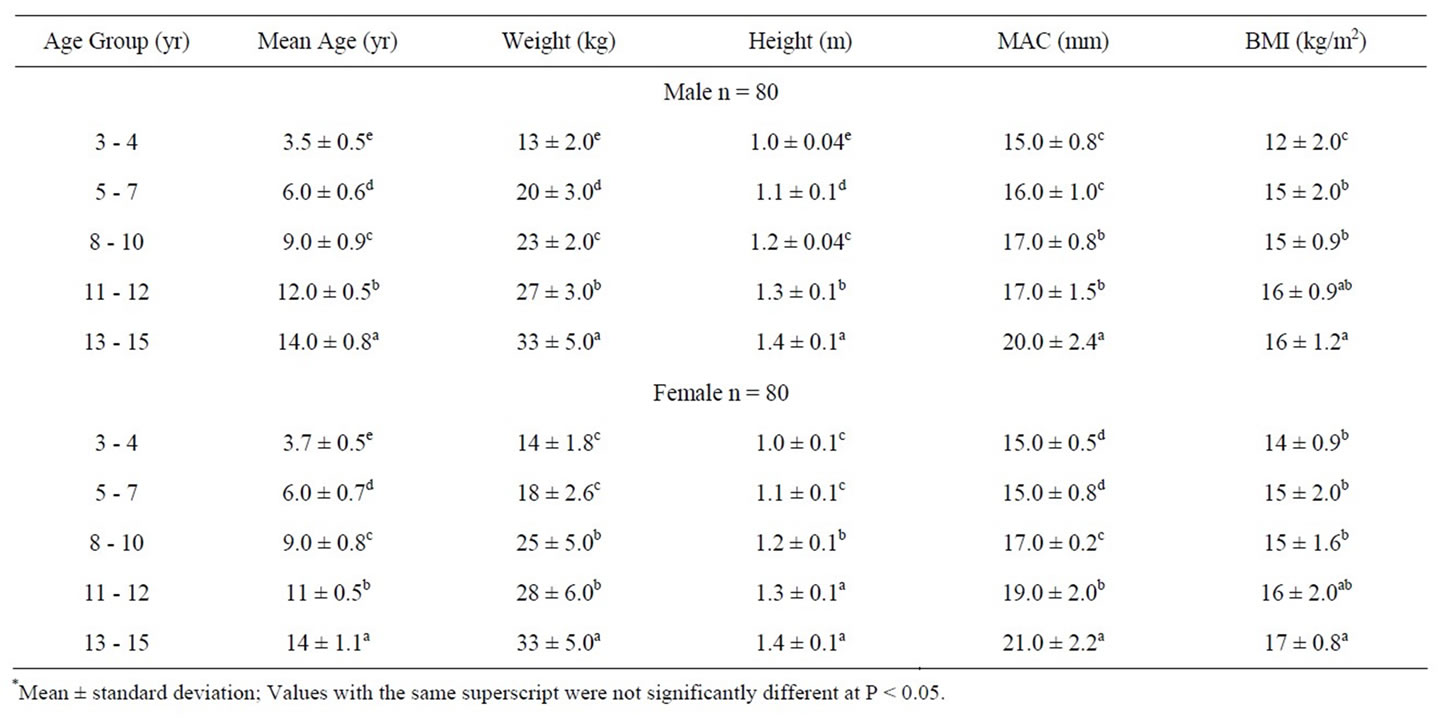
Table 1. Anthropometric measurement* of school children.
of the pupils had BMI percentile between 5th to 85th percentile which, according to the Centre for Disease Control and Prevention rating, indicated a healthy growth among the school children (Table 2).
There were more underweight school children whose BMI was below the 5th percentile (13% male and 15%
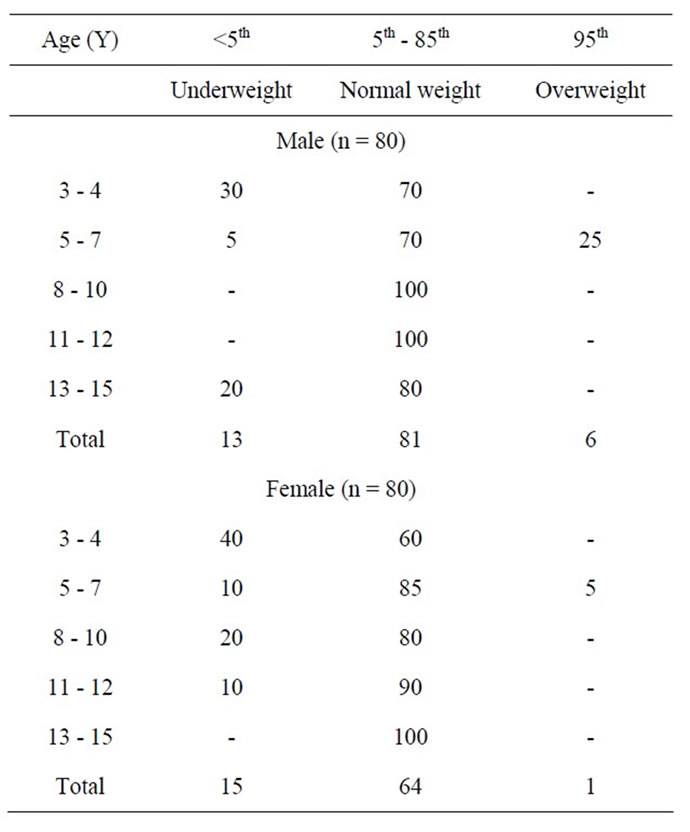
Table 2. BMI Percentile for age (%).
female) compared to overweight children (6% male only) whose BMI was equivalent to or above the 95th percentile.
Although there was no established cut-off point for childhood overweight, an expert committee convened by the Maternal and Child Health Bureau of the Department of Health and Human Services recommended that children with BMI greater than or equal to the 95th percentile for age and sex should be referred for evaluation and possible treatment for overweight [14,15]. Harris et al. [16] have pointed out that the percentile used in the developed countries cannot be used for children and adults in developing countries like Nigeria. This is because BMI is dependent only on net weight and height, with a simplistic assumption about distribution of muscle and bone mass, and thus over-estimate adiposity on those with more lean body mass (e.g. athlete) while underestimating adiposity on those with less lean body mass [17]. Thus, it was shown that the depiction of nutritional status in terms of BMI alone could be seriously deficient. For example, Deurenberg-Yap et al. [18] showed that for Chinese, Malays and Indians in Singapore, several people with low BMI had indeed such high body fat that they should appropriately be classified as obese. Chadha et al. [19] advocated the use of anthropometric parameters like waist-to-hip ratio and % body fat in addition to BMI in the assessment of nutritional status, therefore, the use of percentile BMI may not give the overall picture of nutritional status of the school children in Nigeria. In developed countries like the United States of America, childhood obesity is almost becoming epidemic [20-22] due to unhealthy eating, but stunted and impaired body growth and development resulting from malnutrition and hunger is still the bane of children especially in Nigeria.
3.2. Nutrient Intake
The type of food served to the pupils as school meal, the serving size and the proximate composition, were presented in Table 3. In addition to the mid-day meal, a cocoa-based beverage drink was given every Wednesday. The proximate composition (Table 3) indicated that moisture content ranged from 20% to 40% with the highest reported for Thursday meal.
Protein, an important component of food essential for growth and maintenance, ranged from 12% to 28%, fat (14% to 24%) ash (1.3% to 3.8%), crude fiber from (0.5% to 0.8%) and carbohydrate (4.4% to 50.7%). Thursday’s meal had the highest content of all the parameters analyzed. The results of amino acid and vitamin content of the foodstuffs are reported in Table 4. The result indicated that beans is limiting in sulphur amino acids (methionine and cysteine) and rice in lysine and isoleucine while threonine, lysine, isoleucine are the limiting amino acids in yam in that order. This observation is consistent with the findings of Meredith and Caster [23].
Thiamin was not detected in rice, corroborating the published report that polished rice is a poor source of thiamin [24]. The result of this analysis compared favourably with the values reported on the food composition table for vitamin [25].
3.3. Energy
The energy intake from the meal (Table 5) ranged from 604 to 889 kJ with the average intake of 772 kJ, translating to about 33% of 2200 kJ required by a ten year old child per day [26]. The macronutrients’ contribution to energy was 21%, 44% and 33% but the pattern fell short of the US standard of a high protein diet, which suggested 30% energy contribution from protein, 30% from fat and 40% from carbohydrate [27]; this menu could be considered as a nutritious protein diet in the Nigerian context, where root and tuber, predominantly carbohydrate, form the staple diet [28].
3.4. Vitamins
The vitamin intake from the meal is presented in Table 5. The result indicated that Tuesday and Thursday meals recorded higher water soluble vitamin content except for ascorbic acid. The average daily intake of thiamin, ascorbic acid, niacin, pyridoxine and folate was 0.87, 0.67, 0.20, 0.1 and 0.08 mg, respectively. Apart from thiamin and folate, which could respectively meet 95% of 0.9 mg and 40% of the 200 µg required per day, other vitamins fell far short of the daily requirements for school-age children.
The rice menu recorded low thiamin content due to the low level of thiamin in rice, therefore care has to be taken to balance rice with high thiamin-containing foodstuffs, otherwise beriberi, a noticeable deficiency disease of thiamin which has been reported to be endemic in areas where rice was the staple diet [24], could become prevalent among the children. Niacin, though very low in the meals, could be spared by tryptophan, from which niacin could be synthesized at the rate of 60 mg of the amino acid for every one mg of niacin. This way, the body could synthesize about 50% of the needed niacin. The use of tryptophan in this manner could therefore jeopardize the protein nutriture of the diets, making tryptophan a major limiting amino acid. Fruits and vegetables, which are rich sources of vitamins, are not included in the school menu. Unfortunately, parents too may not deem it necessary to give fruits to their children at home because of the cost and lack of enough knowledge of nutritional importance of incorporating fruits and vegetables in diets.
3.5. Minerals
Minerals are known to play vital roles in the maintenance
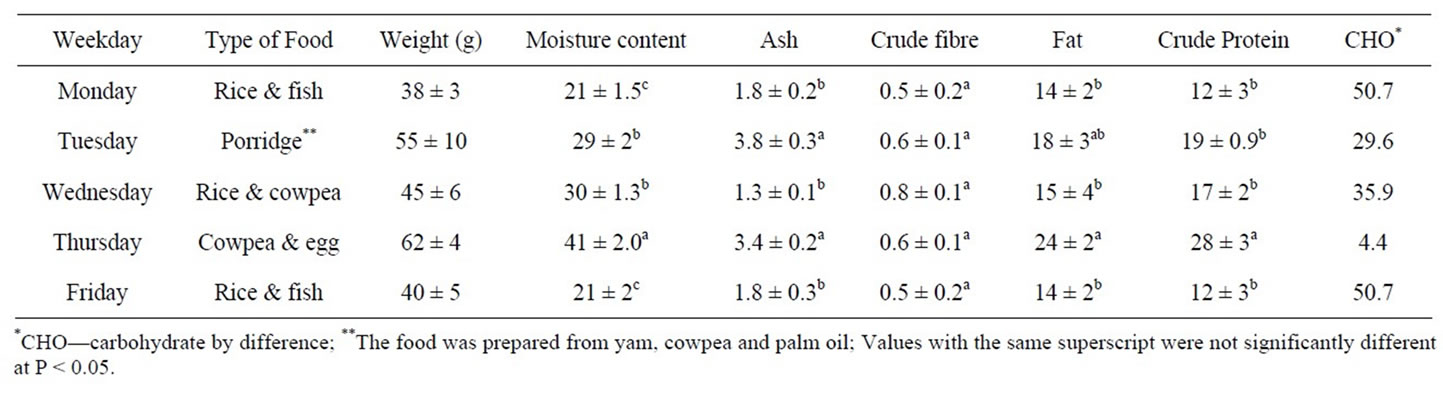
Table 3. Proximate composition of the school menu (% of each meal).
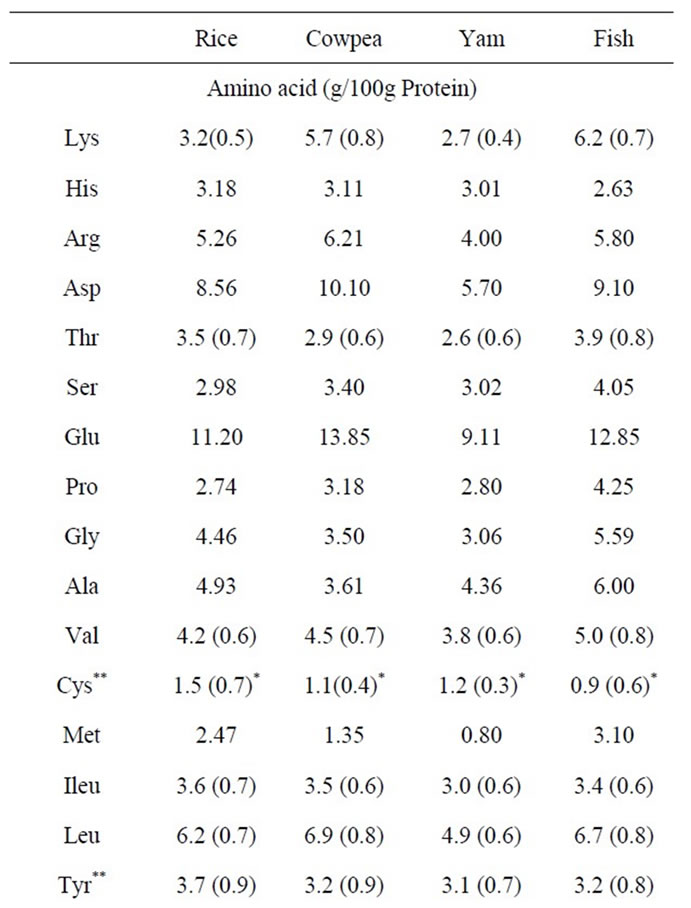
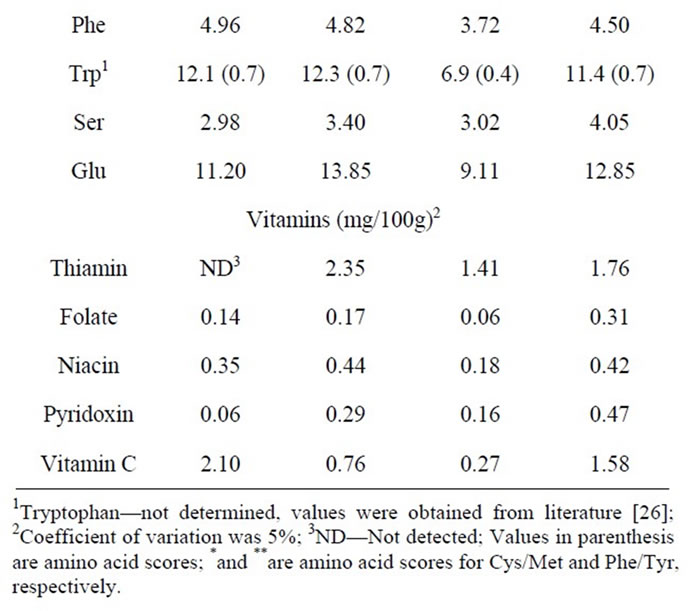
Table 4. Essential amino acid and vitamin content of foods.
of human health [29]. For example, iron is an important component of blood and enzymes, calcium is an essential macronutrient, which is critically important in the maintenance of optimal bone mass, proper functioning of soft tissues, blood clotting, regulation of muscle contraction and for many enzymatic processes. Zinc is essential for protein and nucleic acid synthesis and magnesium is important for structural stability of nucleic acid and intesti-
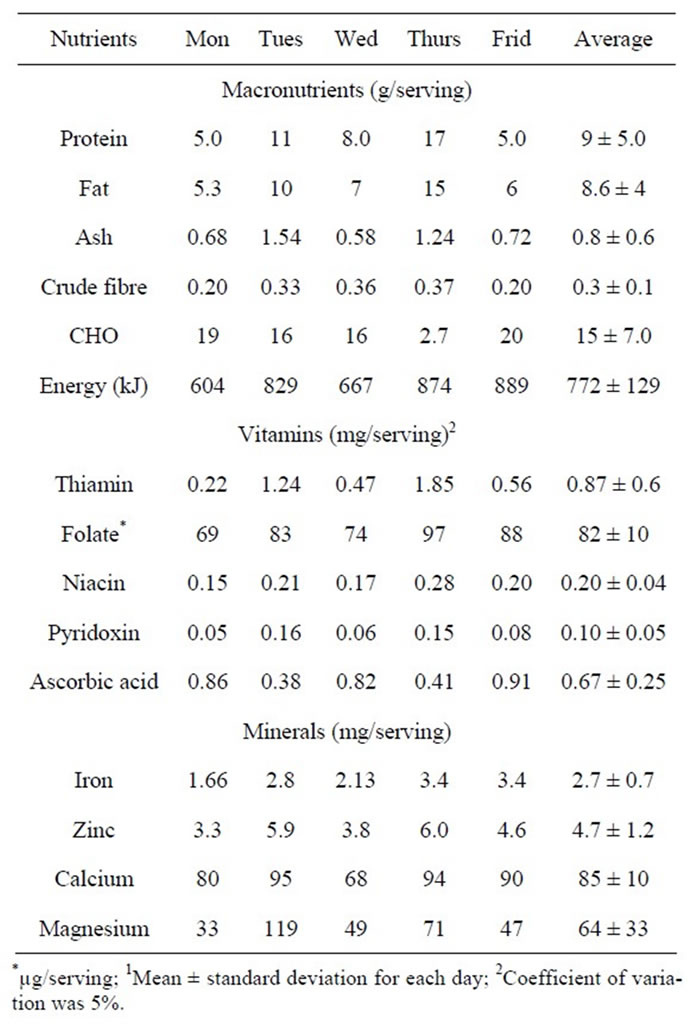
Table 5. Macro-nutrients, vitamin and mineral Intake/day1.
nal absorption of nutrients [30-34]. The mineral content of the composite meals is also presented in Table 5. The result indicated that the average intake of iron, zinc, magnesium and calcium from the school meals in mg were 2.7, 4.7, 64 and 85, respectively. The recommended dietary allowance for iron is 10 mg, zinc 10 mg, magnesium 170 mg and calcium 800 mg [25]. This indicated that the school meal could provide less than 30% of the daily requirement of the minerals assayed. The WHO considers iron deficiency the number one nutrition disorder in the world. As many as 80% of the world’s population may be iron deficient, while 30% may have iron deficiency anaemia [35]. It is therefore important to take care of mineral nutrition in the school feeding programme by supplementing with milk or the parents could be adequately counselled to provide mineral-rich foods at home.
3.6. Proteins
The intake of protein from the meals (Table 6) over a one-week period was an average of 10 g of protein, equivalent to 8 g digestibility-corrected protein per day
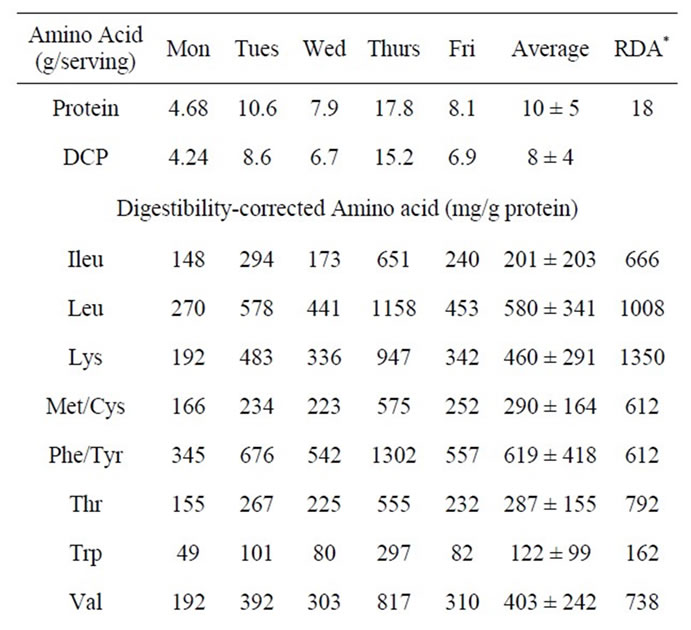
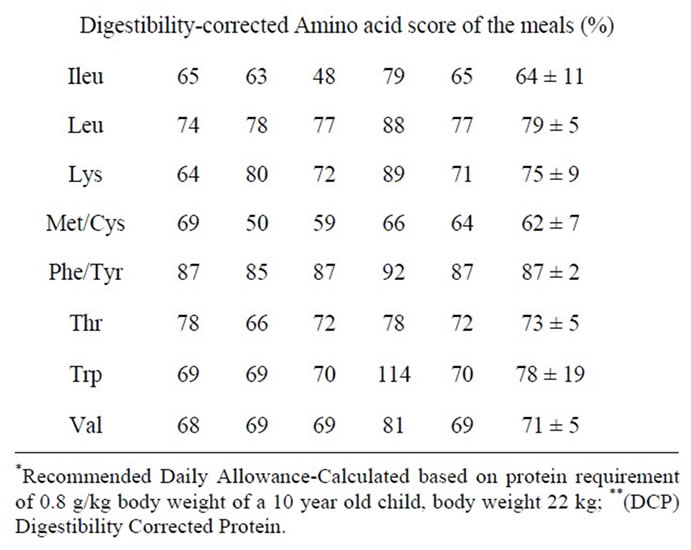
Table 6. Amino acid intake and amino acid score/day.
from the school meal. The protein requirement of a ten year old child, whose body weight is 22 kg, has been estimated to be 0.8 g per kg body weight [26]; this child would require approximately 18 g protein per day.
Ingestion of 10 g protein intake from the school meal would therefore translate to an average ingestion of about 45% of protein required for a day. Though school feeding is an intervention programme at ensuring fair intake of nutrients by the pupils, protein intake through the school meal may be regarded as sub-optimal, considering the fact that not all protein ingested in the food would be utilized. Much more important is the fact that the school meal could be the child’s best and most nutritious meal of the day, due to the level of poverty in most homes where cassava meal is the staple diet. Protein is crucial to the regulation and maintenance of the body, especially for growth and cognitive development of the individual, body functions such as blood clotting, fluid balance and cells and tissue repairs [24] and should be provided to the school children in adequate level.
The quality of the protein in the meals was investigated in terms of the essential amino acid content and protein digestibility-corrected amino acid score (PDCAAS), which is a method of evaluating the protein quality based on the amino acid requirement of humans adopted by the US. Food and Drug Administration (FDA) and the FAO/WHO [9]. The result, presented in Table 6, indicated that the average intake of the essential amino acid from the meals ranged from 122 mg tryptophan to 619 mg phenylalanine/tyrosine. When the requirement for amino acid was estimated, based on the 18 g protein required by a 10 year old child with body weight of 22 kg, and compared with amino acid intake; the school meal could meet a range of 30% to 75% of the requirement, depending on the amino acid. From the average intake of amino acids (Table 6), it was revealed that isoleucine, lysine and threonine were in short supply making them the first, second and third limiting amino acids, respectively, based on RDA of these amino acids. Sulphur amino acids have been reported as the limiting amino acid in legume products [36]. The amino acid score of the meal compared with egg protein, as reported in Table 6, indicated that the score ranged from 50% to 114% with the meal of cowpea and egg provided on Thursday having the highest score. It would therefore be essential to complement cereals and grains with legumes and animal protein. A survey of daily food intake by the school children revealed that many of them eat rice worth twenty naira (N20.00) as breakfast, gari (a cassava product) and groundnut or groundnut cake (Kulikuli) as lunch while eba (another cassava meal) or amala (yam flour meal) with okra soup served as supper. Thus, the school meal seems to be the best and most nutritious food for the child throughout the day and any shortfall in the nutrient requirement (especially essential amino acids) may not be provided by any other meal. It is therefore suggested that the quantity of food given to these pupils be increased in order to meet at least 50% of the protein and vitamin requirement per day. The cost of the school meal was thirty naira (N30.00 or US$0.20) per child per day. Hypothetical mixing of foodstuffs; rice and cowpea, yam and cowpea were carried out to see the composite that would give highest nutrients and possibly at minimum cost. The result presented in Table 7, indicated that the protein content and therefore the amino acid profile of the composite meals increased as the content of the cowpea increased while the cost decreased. Rice and cowpea meal of 15:35 g recorded the highest protein and amino acid content. A similar trend was observed for all the vitamins except ascorbic acid. It is therefore sug-
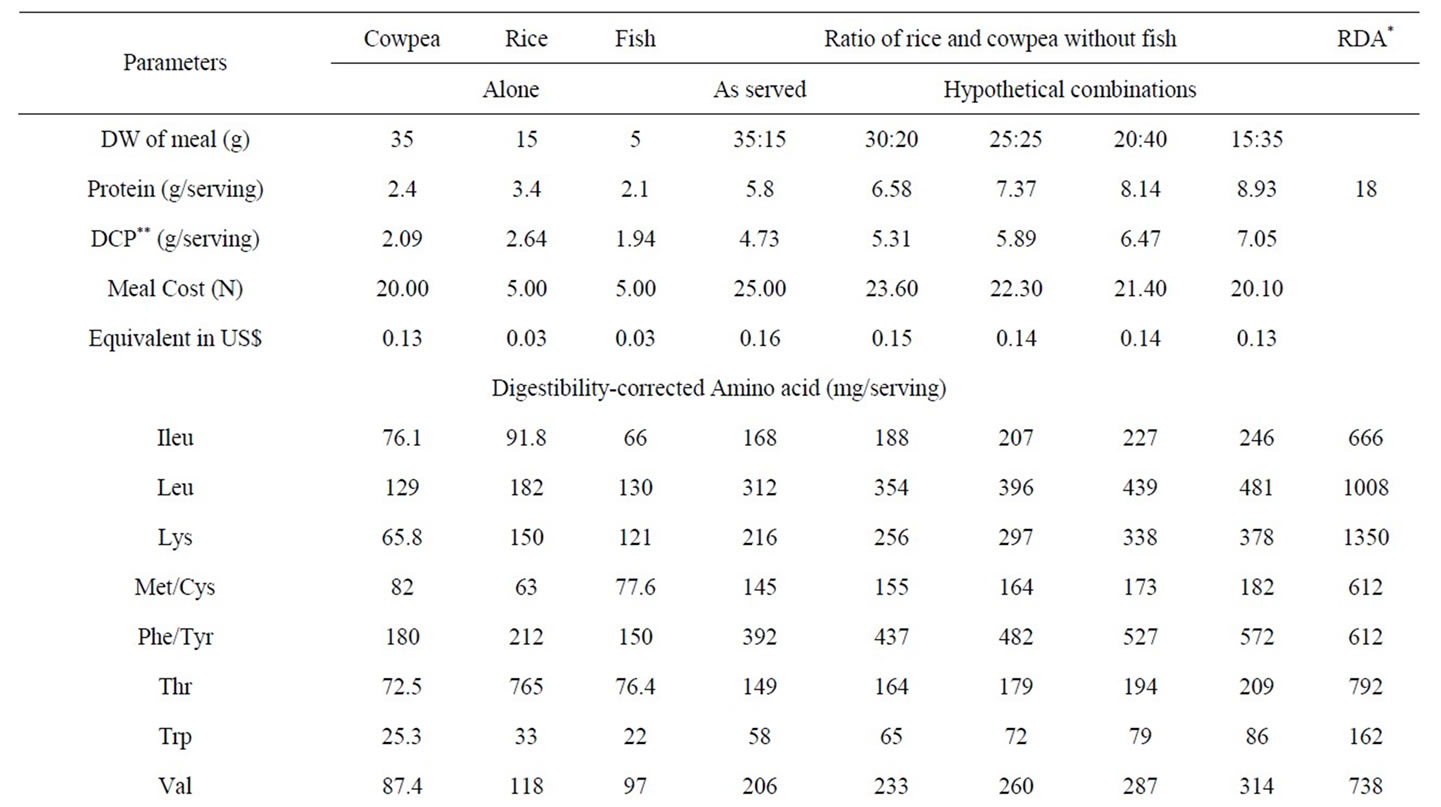
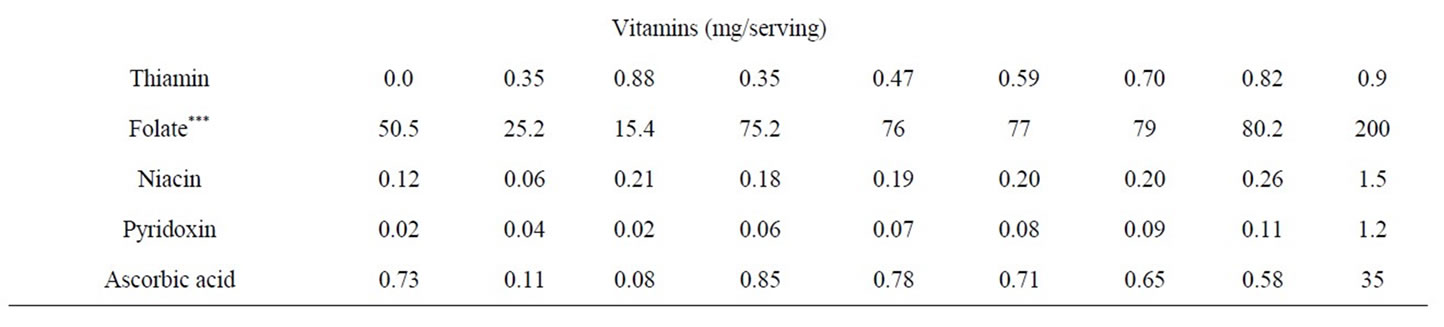
Table 7. Cost analysis and nutrient content of rice and cowpea combinations.
gested that rice and cowpea in ratio 30:70 be served to the school children as this combination will provide maximum nutrient intake at minimum cost. Since the estimated cost of the 30:70 rice: cowpea meal was N20.10 or $0.13; the remaining fund could be better utilized to provide a bigger fish portion, a beverage drink or fruits that complement the vitamin and mineral intake of the school children.
The result presented in Table 8 for cowpea and yam composite meal indicated that the increase in the proportion of yam (the cheaper food component) resulted in lower overall protein and therefore amino acid content, though the cost also reduced. The vitamin content in the combinations followed the same trend as observed for the essential amino acids. Thus, the cowpea and yam meal at 70:30 or 60:40 ratios will be the best for protein, amino acid and vitamin nutriture. It is, however, well known that a combination of two protein sources often give better nutritive value because of the complementation of their protein content [37-39]. Thus, mixing food from different food groups together at a meal could go a long way in solving diet related health diseases. It is therefore important to ensure that the meal combination that would give the pupil the highest nutrient intake and possibly at minimum cost is provided.
4. Conclusions
The findings from this study revealed that the food combinations in the school meals tend towards providing adequate nutrients for the pupils and thus could provide a balanced diet. Cost and nutrient analysis indicated that the yam-cowpea composite meal as served provided the best nutrient composition for the pupils while the rice and cowpea combination would give better nutritional value at 30:70 and at lower cost. Analysis indicated a high nutrient content; however, the size per serving to the pupil seems inadequate; for instance, 2 to 4 gram fish on dry weight basis per serving seems to provide nutrients
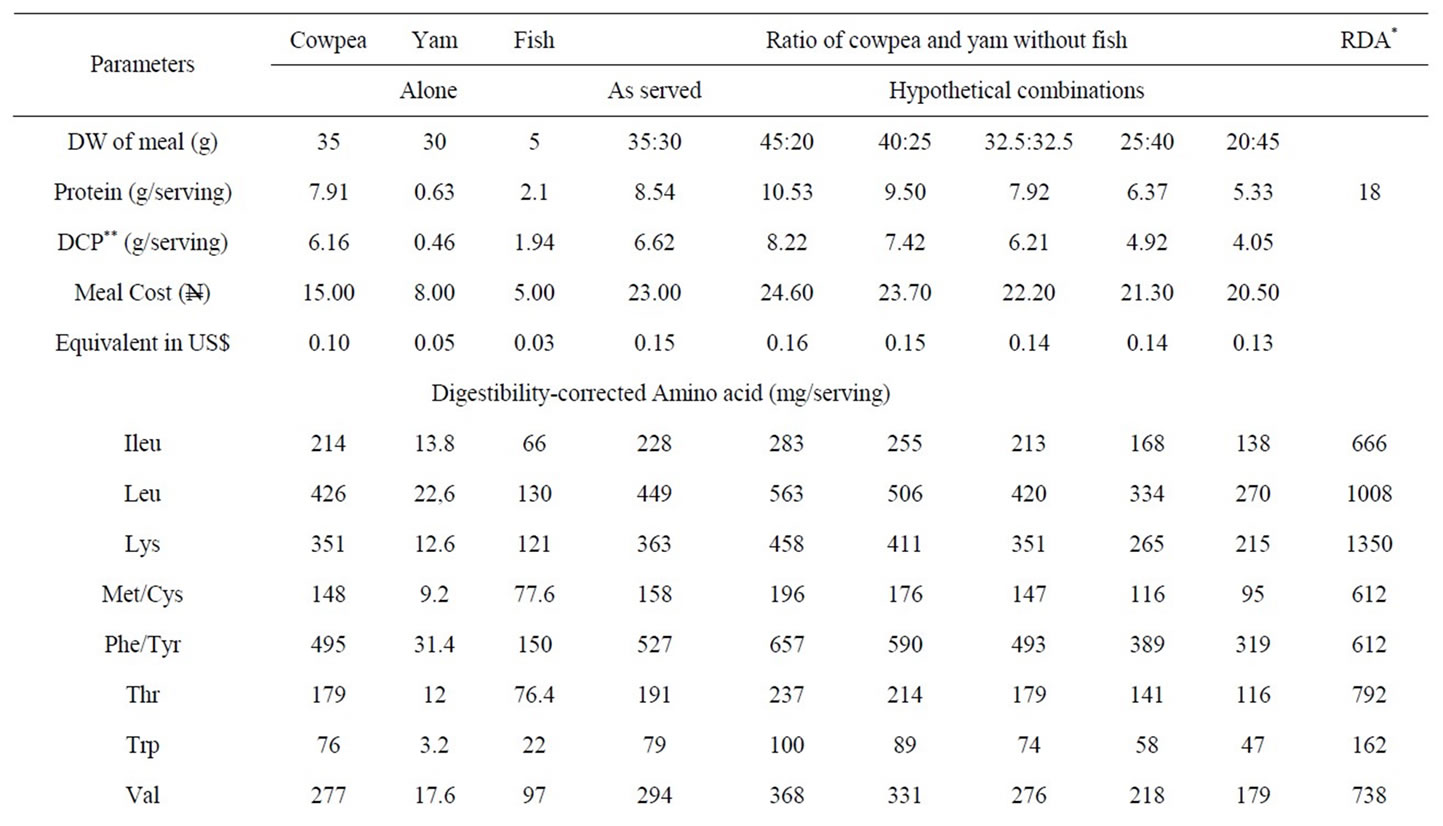
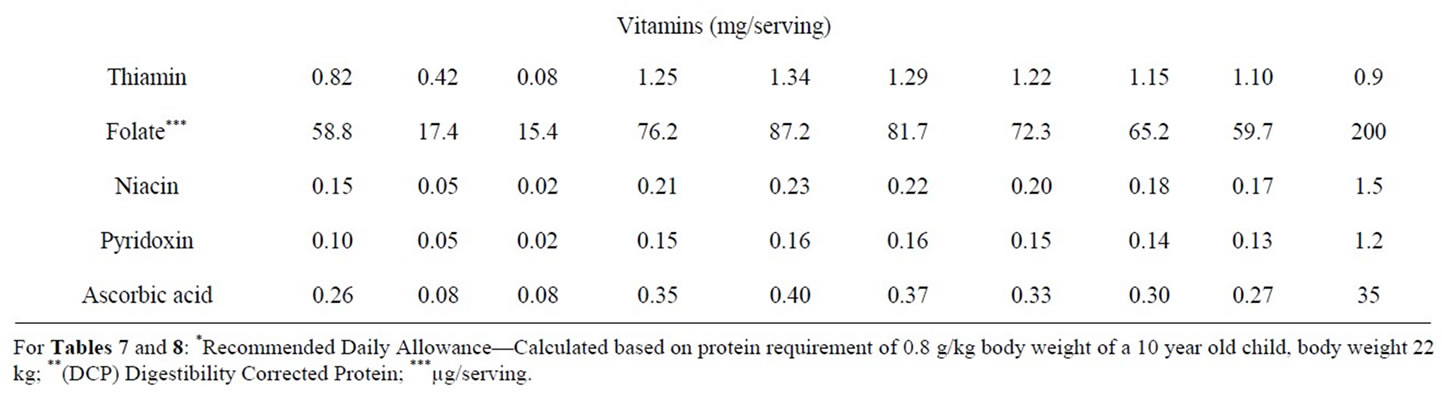
Table 8. Cost analysis and nutrient content of cowpea and yam combinations.
that were grossly inadequate.
In addition, vitamin intake from the school meal was low; hence the inclusion of fresh fruits and vegetables, which are sources of vitamins, in the menu is recommended.
From the finding of this study, the school meal programme could go a long way in solving short-term problems of hunger and malnutrition and provide a solution to long-term nutrition-related health problems among school children in Nigeria. There is a need for further research on an expanded scope to have a comprehensive outlook of the effect of the school feeding programme on the overall nutrition and cognitive development of Nigerian public school pupils so as to advise government on how to improve their well being. In the meantime, we wish to recommend the adoption of the school feeding programme in all the States of Nigeria.
5. Acknowledgements
There is no conflict of interest to be disclosed. The study was funded by the authors and all the authors contributed significantly to the study.
REFERENCES
- Education Cluster, “Position Paper on Emergency School Feeding,” 2009. http//ochaonline.un.org
- WFP, “World Food Programme: School Feeding Reduces Hunger and Improves Education,” 2009. http://www.wfp. org/school
- NEPAD, “New Partnership for Africa’s Development. Home—Grown School Feeding Programme: A Concept,” 2009. http://www.africaunion.org
- C. Power, J. K. Lake and T. J. Cole, “Measurement and Long-Term Health Risks of Child and Adolescent Fatness,” International Journal of Obesity, Vol. 21, No. 7, 1997, pp. 507-526. doi:10.1038/sj.ijo.0800454
- S. B. Halls, “Advanced BMI Calculator of Body Mass Index,” 2009. www.halls:md/body mass index/av.htm
- WHO, “World Health Organization, International Obesity Task Force: Obesity Preventing and Managing the Global Epidemic,” Geneva, 1998.
- WHO, “World Health Organization, Physical Status: The Use and Interpretation of Anthropometry,” World Health Organization Technical Report No 854, Geneva, 1995.
- AOAC, “Official Method of Analysis of the AOAC,” 17th Edition, AOAC International, Gaithersburg, 2000.
- FAO/WHO, “Protein Quality Evaluation,” Report of the Joint FAO/WHO Expert Consultation, FAO Food and Nutrition Paper 51, Bethesda Md., 1991, pp. 26-42.
- S. Khor and E. Tee, “Development of a HPLC Method for the Simultaneous Determination of Several B-Vitamins and Ascorbic Acid,” Malaysian Journal of Nutrition, Vol. 2, No. 1, 1996, pp. 49-65.
- C. S. James, “Analytical Chemistry of Foods,” Mackie Academic and Professionals Ltd., Glasgow, 1996, pp. 135- 148.
- A. Pietrobelli, M. S. Faith, D. B. Allison, D. Gallagher, G. Chiumello and S. B. Heymsfield, “Body Mass Index as a Measure of Adiposity among Children and Adolescents,” Journal of Pediatrics, Vol. 132, No. 2, 1998, pp. 204-210. doi:10.1016/S0022-3476(98)70433-0
- A. R. Sinaiko, R. P. Donahue, D. R. Jacobs and R. J. Prineas, “Relation of Weight and Rate of Increase in Weight during Childhood and Adolescence to Body Size, Blood Pressure, Fasting Insulin, and Lipids in Young Adults. The Minneapolis Children’s Blood Pressure Study,” Circulation, Vol. 99, 1999, pp. 1471-1476.
- S. E. Ballow and W. H. Dietz, “Obesity Evaluation and Treatment, Expert Committee Recommendationsm” Pediatrics, Vol. 102, No. 3, 1998, pp. 1-11.
- G. Ottavio, V. Eleonora, C. Luca, G. Elena, C. Deborah and M. Elena, “Anthropometric Indices of School Children and Familiar Risk Factors,” Preventive Medicine, Vol. 35, No. 5, 2002, pp. 492-498. doi:10.1006/pmed.2002.1098
- A. D. Harris, L. A. Jones, R. V. Heatley and J. Rhodes, “Assessment of Nutritional Status by Anthropometry: A Comparison of Different Standards of References,” Human Nutrition Clinical Nutrition, Vol. 370, 1988, pp. 227- 231.
- NIH, “National Institutes of Health, Clinical Guidelines on the Identification, Evaluation and Treatment of Overweight and Obesity in Adults: The Evidence Report,” Obesity Reviews, Vol. 6, 1998, pp. 51S-210S.
- M. Deurenberg-Yap, G. Schmidt, W. A. Van Staveren and P. Deurenberg, “The Paradox of Low Body Mass Index and High Body Fat Percentage among Chinese, Malays and Indians in Singapore,” International Journal of Obesity, Vol. 24, No. 8, 2000, pp. 1011-1017. doi:10.1038/sj.ijo.0801353
- D. S. Chadha, G. Singh, P. Kharbanda, V. Vasdev and R. K. Ganjoo, “Anthropometry Correlation of Lipid Profile in Healthy Aviators,” Indian Journal of Aerospace Medicine, Vol. 50, No. 2, 2006, pp. 32-36.
- S. A. Bowman S. L. Gortmaker, C. B. Ebbeling, M. A. Pereira and D. S. Ludwig, “Effect of Fast Food Consumption on Energy Intake and Diet Quality among Children in a National Household Survey,” Pediatrics, Vol. 113, No. 1, 2004, pp. 111-120
- C. B. Ebeling, D. B. Pawlak and D. S. Ludwig, “Childhood Obesity, Public Health Crisis: Common Sense Cure,” Lancet, Vol. 360, No. 9331, 2002, pp. 473-482. doi:10.1016/S0140-6736(02)09678-2
- F. Rodríguez-Artalejo, E. L. García, L. Gorgojo, C. Garcés, M. A. Royo, J. M. M. Moreno, M. Benavente, A. Macías and M. De Oya, “Consumption of Bakery Product; Sweetened Soft Drinks and Yoghurt among Children Aged 6 - 7 Years, Associated with Nutrient Intake and Overall Diet Quality,” British Journal of Nutrition, Vol. 89, 2003, pp. 419-428. doi:10.1079/BJN2002787
- F. I. Meredith and W. D. Caster, “Amino Acid Content in Selected Cereals,” Journal of Food Science, Vol. 49, No. 6, 1984, pp. 1624-1625. doi:10.1111/j.1365-2621.1984.tb12863.x
- M. W. Gordon, “Contemporary Nutrition: Issues and Insights,” 5th Edition, McGraw Hill, London, 2003, pp. 250-550.
- USDA, “United States’ Department of Agriculture: National Nutrient Database for Standard Reference,” Release 17, Washington, 2000.
- WHO, “World Health Organization, Energy and Protein Requirements,” Report of Joint FAO/WHO/UNU Expert Consultation Technical Report Series No. 724, Geneva, 1985.
- Z. Anthonio, “Diet Calculator Scientific Psychic 3 - 10,” 2009. http://www.scientificpsychic. com/fitness/diet.html
- J. U. Anazonwu-Bello, “Foods and Nutrition in Practice,” Macmillan Education Ltd. London, 1981, pp. 52-105.
- R. Uauy, M. Olivares and M. Gonzalez, “Essentiality of Copper in Humans,” American Journal of Clinical Nutrition, Vol. 67, 1998, pp. 952S-959S.
- AHLT, “Audio Health Library Topic 2623,” Iron-deficiency Anemia, 2009. http://www.yourhealth.com/audiohealth/t2623.ram
- D. Kelvin and F. Albert, “Effect of Dietary Calcium Intake and Meal Calcium Content on Calcium Absorption in Rats,” British Journal Nutrition, Vol. 76, No. 3, 1996, pp. 463-470. doi:10.1079/BJN19960051
- D. A. McCaroon, “Role of Adequate Dietary Calcium Intake in the Prevention and Management of Salt Sensitive Hypertension,” American Journal of Clinical Nutrition, Vol. 65, No. 2, 1997, pp. 712S-716S.
- J. W. Wordstron, “Trace Mineral Nutrition in the Elderly,” American Journal of Clinical Nutrition, Vol. 36, 1982, pp. 788-795.
- L. M. Klevay and D. B. Milne, “Low Dietary Magnesium Increases Supraventricular Ectopy,” American Journal of Clinical Nutrition, Vol. 75, No. 3, 2002, pp. 550-554.
- R. J. Stoltzfus, “Defining Iron Deficiency Anaemia in Public Health Term: Re-Examining the Nature and Magnitude of the Public Health Problem,” Journal of Nutrition, Vol. 131, 2004, pp. S565-S567.
- M. Friedmann, “Nutritional Value of Proteins from Different Sources; A Review,” Journal of Agricultural and Food Chemistry, Vol. 44, No. 1, 1996, pp. 6-22. doi:10.1021/jf9400167
- A. A. Adegbola and O. L. Oke, “Preliminary Observations on the Value of Leaf Protein-Fish Mixtures as Protein Supplements for Pullets,” Nutrition Reports International, Vol. 8, 1973, pp. 313-318.
- S. R. A. Adewusi and O. L. Oke, “The Effect of Various Levels of Cassava on Protein Utilisation by Rats,” Nutrition Reports International, Vol. 21, 1980, pp. 709-715.
- S. R. A. Adewusi, B. O. Orisadare and O. L. Oke, “Studies on Weaning Diets in Nigeria: 2. Protein Sources,” Plant Food for Human Nutrition, Vol. 42, No. 2, 1992, pp. 183-192.