Food and Nutrition Sciences
Vol. 3 No. 10 (2012) , Article ID: 23390 , 7 pages DOI:10.4236/fns.2012.310185
Post-Therapy Profile of BMI-for-Age of Indian Survivors of Pediatric Acute Lymphoblastic Leukemia and Non-Hodgkin’s Lymphoma
![]()
1Smt. P.N. Doshi Women’s College, S.N.D.T Women’s University, Mumbai, India; 2University Department of Food Science and Nutrition, S.N.D.T Women’s University, Mumbai, India; 3Department of Pharmaceutical Sciences and Technology, Institute of Chemical Technology, Mumbai, India; 4Department of Medical Oncology, Tata Memorial Hospital, Mumbai, India; 5Jaslok Hospital, Mumbai, India.
Email: *agashechanda@rediffmail.com, gokhalechanda@yahoo.co.in, drshobhaudipi@gmail.com, spai2000@yahoo.com, shadvani2000@yahoo.com
Received August 6th, 2012; revised September 6th, 2012; accepted September 13th, 2012
Keywords: Body Mass Index; Children; Indian; Acute Lymphoblastic Leukemia; Non-Hodgkin’s Lymphoma
ABSTRACT
Background: Obesity in pediatric ALL survivors is a well recognized late effect. Hence the present study examines the BMI-for-age of Indian childhood ALL and NHL survivors. Method: A retrospective study of 118 ALL/NHL survivors and 138 age sex matched controls was carried out. From the recorded heights and weights body mass index (BMI) was computed. The survivor data was compared with 138 controls from the data set collected by investigators previously. Results: 82.8% of patients had BMI-for-age in 5th - 84th percentile (healthy) at time of diagnosis and at inclusion in the study. The distribution of survivors and controls according to the BMI percentiles was not significant. However, the mean BMI-for-age for younger patients (3 to 12 years) was significantly higher than mean BMI-for-age of matched controls. Distribution of data by time elapsed from therapy was significant. Overweight/obesity was observed among the survivors who were off therapy for two years with increase in after four years post-therapy. Conclusion: Our preliminary study indicates late effects of therapy and points to the need of long term assessment of the survivors, even though majority of them were within the normal weight range.
1. Introduction
Obesity is a well-recognized effect in survivors of childhood Acute Lymphoblastic Leukemia (ALL). Significant increase in BMI—z scores occurs between diagnosis and therapy completion [1]. Further, prevalence of obesity is also observed in adulthood [1].
Various factors have been associated with development of obesity, including cranial irradiation [1]. CRT is associated with significantly greater rates of BMI gain over time. This association is observed in both male and female survivors, with the association being most pronounced among women who received CRT during the first decade of life [2,3]. Also high dose ≥20 Gy is associated with an increased prevalence of obesity [3].
Radiotherapy can damage hypothalamus leading to hormonal deficiency and hypothalamic dysregulation of food intake control [3]. CRT received at a young age may blunt hypothalamic leptin sensitivity and thereby alter the body’s response to leptin and the regulation of body weight, metabolism, and reproductive function [3]. Two recent studies have reported about significantly higher leptin levels in survivors of ALL treated by CRT [4,5]. Hence, there may be a possibility of radiation-induced hypothalamic resistance to leptin. It is reported that a negative correlation was found between leptin and soluble leptin receptor levels suggesting negative feedback between the two peptides. Impaired receptor function (in the context of macrophage/inflammatory reactions) caused by radio/chemotherapy may be the reason of leptin resistance [5].
Childhood survivors of ALL treated without cranial irradiation are also at risk of BMI increase, which persist into follow-up, with females appearing particularly susceptible [6]. Risk for chemotherapy-related weight gain applies predominantly to children who begin ALL therapy within a normal weight range [7]. Chemotherapy, especially corticosteroids in large doses contribute to development of obesity. Glucocorticoid treatment causes an increased adiposity by suppressing growth hormone secretion [8]. Corticosteroids causes resistance to leptin [9]. Corticosteroids administered can promote obesity via a range of possible mechanisms: effects on appetite/regulation of energy intake; alteration in substrate oxidation like increased gluconeogenesis, changes in fat metabolism and distribution and alterations in energy expenditure [10].
Individual and genetic factors may affect the effects of glucocorticoids on weight In fact; a selective polymerphism in the glucocorticoid receptor gene may increase the sensitivity to glucocorticoid effects, including weight gain [11].
Besides the treatment related factors lifestyle factors do contribute to development of obesity. During treatment, patients usually undergo changes in their routine lifestyle. Increased energy intake and reduced habitual physical activity are commonly considered the main responsible factors of weight gain. The loss of physical activity may start during the hospitalization of the patient. It may be due to a number of factors, including diminished exercise capacity, impaired motor function, diminished interest in recreational activity and over-protectiveness of the child’s primary caregivers. Pathophysiological changes in the cardiorespiratory system or growth hormone insufficiency might also contribute to reduce physical activity as well as the presence of steroid-related myopathy and vincristine-related neuropathy [11].
In the past, treatment results in Indian children with ALL have been poor, primarily due to inadequate chemotherapy and supportive care, but perhaps reflecting differences from Western countries in the pattern of subtypes. In an attempt to improve survival, a more intensive treatment protocol, MCP 841 and MCP 842 was implemented at Tata Memorial Hospital since June of 1986. Although the study examined prognostic factors, complete remission and event free survival rates achieved represent a significant improvement [12].
In view of the improved survival rates of pediatric ALL in India we performed preliminary analysis of the data retrospectively on the survivors who were treated in the hospital during the decade—1988 to 1998.
2. Materials and Methods
The study was approved by the Tata Memorial Hospital, and the Research Committee of the S.N.D.T Women’s University.
Participants: Survivors. The survivors were a cohort of children treated for Acute Lymphoblastic Leukemia [ALL] or Non-Hodgkin’s Lymphoma [NHL] at Tata Memorial Hospital during the period from 1988 to 1998. These children attended the out-patients department clinic [OPD clinic] for follow-up on completion of treatment. Patients who had completed therapy, were healthy, and aged between 3 to 15 years were included in the present study. The sample consisted of 118 participants.
Patients with ALL or NHL were treated with specific drug and radiation/drug combination protocol. The drug protocol-MCP 841 used for ALL and MCP-842 used for NHL was designed in collaboration with National Cancer Institute [NCI], Bethesda, USA [11]. The protocol is given in Table 1.
MCP-841 protocol is more intense and of longer duration (two years) as compared to MCP-842 protocol which is a short course intense protocol. MCP-841 protocol involves cranial irradiation and multiagent chemotherapy regimen whereas MCP-842 protocol includes alternating cycle multiagent chemotherapy regimen. MCP-841 is used to treat ALL while MCP-842 protocol is used for treatment of pediatric large-cell lymphomas and Burkitt’s lymphomas.
The patient characteristics are presented in Table 2.
Participants: Controls. The previous data collected by the investigators during that time (1998) was used for present study. Data for 138 controls selected from 4 schools in Mumbai city was selected for the present

Table 1. Protocol MCP (841) and MCP (842) treatment regimen.

Table 2. Characteristics of study group.
study. The matching was done by groups. The age distribution of control and experimental groups were same with plus or minus six months for mean age. All children were healthy, with no evidence of any minor or major ailments including infections during data collection done previously.
Data Collection. A written parental consent was obtained for each subject before recruitment.
Anthropometry. Height and weight were recorded using standard techniques. Body mass index [BMI]-for-age and BMI z score for each child was calculated. Children were categorized for BMI-for-age percentiles based on normative data from Centre for Disease Control [CDC] growth charts.
The task force of Indian Association of Pediatrics has recommended of using NCHS/CDC growth charts to analyze the data for Indian children [12]. Based on the calculated percentiles the subjects were categorized as underweight (<5th percentile), healthy weight (5th - 84th percentile), overweight (85th - 94th percentile) and obese (≥95th percentile). The data was analyzed to compare the BMI-for-age of the survivors of pediatric leukemia and allied disorders, with healthy age and sex-matched controls.
Statistical Analysis. The subjects were grouped into five age categories: 3 to 6 years, 6.1 to 9 years, 9.1 to 12 years, 12.1 to 15 years, and 15.1 to 17 years as per their age at time of inclusion in the study.
Student’s-test [independent], Chi-Square test was performed using SPSS version 6 and 10 for Windows.
3. Results
Distribution of children by age and sex did not vary significantly between patient and control groups as indicated by Chi-Square test.
3.1. Comparison of BMI-for-Age of Survivors at Time of Diagnosis and at Inclusion in Study
Data at two time points for 105 children was available. 82.8 % (n = 85) were healthy at time of diagnosis and were healthy at time of inclusion in study (5th - 84th percentile). 9.7% (n = 9) and 7.5% (n = 7) of children who were healthy at diagnosis became overweight and obese respectively. At diagnosis only one child was underweight and was healthy at inclusion. Out of 7 children who were overweight at diagnosis, 5 children (71.4%) belonged to normal weight category at time of inclusion. Only one child was in over weight and obese categories at inclusion (14.3%) respectively. Out of 4 children who were obese at diagnosis, 2 (50.0%) were in healthy category at inclusion only one child was in overweight and obese category (25%) respectively. The distribution representing a two-time point comparison was not significant (Table 3).
3.2. Comparison of BMI-for-Age of Survivors and Controls
In all age groups, the mean value of BMI-for-age of survivors was higher than the controls of same age group, although statistically significant differences were observed in three out of five age groups, 3 - 6 years (t = 4.6, p = 0.001), 6.1 - 9 years (t =3.3, p = 0.01) and 9.1 - 12 years age groups (t = 4.4, p = 0.001) (Table 4).
Distribution of subjects according to BMI percentiles indicated that majority of subjects had weight within the normal range that is between 5th - 84th percentile. The difference in the distribution was not statistically significant (Table 5).
No significant difference was observed between male and female survivors in percentile distribution of BMIfor-age. Classification of BMI-for-age of survivors by age at diagnosis in the study did not indicate any significant difference in the distribution.
Classification of BMI-for-age of survivors by treatment modalities indicated that the treatment did not significantly influence BMI-for-age of survivors (Table 6).
Classification of BMI-for-age of survivors by time elapsed after therapy indicated that although overweight/ obesity was observed in small percent of survivors at last treatment phase, majority of survivors were in normal

Table 3. Percentile BMI at diagnosis and percentile BMI at inclusion in study.

Table 4. BMI-for-age of subjects.

Table 5. Distribution of subjects according to BMI percentiles.

Table 6. Treatment wise distribution of subjects.
weight category (78.9%). Among the survivors who had completed therapy one year back (92.9%) were healthy and none were obese, although a small percent were overweight (7.1%). This percentage increased as the time interval increased to two years. Overweight and obesity was observed in survivors who were off therapy for more than two years and 50% of the patients who had completed more than four years since therapy were overweight and obese. Chi square test indicated that this distribution was statistically significant (Chi-Square test c value = 16.30, p = 0. 038) (Table 7).
4. Discussion
This is perhaps the first Indian study which reports on body mass index of ALL/NHL survivors. Obesity in pediatric ALL survivors from developed countries is well documented. However, our study is of particular significance as the study is from developing country like India.
The main findings of our study are:
1) Majority of survivors had BMI-for-age within the normal range at completion of therapy indicating that treatment related weight gain had not occurred;
2) Even at later stages a higher percent of survivors were in normal weight category although as the time elapsed after therapy increased we observed a significantly increased percentage of overweight/obese survivors.
Our results are different form those reported in literature which state that patient groups with ALL proceed from normal weight status or mild underweight at diagnosis to overweight or obesity by the end of treatment The prevalence of obesity increases 5- to 10-fold during treatment for ALL regardless of whether CRT was used, so that obesity prevalence is extremely high at the end of treatment and most patients, including those who do not become obese, show substantial and rapid excess weight gain during treatment [13].
An earlier Indian study on pediatric ALL reported that malnutrition existed in significant proportion of children in ALL. 88% of children were malnourished at time of diagnosis [14]. Our results show that only one child was malnourished at diagnosis. Perhaps our survivor group was form higher socioeconomic strata and so children may be well nourished at time of treatment.
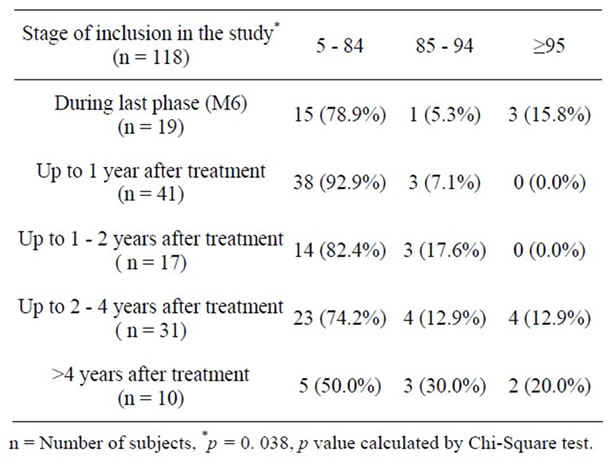
Table 7. Distribution of patients by stage of inclusion.
Our results suggest of marginal incidence of overweight on completion of therapy. It is reported that the first year after cessation of therapy is the time of excessive weight gain with 35% children being overweight and 12% being obese [15]. We report that 7.1% of children were overweight at completion of therapy, but none of the survivors were obese during the first year.
We found that among the survivors who were off therapy for more than two and up to four years, a small percent of the survivors were overweight and obese. The percentage increased after four years after completion of therapy. Although the number of survivors in this category was small, our study suggests that obesity may occur later. In a cohort of ALL survivors after a median follow-up of 7.2 years (range 2 - 17.5 years), overweight and obesity was the most common late effect [16]. Difference exists between occurrence of obesity in radiated and non radiated patients. 48 % of children who had received cranial irradiation were obese as compared to 21% of patients who did not receive cranial irradiation [17]. We observed that survivors treated with radiation and chemotherapy were overweight and obese while survivors treated with chemotherapy were overweight but none were obese.
The prevalence of overweight in Indian children is estimated to be 12.64% (95%, CI 8.48% - 16.80%) and that of obesity to be 3.39% (95%, CI 2.58% - 4.21%) [18]. Overweight and obesity in school children belonging to affluent class ranged from 8.5% - 29.0% and from 1.5% - 7.4% respectively is reported in another study [19]. The percentage of controls and survivors who were overweight or obese in present study were within the range reported by other researchers although compared to matched controls the percent was marginally higher. Further, comparison of our data with matched controls indicated that the younger groups of survivors had significantly higher mean BMI-for-age than matched controls. It may be related to premature adiposity rebound due to treatment [20].
Our study thus brings forth that percentage of overweight and obesity in our survivor group was marginally high, was found in younger age groups and occurs later after completion of therapy.
Various possible causes for overweight and obesity are suggested. One cause is damage to hypothalamus—pituitary region as a result of CNS radiation. The damage may alter appetite regulation, may cause leptin resistance, or may lead to growth hormone deficiency. Alternately chemotherapy may also impair growth hormone secretion. Early adiposity rebound attributed to radiation could also be a cause of overweight and obesity.
The other possible cause is the reduced physical activity leading to a reduction in energy expenditure which may be the result of subtle psychological effects of cranial irradiation. This affects motivation drive. Also maximal aerobic capacity is reduced, signifying a lower level of physical fitness [21]. Since majority of our children that is 73% were treated with radiation this aspect warrants further investigation.
A recent study reports about body mass index (BMI) for age having a significant correlation with several measures of insulin resistance, including fasting insulin, HOMA index, Matsuda index and insulin AUC [22]. Also high BMI was identified as a new significant risk factor for osteonecrosis [23]. In view of these findings it becomes important for the continuous follow up of the survivors.
The limitation of the present study is that we had very few survivors who had completed therapy for more than four years ago. Hence although we found a trend of increased percent of overweight and obese survivors, it was difficult to conclude affirmatively on late changes occurring in BMI.
The present study focuses the need for a longitudinal follow-up study that will help to track the changes in BMI. This will help to plan interventions. In a developing country like India, follow-up of subjects often is difficult mainly due to reasons beyond control. This includes ignorance about the importance for follow-up, residing too far from place of treatment, and, for personal reasons not being able to come to hospital for follow-up. Counseling of patient’s parents/caregivers and later patients themselves may be a solution for overcoming poor participation.
Our preliminary study indicates late effects of therapy and points to the need of long term assessment of the survivors, even though majority of them were within the normal weight range. Continuous assessment is possible with survivors’ support for which counseling the survivors and their parents and caregivers also is equally important along with the assessment.
5. Acknowledgements
The authors are grateful to Talwar Research Foundation, New Delhi, for providing fellowship to Chanda Gokhale.
REFERENCES
- C. A. Sklar, A. C. Mertens, A. Walter, D. Mitchell, M. E. Nesbit, M. O’Leary, R. Hutchison, A. T. Meadows and L. L. Robison, “Changes in Body Mass Index and Prevalence of Overweight in Survivors of Childhood Acute Lymphoblastic Leukemia: Role of Cranial Irradiation,” Medical and Pediatric Oncology, Vol. 35, No. 2, 2000, pp. 91-95. doi:10.1002/1096-911X(200008)35:2<91::AID-MPO1>3.0.CO;2-G
- E. G. Garmey, Q. Liu, C. A. Sklar, L. R. Meacham, A. C. Mertens, M. A. Stovall, Y. Yasui, L. L. Robison and K. C. Oeffinger, “Longitudinal Changes in Obesity and Body Mass Index among Adult Survivors of Childhood Acute Lymphoblastic Leukemia: A Report from the Childhood Cancer Survivor Study,” Journal of Clinical Oncology, Vol. 26, No. 28, 2008, pp. 4639-4645. doi:10.1200/JCO.2008.16.3527
- K. C. Oeffinger, A. C. Mertens, C. A. Sklar, Y. Yasui, T. Fears, M. Stovall, T. A. Vik, P. D. Inskip and L. L. Robison, “Obesity in Adult Survivors of Childhood Acute Lymphoblastic Leukemia: A Report from the Childhood Cancer Survivor Study,” Journal of Clinical Oncology, Vol. 21, No. 7, 2003, pp. 1359-1365. doi:10.1200/JCO.2003.06.131
- C. Papadia, L. A. Naves, S. S. S. Costa, J. A. R. Vaz, L. Domingues and L. A. Casulari, “Incidence of Obesity Does Not Appear to Be Increased after Treatment of Acute Lymphoblastic Leukemia in Brazilian Children: Role of Leptin, Insulin and IGF-I,” Hormone Research, Vol. 68, No. 4, 2007, pp. 164-170. doi:10.1159/000100781
- S. Skoczen, P. J. Tomasik, M. Bik-Multanowski, M. Surmiak, W. Balwierz, J. J. Pietrzyk, K. Sztefko, J. Gozdzik, D. Galicka-Latała and W. Strojny, “Plasma Levels of Leptin and Soluble Leptin Receptor and Polymorphisms of Leptin Gene-18G > A and Leptin Receptor Genes K109R and Q223R, in Survivors of Childhood Acute Lymphoblastic Leukemia,” Journal of Experimental & Clinical Cancer Research, Vol. 30, 2011, p. 64. doi:10.1186/1756-9966-30-64
- E. J. Chow, C. Pihoker, K. Hunt, K. Wilkinson and D. L. Friedman, “Obesity and Hypertension among children After Treatment for Acute Lymphoblastic Leukemia,” Cancer, Vol. 110, No. 10, 2007, pp. 2313-2320. doi:10.1002/cncr.23050
- J. Baillargeon, A. M. Langevin, M. Lewis, J. J. Grady, P. J. Thomas, J. Mullins, J. J. Estrada, A. Pitney, N. Sacks and B. H. Pollock, “Therapy-Related Changes in Body Size in Hispanic Children with Acute Lymphoblastic Leukemia,” Cancer, Vol. 103, No. 8, 2005, pp. 1725-1729. doi:10.1002/cncr.20948
- I. Màrky, L. Mellander, B. Lannering and K. AlbertssonWikland, “A Longitudinal Study of Growth and Growth Hormone Secretion in Children during Treatment for Acute Lymphoblastic Leukemia,” Medical and Pediatric Oncology, Vol. 19, No. 4, 1991, pp. 258-264. doi:10.1002/mpo.2950190409
- J. H. Davies, B. A. Evans, E. Jones, W. D. Evans, M. E. Jenney and J. M. Gregory, “Osteopenia, Excess Adiposity and Hyperleptinaemia during 2 Years of Treatment for Childhood Acute Lymphoblastic Leukaemia without Cranial Irradiation,” Clinical Endocrinology, Vol. 60, No. 3, 2004, pp. 358-365.
- L. Iughetti, P. Bruzzi, B. Predieri and P. Paolucci, “Obesity in Patients with Acute Lymphoblastic Leukemia in Childhood,” Italian Journal of Pediatrics, Vol. 38, No. 4, 2012. doi:10.1186/1824-7288-38-4
- S. Advani, S. Pai, D. Venzon, M. Adde, P. K. Kurkure, C. N. Nair, B. Sirohi, S. D. Banavali, R. Hawaldar, B. B. Kolhatkar, T. Vats and I. Magarth, “Acute Lymphoblastic Leukemia in India: An Analysis of Prognostic Factors Using a Single Treatment Regimen,” Annals of Oncology, Vol. 10, No. 2, 1999, pp. 167-176. doi:10.1023/A:1008366814109
- S. Bhave, A. Bavdekar and M. Otiv M, “IAP National Task Force for Childhood Prevention of Adult Diseases,” Indian Pediatrics, Vol. 41, No. 6, 2004, pp. 559-575.
- J. J. Reilly, “Obesity during and after Treatment for Childhood Cancer,” In: W. H. B. Wallace and C. J. H. Kelnar, Eds., Endocrinopathy after Childhood Cancer Treatment, Endocr Dev. Basel, Karger, 2009, pp 40-58. doi:10.1159/000207609
- R. Kumar, R. K. Marwaha, A. K. Bhalla and M. Gulati, “Protein Energey Malnutrition and Skeletal Muscle Wasting in Childhood Acute Lymphoblastic Leukemia,” Italian Journal of Pediatrics, Vol. 37, No. 7, 2000, pp. 720- 726.
- P. Zee and C. H. Chen, “Prevalence of Obesity in Children after Therapy for Acute Lymphoblastic Leukemia,” American Journal of Pediatric Hematology/Oncology, Vol. 8, No. 4, 1986, pp. 294-299. doi:10.1097/00043426-198624000-00005
- S. Pakakasama, G. Veerakul, D. Sosothikul, S. O. Chainansamit, V. Laosombat, P. Thanarattanakorn, R. Lumkul, S. Wiangnon, S. Wangruangsathit, N. Narkbunnam and S. Kanjanapongkul, “Late Effects in Survivors of Childhood Acute Lymphoblastic Leukemia: A Study from Thai Pediatric Oncology Group,” International Journal of Hematology, Vol. 91, No. 5, 2010, pp. 850-854. doi:10.1007/s12185-010-0594-9
- E. I. Mayer, M. Reuter, R. E. Dopfer and M. B. Ranke, “Energy Expenditure, Energy Intake and Prevalence of Obesity after Therapy for Acute Lymphoblastic Leukemia during Childhood,” Hormone Research, Vol. 53, No. 4, 2000, pp. 93-99. doi:10.1159/000023566
- T. Midha, B. Nath, R. Kumari, Y. K. Rao and U. Pandey, “Childhood Obesity in India: A Meta-Analysis,” Indian Journal of Pediatrics, Vol. 79, No. 7, 2012, pp. 945-948. doi:10.1007/s12098-011-0587-6
- G. Srihari, A. Eilander, S. Muthayya, A. V. Kurpad and S. Seshadri, “Nutritional Status of Affluent Indian School Children: What and How Much Do We Know?” Italian Journal of Pediatrics, Vol. 44, No. 3, 2007, pp. 204-213.
- J. J. Reilly, A. Kelly, P. Ness, R. Ahmad, W. Dorosty, H. B. Wallace, B. E. S. Gibson, P. P. M. Emmett and the ALSPAC Study Team, “Premature Adiposity Rebound in Children Treated for Acute Lymphoblastic Leukemia,” Journal of Clinical Endocrinology & Metabolism, Vol. 86, No. 6, 2001, pp. 2775-2778. doi:10.1210/jc.86.6.2775
- J. T. Warner, “Body Composition, Exercise and Energy Expenditure in Survivors of ALL,” Pediatric Blood and Cancer, Vol. 50, No. 2, 2008, pp. 456-461. doi:10.1002/pbc.21411
- S. Lowas, S. Malempati and D. Marks, “Body Mass Index Predicts Insulin Resistance in Survivors of Pediatric Acute Lymphoblastic Leukemia,” Pediatric Blood Cancer, Vol. 53, No. 1, 2009, pp. 58-63. doi:10.1002/pbc.21993
- R. A. Niinimäki, A. H. Harila-Saari, A. E. Jartti, R. M. Seuri, P. V. Riikonen, E. L. Pääkkö, M. I. Möttönen and M. Lanning, “High Body Mass Index Increases the Risk for Osteonecrosis in Children with Acute Lymphoblastic Leukemia,” Journal of Clinical Oncology, Vol. 25, No. 12, 2007, pp. 1498-1504. doi:10.1200/JCO.2006.06.2539
NOTES
*Corresponding author.