Food and Nutrition Sciences
Vol. 3 No. 4 (2012) , Article ID: 18479 , 10 pages DOI:10.4236/fns.2012.34061
Proximate Composition, Mineral and Vitamin Content of Some Wild Plants Used as Spices in Cameroon
![]()
1Department of Agriculture, Livestock and By-Products, University of Maroua, Maroua, Cameroon; 2Department of Biological Sciences, Faculty of Science, University of Ngaoundere, Ngaoundere, Cameroon; 3Department of Food Science and Nutrition, University of Ngaoundere, Ngaoundere, Cameroon; 4Laboratoire d’Ingénierie et des Biomolécules (LiBio), Nancy-Université, Nancy, France; 5CIRAD, Montpellier, France.
Email: njintang@yahoo.fr
Received May 25th, 2011; revised September 20th, 2011; accepted September 30th, 2011
Keywords: Spices; Proximate Composition; Minerals; Vitamins
ABSTRACT
The aim of this work was to contribute to our knowledge of the proximate composition, mineral and vitamin content of 20 edible wild plants used as spices in Cameroon. The plant species were collected from 3 different markets in the West Region of Cameroon and analysed for their content of crude proteins, and lipid, ash, moisture, available sugars, total phenols, carotenoids, minerals (Ca, Zn, K, Na, Mg, Al, Mn, Cu and Se), and vitamins (A, E and C) as well as for their pH and colour. Results revealed that all the plants were low in moisture (7.7 to 10.5 g/100g) but high in ash content (7.7 to 10.5 g/100g). Hua gabonii (bark) (1594.5 mg/100g) was relative source of calcium, Echinops giganteus (206.4 mg/100g) exhibited the highest level of iron and Scorodophleus zenkeri (310.0 µg/100g) the highest level of selenium. Generally all the plants were found to contain low levels of Zn, Cu and Mg. Wide variations were observed for the proteins and available sugars among the samples. The lipid content of some of the plants were surprisingly relatively high as was the case with Monodora myristica (53.4 g/100g), Xylopia aethiopica (33.7 g/100g), Fagara leprieuri (32.1 g/100g), and Aframomum daniellii (23.1 g/100g). All the plants were rich in phenols, carotenoids, vitamin E and C. They are dark in colour and in solution they tended to provoke a fair acidification.
1. Introduction
Spices refer to all of the edible parts of a plant used for flavoring or coloring foods, including fruit, seed, root, bark or vegetable substance [1]. Some are often used as preservative against the action of harmful bacteria or prevents their growth [2]. Actually the specific uses of spices tend to vary considerably among cultures and countries: medicine, religious rituals, cosmetics, perfumery, and foods. As food, they have been shown to play an important role in health partially as sources of nutrients [3,4]. From a nutritional view point research attention on spices conducted mostly but not exclusively in India and neighbouring countries has given rise to our knowledge of the volatile oils and vitamin and mineral contents [5,6]. Of interest also has been to report of some spices as sources of polyunsaturated fatty acids as is the case with Ricinodendron heudoleutii [7] or Black curmin oil which is subject to commercial transaction and scientific research [4].
The forest zone of Central Africa region is a rich source of a wide variety of spices but most of which has hardly been studied from the view point of its proximate composition and nutritional profile. Previous works on this aspect have revealed the potential of some spices as lipid, proteins or minerals sources [7,8]. However these studies were limited in terms of the types of spices studied. In the present study a total of 20 spices identified as common ingredients in the preparation of some common meals in Cameroon earlier shown to be potential sources of antioxidants and health useful polyphenols [9] were analysed to bridge the wide knowledge gap on their nutritional potential especially with regards their proximate composition, vitamin (carotenoids, Vitamin C and E) and mineral content.
2. Materials and Methods
2.1. Selection of Sample
Samples were purchased from specific markets in Bafoussam, Douala and Bangangte—Cameroon, famous for their trade in wild plants. The common scientific and family names of plants species are indicated in Table 1. Each spice sample was cleaned of debris, sorted, graded, trimmed and ground to a fine powder using a culatti grinder (Polymix, France) fitted with a 500 µm mesh. Each ground sample was then sealed in polyethylene plastic and stored at 4˚C in a refrigerator until needed for analysis.
2.2. Proximate Analysis
Analyses of spices for crude protein, non protein nitrogen, ash and moisture contents were carried out essentially according to the standard AOAC methods [10]. Flour samples were acid-hydrolyzed, and the reducing sugar known as available carbohydrates was determined by the dinitrosalicylic acid (DNS) method as described by Fisher and Stein [11].
For the determination of lipid content, the cold extraction method was used [12]. Following this procedure, 50 g of spice powder samples were introduced in volumetric flacks containing 300 mL of a mixture of chloroform/ methanol (200 mL/100mL) and mixed for 20 min using an agitator. The mixture was filtered under N2 and the residue re-extracted in 200 mL of the same solvent and filtered. The extracts were then mixed and allowed to separate after the addition of 0.2 mL of NaCl solution 0.7 g/100mL. The lipid in the lower phase solution was flushed out and recovered by rotary evaporation at 50˚C under liquid Nitrogen. The flasks containing the extracted oil were weighed and the difference in weight expressed as percentage oil content.
2.3. Determination of Minerals Content
Samples of the spices powders (2.5 g) were weighed out into beakers and ashed at 550˚C overnight. The resulting white-ash residue was dissolved in 4 mL of concentrated hydrochloric acid and filtered into a 10 mL volumetric flask and the volume made up with distilled water. The resulting extract was then subjected for the analysis of their content of specific major minerals. Analyses were performed in duplicate. Iron (Fe) was determined with an ICP-OES [13]. The experimental conditions of the ICP-OES were: instrument ICP-OES (Varian-Vista), RF
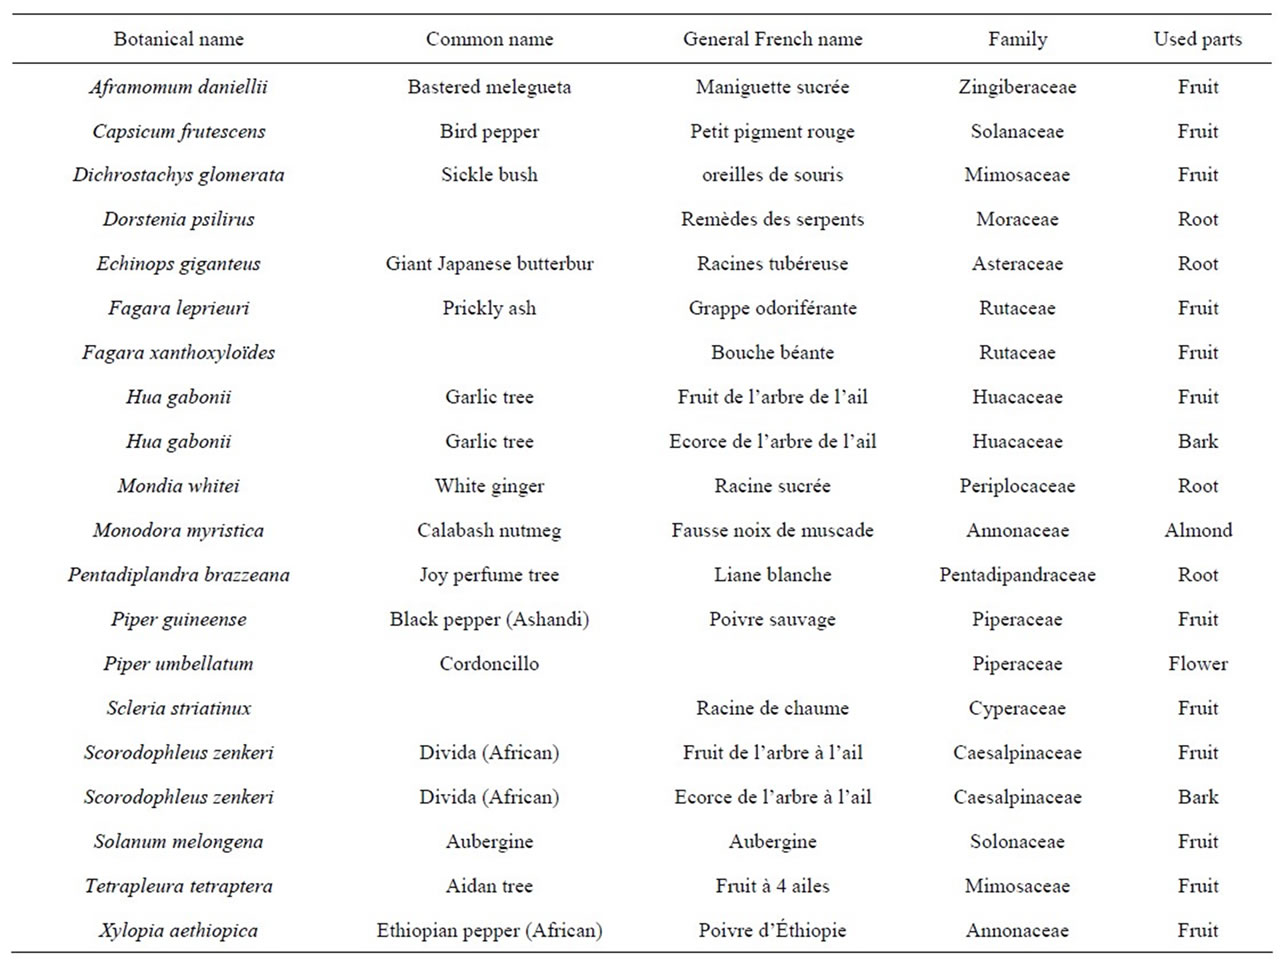
Table 1. Name and parts of the spices used in the study.
Power 0.7 - 1.5 kw (1.2 - 1.3 kw for Axial), Plazma gas flow rate (Ar) 10.5 - 15 L/min (radial) 15 L/min (axial), auxiliary gas flow rate (Ar) b1.5 L/min, Viewing height 5 - 12 mm, copy and reading time 1 - 5 s (max 60 s), copy time 3 s (max 100 s). The other elements Na, K, Mn, Mg, Ca, Zn and Cu were determined by atomic absorption spectrophotometer (Pharmacia biotech Ultraspec 4000) [14].
For the determination of selenium content, the mineralization of the powder (1g) in closed system was carried out by acid digestion [2 mL, HNO3 + HCl (1/1)] in a furnace microwave and the solutions obtained were analyzed for selenium content with a ICP-CCC equipment (Varian vista) equipped with the Coupled Charge Device detector [13]. Standard curves made from known concentrations of selenium were used for this purpose.
2.4. Vitamin and Phenols Analysis, pH-Buffering Capacity and Colour Measurement
Vitamin A precursor and vitamin E were evaluated on oil extracts by spectrophometry as previously described with some modifications [15,16]. In this respect, 0.1 g of oil extracted from each powdered sample as described above, was diluted in an acetone/hexane mixture (70/30; v/v) and total carotenoid and vitamin E determination carried out on an aliquot by measuring absorbance at 470 nm and 270 nm respectively, in a Genesis-5 Spectronic spectrophotometer (Rochester, NY) against a blank sample (solvent). Standard curves made with pure vitamin A and vitamin E were used for this purpose and the results expressed as mg vitamin A equivalent or mg vitamin E equivalent per 100 g dried powder sample.
Vitamin C was analyzed by titration as previously described with some modifications [17]. In this procedure, 2 g of each sample was dissolved in a 25 mL volumetric flask containing 20 mL of distilled water. After mixing for 10 min using an agitator, the mixture was titrated with 2,6 dichloro phenol indophenol solution using phenolphthalein as indicator. A standard sample of ascorbic acid (0.1 mg/100mL) was used as reference and the results expressed in mg vitamin C/100g of dry powder.
Total phenolic content was determined following the Folin-Ciocalteu method using gallic acid as standard [18]. The pH-buffering capacity was evaluated for different water suspension of powders. In this respect 1 g of each individual sample was dissolved in 50 mL of deionised water and homogenised using an agitator for 10 min. The pH of the solution was then read with a pH-meter (Checker pH Tester, Hanna Instruments).
Colour measurements of flour samples were carried out using a portable tintometer (Lovibond RT Colour Measurement Kit V2.28) with a 10˚ observer window and a D-65 light source. The color values generated by the equipment were expressed as L—(whiteness or darkness), a—(redness/greenness) and b—(blueness/yellowness).
2.5. Statistical Analysis
Analyses were performed in triplicate and variation in the samples was routinely less than 10%. Mean values and standard deviations were calculated for each plant using the values obtained from three locations. Data obtained were subjected to one way analysis of variance. Differences between means were verified using the Duncan multiple range test at significant level P = 0.05 using Statgraphics 3.0 (Manugistics, Rockville, Maryland, USA) statistical software.
3. Results and Discussion
3.1. Proximate Composition
The proximate compositions of plants samples are shown in Table 2. The moisture content of plants was found to range from 7.7 g/100g for M. myristica to 10.5 g/100g for M. Whitei, which makes them more stable during storage and packaging. Similar low moisture contents (8 - 14 g/100g) have been reported on some of these spices [8]. The ash content oscillated between 7.7 g/100g and 10.5 g/100g—a range that is much higher than that (2 - 9 g/100g) reported earlier [8]. These differences may probably reflect the difference in the origin and varieties of samples.
Compared to other foodstuffs, the edible plants analyzed could be considered all as good sources of minerals. In fact the values are high compared to data reported in the literature for leguminous seeds (3.7 - 4.4 g/100g) [19], for marama bean (2.8 - 4.6 g/100g) [20], for lima beans (2.78 g/100g) from Nigeria [21] and for eight varieties of tomatoes (0.74% - 1.41%) [22], but were in the range (4.21 - 26.0 g/100g) reported for leafy vegetables [23]. The available carbohydrate values varied significantly and reflected the nature of each plant. Whearas E. giganteus (33.1 g/100g), P. brazeana (22.2 g/100g) and Hua gabonii fruit (20.4 g/100g) can be considered as sources of available carbohydrates, X. aethiopica (0.4 g/100g) and M. myristica (0.4 g/100g), S. zenkeri root (1.5 g/100g) and fruit (3.2 g/100g), and F. Leprieurii (3.4 g/100g) had low levels of available carbohydrates. Results showed that E. giganteus and P. brazzeana can accumulate sugar in roots; S. Zenkeri on the other hand did not seem to accumulate sugar either in root or in the fruits. Actually, although some of these spices contain some dietary sugars, they cannot be considered as carbohydrate sources as compared to tubers and cereals which are spread throughout the world [24].
For the organic nitrogen content, expressed in terms of proteins (Nitrogen × 6.25), the highest values were found

Table 2. Proximate composition of the selected wild plants.
in S. zenkeri fruit (14.0 g/100g) and root (12.2 g/100g) and M. myristica (13.6 g/100g), while the lowest were in M. whitei (4.7 g/100g), S. striatinus (4.9 g/100g), D. psilurus (4.8%) and T. tetraptera (5.0 g/100g). These observations suggest the relative dietary importance of S. zenkeri fruit and root, or M. myristica to the improvement of protein content of foods made from them. It is worth noting that our results for S. Zenkeri, M. myristica, M. whitei and T. tetraptera are fairly higher than those reported by Tchiegang and Mbougueng [8] on these spices and nearly similar to those obtained for Opuntia spp (6.7 - 19 g/100g) [25], while values for S. striatinus and D. psilurus were lower. This may be due to the differences in the analytical methods used which, in their case was a spectrophotometric evaluation of ammonium [26]. In addition this could also be due to the inorganic nitrogen content which had not been taken into consideration by these authors, and which in the present work varied significantly amongst the samples (Table 2). In fact, non protein nitrogen were found in relatively large amounts in S. zenkeri fruit (1.07 g/100g) while low amounts were found in M. myristica (0.15 g/100g) and H. gabonii fruit (0.13 g/100g).
The most significant variation observed on the proximate composition of the spices under study was in their fatcontent. Generally the fat content of the different spice samples varied from 2.0 g/100g (S. zenkeri fruit) to 53.4 g/100g (M. myristica). Similar high levels of fats (47.5 g/100g), but lower than our results have been reported for M. Myristica [8] and for marama bean (41.9 g/100g) [20]. It was equally found that F. leprieuri (32.1 g/100g) in concordance with literature and X. aethiopica (33.7 g/100g) possessed high fat contents. Comparatively the low fat content reported in literature [8] for X. aethiopica (20.2 g/100g) may be attributed to the difference in the extraction method which in the case of these authors, Soxhlet, is known to be destructive. Compared to other oils sources (olive, palm, soy, and groundnuts), M. myristica, F. leprieuri and X. aethiopica can be considered as good sources of fat.
Since vegetable oils are usually associated with high contents of unsaturated fatty acids [27], the likelihood of the oils in the spices analysed being of good nutritional and even commercial value are high but this needs to be verified using appropriate analytical methods.
3.2. Minerals
The mineral content of plants is given in Table 3.
Potassium content was relatively high in all cases except in two samples (F. leprieuri, 31.9 mg/100g and S. striatinus, 69.9 mg/100g). The highest value was observed for M. whitei with an average value of 592.7 mg/100g. At the best of our knowledge, this is the first time data is available in the literature on the potassium level of these spices. Compared to other vegetables, the range of values reported for the spices (280 - 670 mg/ 100g) [28], are significantly lower than those for leguminous seeds (776 - 1240 mg/100g) [19], turkey spices (591 - 2481 mg/100g) [28], medicinal and aromatic plants used as spices, condiments and herbal teas (357 - 2767 mg/100g) [30] and for lima beans (2.78 g/100g) from Nigeria [21].
Calcium content was found in low levels in most of the plants analyzed, especially in A. danielli (62 mg/100g) and H. gabonii fruit (74 mg/100g) whereas H. gabonii bark (1594 mg/100g) and M. whitei (1060 mg/100g) exhibited higher calcium content. For H. gabonii bark the value observed was lower than the value of 2571 mg/100g previously reported [8]. Moreover these authors reported high calcium content for S. zenkeri bark (2789 mg/100g) as compared to significantly lower data (224 mg/100g) obtained in this study. Compared to other


Table 3. Mineral composition of selected wild plant samples expressed in mg/100g dry weight basis.
foodstuffs, the values fall in the range reported for vegetables (17 - 2596 mg/100g) [23] and for marama bean (937 - 2038 mg/100g) [20], but covers those reported for Turkey spices (633 - 1236 mg/100g) [28], root vegetables (37 - 431 mg/100g) [31] and leguminous seeds (78 - 152 mg/100g) [19].
Compared to other major elements evaluated in this study, Na was found in very low amounts (i.e. 40 times lower than K) in spice samples with values ranging from 0.0 mg/100g (F. leprieuri and S. melongena) to 28.1 mg/100g (P. umbellatum). Similar low amounts of Na were reported for wild leguminous seeds (3.7 - 11.8 mg/100g), and a processed spice made of Hisbiscus sabdariffa and Parkia biglobosa (2.2 - 18.2 mg/100g) and condiments [32]. Mg content oscillated between 22.5 mg/100g (S. zenkeri) and 531.6 mg/100g (M. whitei). Our results are much lower than those reported in literature [8] and cover the range value reported for edible wild leaves (32 - 160 mg/100 mg) [28]. Cu was found in small percentages in all the species analyzed (0.03 - 1.37 mg/100g), with X. aethiopica (1.37 mg/100g) exhibiting the highest value and D. psilirus (0.03 mg/100g) the lowest. Our data were much higher than those reported on wild leaves (0.12 - 0.33 mg/100g) [28]. Zn content ranged from 0.7 mg/100g (F. xanthoxyloides and P. brazzeana) to 6.7 mg/100g (A. Daniellii and S. Zenkeri bark). These values were significantly higher than those reported for wild leaves (0.41 - 1.20 mg/100g) [28] and lower than those found in marama bean (31 - 39 mg/100g) [20]. Mn was found to be high (range 0.7 to 20.5 mg/100g) in our samples than those reported on other plants (0.29 - 1.0 mg/100g) [28]. Fe content largely varied (p < 0.001) between plants and ranged from 5.9 mg/100g for Scorodophleus zenkeri (bark) to 206.4 mg/100g for Echinops giganteus. Our results were in the range (4.6 - 123.0 mg/100g) reported for some plants used as condiments [29], but higher than those reported in literature for similar wild plants (0.4 - 41.9 mg/100g) [8].
Selenium values ranged from 0.0 µg/100g to 310.0 µg/100g. To the best of our knowledge, this is the first reported data on Se content of these spices. Various values of Se were reported in literature for various foodstuffs: 4.6 - 5.4 µg/100g for rice, 5.8 - 23.0 µg/100g of dry legumes and seeds, 0.1 - 12.7 µg/100g for various vegetables [33] and 21.6 µg/100g of Korean diet [34]. The low level of Se in foods has been ascribed to the low soil content in selenium, such as in volcanic regions [35]. In addition it has been demonstrated that some plants, known as Se-accumulator, highly absorb Se compared to non Se-accumulator plants. The high Se content of some wild plants offers dietary Se sources to consumers for the management of several chronic diseases such as cardiovascular diseases, cancers and HIV [33].
3.3. pH and Colour Characteristics L, a*, b* of the Spices
Spice powders induced some acidification of the solution in which they were introduced. Generally the powdered samples of S. zinkeri “root”, M. myristica, and A. Daniellii have low pH values (3 - 4), while P. brazzeana, C. frutescens and H. gabonii “root”, have pH of fairly neutral (Table 4). These results suggest that the spices used in this study contain some acidic molecules. Acidification is well established as a mechanism of food preservation. From this perspective, some of the spices analysed may be useful in the preservation of foods through this mechanism, but this needs to be investigated.
Conversely, all the spices exhibited a characteristic dark colour but this varied significantly from one plant species to another. In fact values for lightness, L, varied from 20.6 (less light, Xylopia aethiopica, Fagara leprieuri) to 78.6 (slightly light, M. myristica).
The a* values were higher than the white standard (a = 0.19) varying from 0.9 (S. striatinux) to 22.7 (C. frustescens). The b* coordinate of the colour also varied significantly among samples with X. aethiopica exhibiting the lower level (7.6) and S. zenkeri bark exhibiting the highest (35.2). Compared to the literature our results are nearly similar with those found in the dry bean varieties grown in Ethiopia [36] and when we compared to a white standard, these results showed that all the samples were less light, redder and more yellow.
3.4. Phenols and Vitamins
Phenolic and vitamin content of foods are known to have positive effects on health. Epidemiological studies have shown high intakes of phenols, vit C, vit E and carotenoid-rich vegetables to be associated with decreased incidence of some cancers and cardiovascular diseases [37]. The mean content of total phenols, β-carotene, vit C and E of the wild plants analysed are given in Table 5. The total phenolic content, obtained varied between 1.05 g GAE/100g for S. melongena and 38.80 g GAE/100g for D. glomerata. From a comparative point of view, the values found here are lower than those reported by Agbor et al. for P. guineense, P. umbellatum, S. zenkeri (fruit), and S. zenkeri (bark) with respective mean values of 20.9, 19.0, 18.4 and 15.1 mg equivalent catechin/g or 990.9, 899.1, 339.0, and 480.8 mg equivalent vit E/g [38]. These differences in the phenolic content may be due to difference in the standard used. When compared to other foodstuffs, similar high levels of antioxidant was observed for Arctostaphylos uva-ursi, (31.2 g GAE/100g), the aerial parts of Horsetail, Equisetum spp. (21.6 g GAE/100g) [39] and for tea and herbal infusions (44 - 209 mg GAE/g) from Poland [40].


Table 4. Colour characteristics and pH of selected wild plants.
Vit E contents in samples varied between 0.39 and 10.02 mg eq α tocopherol/100g dwb. F. Xanthoxyloides, H. gabonii fruit, P. Brazzeana, and S. striatinux possessed the highest vit E content while the lowest were found in S. Melongena, S. zenkeri bark, and X. Aethiopica. Compared to other food products, our results are in the range found in the literature: 1.3 mg eq α tocopherol /100 dwb in spirulina, 132.2 mg eq α tocopherol/100g fresh in bay leaf, and 20.61 mg/100g fresh sample in thyme [41]. Vit C content of plants varied significantly from 0.22 to 3.75 g/100g. The highest levels were found in S. melongena and F. xanthoxyloides while the lowest levels were observed in H. gabonii fruit and M. myristica. These values are high when compared to those reported for some fruits known as sources of vitamin C such as apples (1.1 - 3.5 mg/100g fresh samples), grapefruits (28.5 - 52.0 mg/100g fresh samples), mangoes (9.1 - 18.6 mg/100g fresh samples) and oranges (42.1 - 62.4 mg/ 100g) [42].
4. Conclusion
This study has revealed a wide variation wide variation in the carbohydrate, crude fat, crude protein, total phenols, vitamins and high levels in ash content of the spices analysed. C. frutescens is particularly high in provitamin A, just as is F. xanthoxyloides in its vit E and β carotene content, and M. myristica, F. leprieuri and X. aethiopica in their overall lipid content. These spices have the potential of contributing tothe nutritional and health needs of their consumers.
5. Acknowledgements
We wish to thank the International Foundation for Sci-

Table 5. Total phenol, total carotenoid, vit C and E contents of selected wild plants.
ences, Stockholm, Sweden, for the financial support and the French Cooperation in Cameroon for the additional financial assistance.
REFERENCES
- U. R. Susheela, “Handbook of Spices, Seasoning, and Flavorings,” TECHNOMIC Publishing Co., Inc., Lancaster, 2000, p. 329.
- J. Bitting and P. W. Sherman, “Antimicrobial Functions of Spices—Why Some Like It Hot,” Quarterly Review of Biology, Vol. 73, No. 1, 1998, pp. 3-49. doi:10.1086/420058
- A. A. Barakat, A. O. Maslat and M. M. AL-Kofahi, “Element Analysis and Biological Studies on Ten Oriental Spices Using XRF and Ames Test,” Journal of Trace Element Medicine Biology, Vol. 17, No. 2, 2003, pp. 85-90. doi:10.1016/S0946-672X(03)80003-2
- H. R. H. Takruri and A. F. M. Dameh, “Study of the Nutritional Value of Black Cumin Seeds (Nigella sativa L),” Journal of the Science of Food and Agriculture, Vol. 76, No. 3, 1998, pp. 404-410. doi:10.1002/(SICI)1097-0010(199803)76:3<404::AID-JSFA964>3.0.CO;2-L
- C. Gopalan, B. V. Ramasastri, S. C. Balasubramanian, B. S. Narsinagarao, Y. G. Deosthale and K. C. Pant, “Nutritive Value of Indian Foods,” India National Institute of Nutrition, Hyderabad,1999.
- J. S. Pruthi, “Quality Assurance in Spices and Spice Products, Modern Methods of Analysis,” Allied Publishers Ltd, New Delhi, 1999.
- C. M. F. Mbofung, J. M. Gee and J. D. Knight, “Fatty Acid Profile of Some Cameroonian Spices,” Journal of the Science of Food and Agriculture, Vol. 66, No. 2, 1994, pp. 213-216. doi:10.1002/jsfa.2740660216
- C. Tchiegang and D. Mbougueng, “Composition Chimique des Epices Utilisées dans la Préparation du na’a poh et du kui de l’Ouest Cameroun,” Tropicultura, Vol. 23, No. 4, 2005, pp. 193-200.
- A Abdou Bouba, N. Y. Njintang, J. Scher and C. M. F. Mbofung, “Phenolic Compounds and Radical Scavenging Potential of Twenty Cameroonian Spices,” Agriculture and Biology Journal of North America, Vol. 1, No. 3, 2010, pp. 213-224. doi:10.5251/abjna.2010.1.3.213.224
- AOAC, Association of Official Analytical Chemists, Washington DC, 1990.
- Y. N. Njintang, C. M. F. Mbofung, F. Balaam, P. Kitissou and J. Scher, “Effect of Taro (Colocasia esculenta) Flour Addition on the Functional and Alveographic Properties of Wheat Flour and Dough,” Journal of the Science of Food and Agriculture, Vol. 88, No. 2, 2008, pp. 273-279. doi:10.1002/jsfa.3085
- J. Folch, M. Lees and G. S. H. Sloane, “A Simple Method for the Isolation and Purification of Total Lipids from Animal Tissue,” Journal of Biolology and Chemistry, Vol. 226, 1957, pp. 497-509.
- S. Skunjins, “Handbook for ICP-AES (Varian-Vista), A Short Guide to Vista Series ICP-AES Operation,” Version 1.0., Varian International AG, 1998.
- AACC, “Approved Methods of the American Association of Cereal Chemists,” The Association, St. Paul, 1995, pp. 40-71.
- D. B. Milne and J. Botnen, “Retinol, α-Tocopherol, Lycopene, and α- and β-Carotene Simultaneously Determined in Plasma by Isocratic Liquid Chromatography,” Clinical Chemistry, Vol. 32, 1986, pp. 874-876.
- A. P. De Leenheer, H. J. Nelis, W. E. Lambert and R. M. Bauwen, “Chromatography of Fat-Soluble Vitamins in Clinical Chemistry,” Journal of Chromatography, Vol. 429, 1988, pp. 3-58.
- V. Raghu, P. Kalpana and K. Srinivasan, “Comparison of Ascorbic Acid Content of Emblica officinalis Fruits Determined by Different Analytical Methods,” Journal of Food Composition and Analysis, Vol. 20, No. 6, 2007, pp. 529-533. doi:10.1016/j.jfca.2007.02.006
- X. Gao, M. Ohlander, N. Jeppsson, L. Björk and V. Trajkovski, “Changes in Antioxidant Effects and Their Relationship to Phytonutrients in Fruits of Sea Buckthorn (Hippophae rhamnoides L.) during Maturation,” Journal of Agriculture and Food Chemistry, Vol. 48, No. 5, 2000, pp. 1485-1490. doi:10.1021/jf991072g
- J. O. Amarteifio and D. Moholo, “The Chemical Composition of Four Legumes Consumed in Botswana,” Journal of Food Composition and Analysis, Vol. 11, No. 4, 1998, pp. 329-332. doi:10.1006/jfca.1998.0595
- M. Holse, S. Husted and A. Hansen, “Chemical Composition of Marama Bean (Tylosema esculentum) A Wild African Bean with Unexploited Potential,” Journal of Food Composition and Analysis, Vol. 23, No. 6, 2010, pp. 648-657. doi:10.1016/j.jfca.2010.03.006
- I. E. Ezeagu and M. D. Ibegbu, “Biochemical and Nutritional Potential of Ukpa: A Variety of Tropical Lima Beans (Phaseolus lunatus) from Nigeria—A Short Report,” Poland Journal of Food Nutrition Science, Vol. 60, No. 3, 2010, pp. 231-235.
- J. L. Guil-Guerrero and M. M. Rebolloso-Fuentes, “Nutrient Composition and Antioxidant Activity of Eight Tomato (Lycopersicon esculentum) Varieties,” Journal of Food Composition and Analysis, Vol. 22, No. 2, 2009, pp. 123-129. doi:10.1016/j.jfca.2008.10.012
- O. Hels, T. Larsen, L. P. Christensen, U. Kidmose, N. Hassan and S. H. Thilsted, “Contents of Iron, Calcium, Zinc and b-Carotene in Commonly Consumed Vegetables in Bangladesh,” Journal of Food Composition and Analysis, Vol. 17, No. 5, 2004, pp. 587-595. doi:10.1016/j.jfca.2003.08.007
- L. Jayakody, R. Hoover, Q. Liu and E. Weber, “Studies on Tuber and Root Starches. I. Structure and Physicochemical Properties of Innala (Solenostemon rotundifolius) Starches Grown in Sri Lanka,” Food Research International, Vol. 38, No. 6, 2005, pp. 615-629. doi:10.1016/j.foodres.2004.11.015
- T. Guevara-Figueroa., H. Jimenez-Islas., M. L. ReyesEscogido, A. G. Mortensen, B. B. Laursen., L-W. Lin, A. De Leon-Rodrıguez, I. S. Fomsgaard and A. P. Barba de la Rosa, “Proximate Composition, Phenolic Acids, and Flavonoids Characterization of Commercial and Wild Nopal (Opuntia spp),” Journal of Food Composition and Analysis, Vol. 23, 2010, pp. 525-532.
- M. B. Devani, I. Shishoo, S. A. Shah and B. N. Suhagia, “Spectrophotometric Method for the Micro Determination of Nitrogen in Kjeldahl Digest,” Journal of Association Official Analytical Chemists, Vol. 72, No. 6, 1989, pp. 953-956.
- K. Huang, C. C. Akoh and C. M. Erickson, “Enzymatic Modification of Melon Seed Oil: Incorporation of Eicosapentaenoic Acid,” Journal of Agriculture and Food Chemistry, Vol. 42, No. 11, 1994, pp. 2646-2648. doi:10.1021/jf00047a050
- J. L. Guil, J. J. G. Martinez and M. E. Isasa, “Mineral Nutrient Composition of Edible Wild Plants,” Journal of Food Composition and Analysis, Vol. 11, No. 4, 1998, pp. 322-328. doi:10.1006/jfca.1998.0594
- M. Özcan, “Mineral Contents of Some Plants Used as Condiments in Turkey,” Food Chemistry, Vol. 84, No. 3, 2004, pp. 437-440. doi:10.1016/S0308-8146(03)00263-2
- M. M. Ozcan and M. Akbulut, “Estimation of Minerals, Nitrate and Nitrite Contents of Medicinal and Aromatic Plants Used as Spices, Condiments and Herbal Tea,” Food Chemistry, Vol. 106, No. 2, 2007, pp. 852-858. doi:10.1016/j.foodchem.2007.06.045
- P. Ekholm, H. Reinivuo, P. Mattila, H. Pakkala, J. Koponen, A. Happonen, J. Hellström and M. Ovaskainen, “Changes in the Mineral and Trace Element Contents of Cereals, Fruits and Vegetables in Finland,” Journal of Food Composition and Analysis, Vol. 20, No. 6, 2007, pp. 487-495. doi:10.1016/j.jfca.2007.02.007
- D.A. Dashak, M. L. Dawang and N. B. Lucas, “An Assessment of the Proximate Chemical Composition of Locally Produced Spices Known as Dadawa Basso and Dadawa Kalwa from Three Markets in Plateau State of Nigeria,” Food Chemistry, Vol. 75, No. 2, 2001, pp. 231-235. doi:10.1016/S0308-8146(01)00205-9
- P. Sirichakwal, P. Puwastien, J. Polngam and R. Kongkachuichai, “Selenium Content of Thai Foods,” Journal of Food Composition and Analysis, Vol. 18, No. 1, 2005, pp. 47-59. doi:10.1016/j.jfca.2003.10.010
- K. Hwang, H. K. Park and C.-H. Ohe, “Selenium Content in Representative Korean Foods,” Journal of Food Composition and Analysis, Vol. 22, No. 2, 2009, pp. 117-122. doi:10.1016/j.jfca.2008.11.009
- P. M. Rayman, “The Importance of Selenium to Human Health,” Lancet, Vol. 356, No. 9225, 2000, pp. 233-241. doi:10.1016/S0140-6736(00)02490-9
- E. A. Shimelis and S. K. Rakshit, “Proximate Composition and Physico-Chemical Properties of Improved Dry Bean (Phaseolus vulgaris L.) Varieties Grown in Ethiopia,” LWT—Food Science and Technology, Vol. 38, No. 4, 2005, pp. 331-338. doi:10.1016/j.lwt.2004.07.002
- M. L. Slattery, J. Benson, K. Ma, K. N. Curtin, D. Schaeffer and J. D. Potter, “Carotenoids and Colon Cancer,” American Journal of Clinical Nutrition, Vol. 71, 2000, pp. 575-582.
- G. A. Agbor, J. E. Oben, J. Y. Ngogang, X. X. Cai and A. J. Vinson, “Antioxidant Capacity of Some Herbs/Spices from Cameroon: A Comparative Study of Two Methods,” Journal of Agriculture and Food Chemistry, Vol. 53, No. 17, 2005, pp. 6819-6824. doi:10.1021/jf050445c
- R. Amarowicz, R. B. Pegg, P. Rahimi-Moghaddam, B. Barld and J. A. Weil, “Free-Radical Scavenging Capacity and Antioxidant Activity of Selected Plant Species from the Canadian Prairies,” Food Chemistry, Vol. 84, No. 4, 2004, pp. 551-562. doi:10.1016/S0308-8146(03)00278-4
- A. Rusaczonek, F. Świderski and B. Waszkiewicz-Robak, “Antioxidant Properties of Tea and Herbal Infusions,” Poland Journal of Food Nutrition Science, Vol. 60, No. 1, 2010, pp. 33-35.
- J. M. D. Gomez-Coronadoa, E. Ibanez, J. F. Rupereza and C. Barbasa, “Tocopherol Measurement in Edible Products of Vegetable Origin,” Journal of Chromatography Analysis, Vol. 1054, 2004, pp. 227-233.
- A. A. Franke, J. L. Custer, C. Arakaki and P. S. Murphy, “Vitamin C and Flavonoid Levels of Fruits and Vegetables Consumed in Hawaii,” Journal of Food Composition and Analysis, Vol. 17, No. 1, 2004, pp. 1-35. doi:10.1016/S0889-1575(03)00066-8