1. Introduction
In pervious two articles [1,2] the cosmological parameter  was assumed constant in five general cosmic models. However, in some cosmological studies
  is not actually perfectly constant but exhibits slow variation, so
  is often described as quintessence [3-6]. In other wordsthe dark energy density
  does not remain constant with time.
This point of view is in a good agreement with the Heisenberg’s Uncertainty Principle that there is an uncertainty in the amount of energy which can exist. This small uncertainty allows non-zero energy  to exist for short intervals of time
  where
where  is Planck’s constant
As a result of the equivalence between matter and energy, these small energy fluctuations can produce virtual pairs of matter particles (particles and their antiparticles must be produced simultaneously) which come into existence for a short time and then disappear to produce photons.
In the present study  is assumed to be very slowly decreasing function of the cosmic time
  such that any decrease in
  say
say  should be compensated by increasing each of the matter density
  and radiation density
  by
by
The importance of this study is to know under what cosmological conditions the universe can be contracting to big crunch rather than expanding for ever as shown in the five general cosmic models investigated in [1].
In Section 2, a detailed description is given for the methodology. Determination of  is explained in Section 3. Observational tests of the closed cosmic model are illustrated in Section 4. Results and discussion are presented in Section 5. Finally the conclusion is displaced in Section 6.
2. Methodology
From [1] we have seen that the densities of matter  radiation
  and dark energy
  at a cosmic time
  are given by
 (1)
(1)
 (2)
(2)
 (3)
(3)
where
 (4)
(4)
 (5)
(5)
 (6)
(6)
 (7)
(7)
 (8)
(8)
 (9)
(9)
Substituting by (4), (6) in (1) we get

Or,
 (10)
(10)
Similarly we can find
 (11)
(11)
 (12)
(12)
Now assume a very small decrease in  about
about  per Gyr, so the decrease in
  in cosmic time
  is expressed as
 (13)
(13)
According to the conservation law of mass and energy the decrease  in the energy density
  is compensated by increase of
  in each of
  and
and 
Therefore at the cosmic time  the new values of
  and
and  are given by
 (14)
(14)
 (15)
(15)
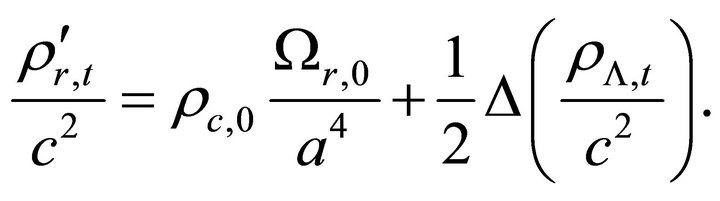 (16)
(16)
The slowly varying cosmological parameter is
 (17)
(17)
Using Equations (1)-(5) and (14)-(16) the new values of density parameters in the expanding cosmic model at time  are
are
 (18)
(18)
 (19)
(19)
 (20)
(20)
Let  then Equations (6)-(8) can be written as
 (21)
(21)
 (22)
(22)
 (23)
(23)
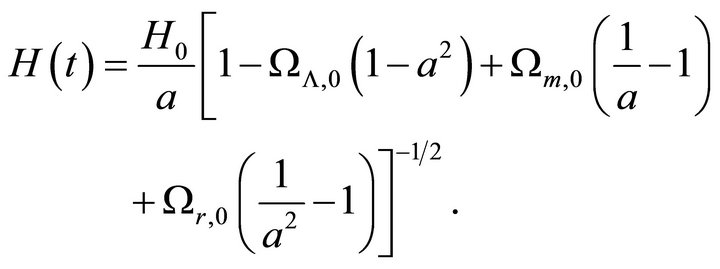
Substituting by (21)-(23) in (9) and using (18)-(20) we get the Hubble parameter in the closed cosmic model at time 

or,
 (24)
(24)
The critical mass density in the closed cosmic model at time  becomes
 (25)
(25)
The new density parameters in the closed cosmic model at time  are
are
 (26)
(26)
 (27)
(27)
 (28)
(28)
And the total density parameter in the closed cosmic model at time  is
is
 (29)
(29)
The speed of the universe dynamics in the closed cosmic model is obtained from Equation (24) such that

or,
 (30)
(30)
The acceleration of the universe dynamics in the closed cosmic model is found empirically as
 (31)
(31)
The time interval between two instants with scale factors  during the universe expansion is given by Equation (16) in [1] as
 (32)
(32)
The redshift lookback time relation in the closed cosmic model is given by Equation (18) in [1]. In addition, the distributions of temperature at different epochs of the universe depend on relations similar to Equations (33), (34) and (37) in [1].
3. Determination of 
The time of the maximum expansion of the universe in the closed model is evaluated by iterative procedure as follows:
1) Start with  at
at  and let
2) Calculate 1000 values of 
 and
and 
using Equations (32), (30). The value of  corresponding to the minimum positive value of
  is assumed to be
  and
and

3) Select  at
at  and repeat the previous two steps where
  Now the value of
  corresponding to the minimum positive value of
  is supposed to be
  and
and

4) Repeat this method several times using the values  and
and  then estimate the values
  and
and  and obtain the corresponding values of
  and
and
5) Denote these results as presented in Table 1, where it is noticeable that the values of  and
and 
converge and become very close to zero. In other words the universe stops expending at 
6) From Table 1 one can easily find that the time of maximum expension of the universe in the closed model is . By similarity the time of big craunch is
 .
.

Table 1. Iterative determination of the maximum expansion time of the universe in the closed cosmic model.
4. Observational Tests to the Closed Cosmic Model
It is convenient to start by investigating the distributions of the cosmological parameter  in the closed cosmic model at various epochs according to Equation (17). Figure 1(a) shows no evident change of
  with cosmic time until
  then
then  decreases in relatively higher rate towards
 . On the other hand
  exhibits a gradual change with time in the time range
  as seen in Figure 1(b), where
  is the time of maximum expansion of the universe in the closed cosmic model. The slow variation of
  with
with  is also noticeable in the time ranges
  as displaced in Figures 1(c) and (d) respectively where
  is the time of big craunch of the universe in the closed cosmic model and
 .
.
Figure 2(a) shows that the expansion distribution of the universe in the closed cosmic model up to  is found using Equation (32). This distribution is in good agreement with that of the observed general cosmic model
  obtained by Equation (16) in [1]. Moreover, at
 , these two distributions become identical. The redshift look-back time distributions in these two models up to
  were established and presented in Figure 2(b). Both distributions are in perfect agreement. The obvious agreement between the observed general cosmic model
  and the closed cosmic model as seen from Figures 2(a) and (b) strongly argues in favour of reliability of the closed cosmic model.
 (a)
(a) (b)
(b)
Figure 1. (a) The distribution of the cosmological term in the closed cosmic model up to t = 0.5 Gyr; (b) The distribution of the cosmological term in the closed cosmic model in the range t = 0.5 Gyr − tme; (c) The distribution of the cosmological term in the closed cosmic model in the range t = tme − t∗; (d) The distribution of the cosmological term in the closed cosmic model in the range t = t∗ − tbc.
 (a)
(a)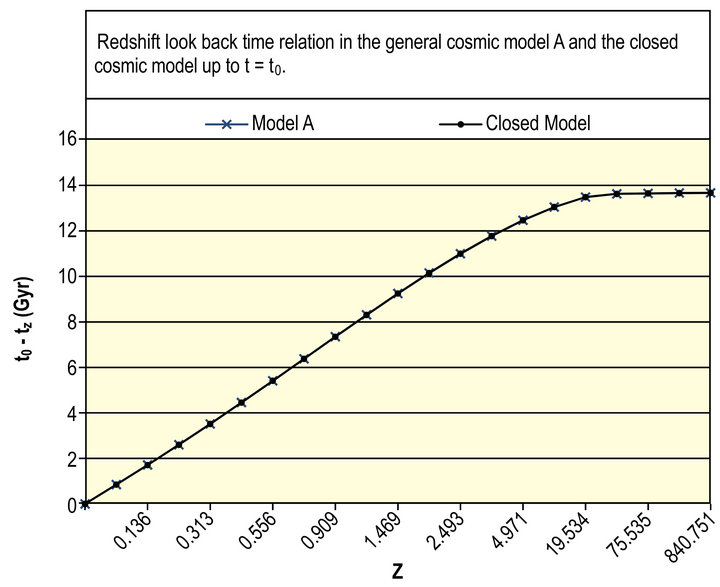 (b)
(b)
Figure 2. (a) The expansion of the universe in the general cosmic model A and the closed model up to t = t0; (b) Redshift look back time relation in the general cosmic model A and the closed cosmic model up to t = t0.
5. Results and Discussion
The expansion of the universe in the closed cosmic model up to  is obtained by Equation (32) and presented in Figure 3(a). It is noticeable that the increase of
  with
with  is continuous as a linear relation until about
 , then
  increases relatively slow with
  Nevertheless, the contraction of the universe in the closed model in the time range
  is illustrated in Figure 3(b). It is obvious that
  almost linearly decreases with
  However,
  reduces relatively slow with
  just before
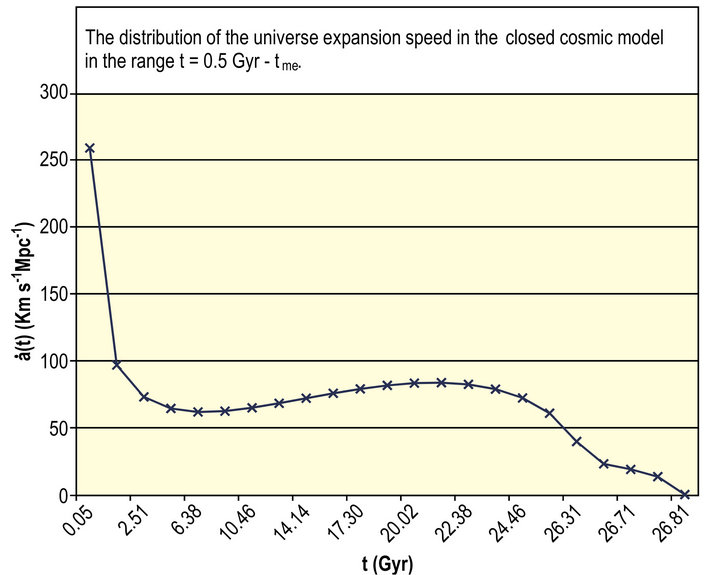
The distribution of the universe expansion speed  in the closed model in the range
  is performed using Equation (30) and displaced in Figure 4(a). The value of
  is high in the early universe then it decreases abruptly up to about
 . Afterwards
  fluctuates gradually with
  until
until  at
at  On the other hand, Figure 4(b) exhibits the distribution of the universe contraction speed
  in the closed model in the range
  It is clear that the increase of
  with
with  is gradual up to
 then
then  rapidly increases with
  until
until 

The distribution of the universe expansion acceleration  in the closed model in the range
  is deduced from Equation (31) and exhibited in Figure 5(a). Abrupt increase in
  with
with  is obvious up to
 . Then
  changes very slightly with
  until
until , where
  starts decreasing gradually up to
 . Afterwards,
  decreases
 (a)
(a) (b)
(b)
Figure 3. (a) Expansion of the universe in the closed cosmic model up to t = tme; (b) Contraction of the universe in the closed cosmic model in the range t = tme − tbc.
 (a)
(a) (b)
(b)
Figure 4. (a) The distribution of the universe expansion speed in the closed cosmic model in the range t = 0.5 Gyr − tme; (b) The distribution of the universe contraction speed in the closed cosmic model in the range t = tme − t∗.
rapidly towards the maximum expansion time  It is clear that in the range

 Furthermore, Figure 5(b) shows the distribution of the universe contraction acceleration in the closed model in the range
  It is noticeable that
  suddenly reduces up to
 , then
  reduces gradually until
  where
where  Afterwards,
  raises gradually up to
  where
where  starts increasing quite rapidly towards
 in the interval
 .
.
It is remarkable to note that the distributions of  and
and  in the closed cosmic model in the ranges
 ,
,  will be investigated in details in a separate study, since in these two time ranges the pressure of the cosmic fluid is significant and can not be neglected.
 (a)
(a) (b)
(b)
Figure 5. (a) The distribution of the universe expansion acceleration in the closed cosmic model in the range t = 0.5 Gyr − tme; (b) The distribution of the universe contraction acceleration in the closed cosmic model in the range t = tme − t∗.
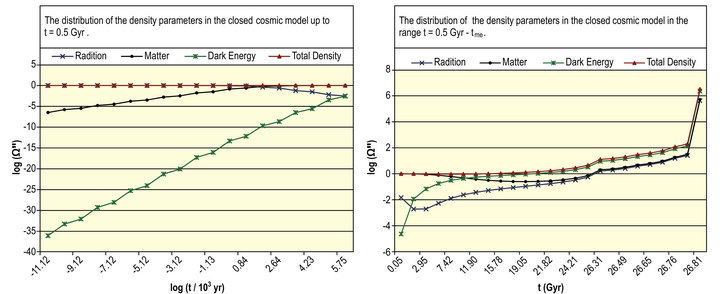
The distribution of the density parameters in the closed cosmic model up to  is disclosed in Figure 6(a). It is prominent that the distribution of the radiation density parameter
  coincides on the distribution of the total density parameter
  up to
up to . However, the distribution of the matter density parameter
  coincides on the distribution of
  at
at 
 . It is also obvious that the distributions of the dark energy density parameter
  and the distribution of
  are increasing while the distribution of
  remains almost fixed at the value
  up to
up to  , then it starts decreasing. Neverthelessthe distribution of
  stays almost constant at the value
  in this epoch of the universe. Thus
  at
at  whereas
 (a)
(a) (b)
(b)
Figure 6. (a) The distribution of the density parameters in the closed cosmic model up to t = 0.5 Gyr; (b). The distribution of the density parameters in the closed cosmic model in the range t = 0.5 Gyr − tm; (c) The distribution of the density parameters in the closed cosmic model in the range t = tme − t∗; (d) The distribution of the density parameters in the closed cosmic model in the range t = t∗ − tbc.
 at
at . Figure 6(b) shows the distribution of the density parameters in the cosmic closed model in the range
  It is evident that the distribution of
  displays rapid increase until the time
  where
where  then it raises gradually up to
  Gyr where it exhibits abrupt increase again. The distributions of
  become close together from
  to
to  The value of
  is almost 1.0 in the time intervals
  ,
,  The distributions of
  and
and  change quite slowly up to
  where they also raise up suddenly. They get close together from
  to
to  The distribution of the density parameters in the cosmic closed model in the range
  is presented in Figure 6(c). All distributions, reveal steep decrease up to
 . Distributions of
  are adjacent to each other until
  , then they diverge apart and decrease slowly. In addition, the distributions of
  and
and  are also near each other up to
 . Afterwards these two distributions reduce gradually and get away from each other. Nevertheless, after the time
  the distributions of
  and
and  reduce quite rapidly and intersect with each other at
  where
where  However, the distributions of
  and
and  intersect at
  where
where  The distributions of
  and
and  get close to each other at
  until
until  Figure 6(d) illustrates the distribution of density parameters in the closed cosmic model in the range
  It is clear that the distributions of
  and
and  almost coincide on each other up to about
 , then the distribution of
  starts decreasing slightly but still close to that of
  until
until , while
  takes the values between
  throughout the interval
  However, the distribution of
  raises gradually and intersects with the distribution of
  at
at . In addition the distribution of
  gets closer to the distribution of
  at
at  Finally, the distribution of
  indicates slow decrease until about
  then it exposes quite rapid decrease towards the time of big Crunch.
It is essential to realize that the universe history has six main stages in the closed model, these are 1) The first radiation epoch in the range 
2) The first matter epoch in the range 
3) The first dark energy epoch in the range 
4) The last dark energy epoch in the range 
5) The last matter epoch in the range 
6) The last radiation epoch in the range 
These epochs of the universe with their relevant density parameters are all summarized in Table 2. Forthermore, the geometry of space throughout the universe history in the closed cosmic model is presented in details in Table 3.
One can see in Table 3 that the space of the universe is flat just after the big bang up to  where the total density parameter lies in the range
  Afterwards, the space of the universe becomes open until
  since
since  Then the universe space returns to flat up to
  as
as  Afterward, the universe space gets curved then closed until
  because
  Hence, the universe space remains being closed then curved up to
  since
since  Afterward the universe space evolves into flat until
  as
as  Then the universe space develops into open up to
  owing to
  Eventuall the space of the universe comes back to flat until the time just before the big cranch by the reason of
The distribution of the universe temperature  in the closed cosmic model in the first radiation epoch is obtained using Equation(34) in [1] and displayed in Figure 7(a). It is evident that
  reduces continuously in linear manner during this era. The temperatures of the radiation
  and non relativistic matter
  are determined from Equations (33), (37) in [1] respectively. The distributions of
  and
and  in the first matter and dark energy eras are presented in Figure 7(b). It is prominent that
  at
at  then the distributions of
  decrease sharply up to t = 0.0702 Gyr. However, both distributions reduce gradually afterwards. The distribution of Tr(t) is above that of Tm(t) throughout these two epochs. At t =

Table 2. Epochs of the universe history in the closed cosmic model.
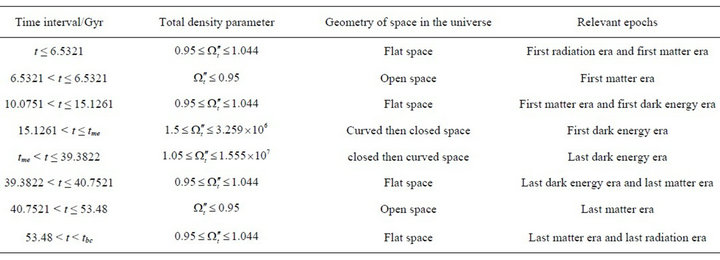
Table 3. Geometry of space throughout the universe history in the closed cosmic model.
 (a)
(a)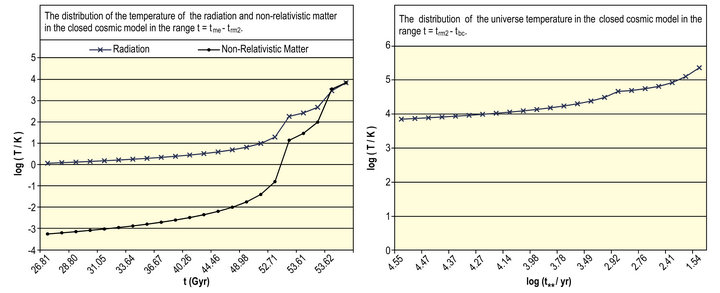 (b)
(b)
Figure 7. (a) The distribution of the universe temperature in the closed cosmic model up to t = trm1; (b) The distribution of temperature of the radiation and non-relativistic matter in the closed cosmic model in the range t = trm1 − tme. (c) The distribution of temperature of the radiation and non-relativistic matter in the closed cosmic model in the range t = tme − trm2; (d) The distribution of the universe temperature in the closed cosmic model in the range t = trm2 − tbc.
tme Tr = 1.1471 K, Tm = 0.0005 K. The distribution of  and
and  in the last dark energy and last matter epochs are exposed in Figure 7(c). Both distributions increase slowly up to t = 53.2567 Gyr, then they start raising rapidly until they join together at
  where Tr = Tm 7032.5366 K. Eventually, Figure 7(d) indicates the distribution of the universe temperature in the last radiation epoch. This distribution raises slowly up to
  before
  then it increases rapidly to the value Tu = 2.2593 × 10⁵ K at t = 34.4654 yr before
Further interesting physical properties of the universe in the closed cosmic model would be investigated in separate studies in comparison with the corresponding properties of the universe in the five general cosmic models.
6. Conclusion
In this study a closed model of the universe was developed depending on the assumption that very slow transfer of the dark energy to mater and radiation is allowed. Thus the cosmological parameter is no longer constant but so slowly decreasing function of time. In the light of this model the universe expands to maximum limit at  Gyr, then it will recollape to a big crunch at
 . Observational tests to this model were presented. The distributions of the universe expension and contraction speed were investigated in the closed model which disclosed that the expansion speed in the early universe is very high, then it will reduce rapidly until it vanishes at
  Nevertheless, the contraction speed of the universe raises continuously until the time just before
  The distribution of the universe expansion and contraction acceleration were carried out empirically which supported the previous result. In this model the universe history is classified in to six main eras, these are the first radiation epoch, the first matter epoch, the first dark energy epoch, the last dark energy epoch, the last matter epoch and the last radiation epoch. The distributions of the density parameters of the radiation, matter, dark energy and total density in addition to the distributions of temperatures of the radiation and nonrelativistic matter were all determined and discussed in this model in the various eras of the universe.
7. Acknowledgements
This paper was funded by the Deanship of Scientific Research (DSR), King Abdulaziz University, Jeddah. The author, therefore, acknowledges with thanks DSR technical and financial support.