Analysis of an Active Fault Geometry Using Satellite Sensor and DEM Data: Gaziköy-Saros Segment (NAFZ), Turkey ()
1. Introduction
The North Anatolian Fault Zone (NAFZ) is a major strike-slip fault of nearly 1500 km in length extending from eastern Turkey to the Gulf of Corinth (Greece) associated with the westward extrusion in Anatolia (Figure 1). It’s believed that NAFZ formed 10 M yr ago in eastern Turkey as an outcome from the collision of Arabian and the Eurasian plates [1]. Initially the growth was westward after then the growth was followed with preexisting fault systems modified as the propagating fault tip arrived [2].
The first significant earthquake on the NAFZ occurred in southeast Thrace between the Gulf of Saros and the Sea of Marmara on August 9th, 1912, nowadays known as Murefte-Sarkoy earthquake, with magnitude of 7.4 (M:7.4) on Richter scale. It was followed by several large aftershocks on August 10, 1912, M: 6.3; September 13, 1912, M: 6.9; September 27, 1912, M: 6.6 [3]. These aftershocks were located west of the main shock. Reports and photographs taken just after the earthquake are still available [4,5]. Ates [6] in his study mapped the ground deformation, which occurred on the 50 km long strikeslip fault linking the Marmara and the Saros fault systems [7-9]. Ambraseys and Finkel [3] suggested that the fault ruptured at least the entire onshore portion of the fault, a distance of 50 km, although the extent of area of greatest damage suggests a longer rupture of at least 100 km and possibly as much as 140 km [10]. The surface rupture pattern was complex with a substantial rightlateral strike-slip component (up to 3 m) [3]. According to Ambraseys and Finkel [3], the earthquake resulted in 2800 deaths and about 7000 injuries, and total destructtion of 12,600 houses, damaged 12,100 beyond repair and caused serious damage to another 15,400. This segment has been in terms of seismic activity recent years, which shows that the Gaziköy-Saros segment is locked. Ambraseys and Finkel [3] calculated the recurrence

Figure 1. (A) Tectonic setting of the eastern Mediterranean. GZF: Ganos Fault Zone; (B) Geological map of study area; (C) Generalized stratigraphic column of the post-Neogene units in the study area [16].
interval as being of between 150 and 420 years. Around the Sea of Marmara, a densely established GPS network gives a slip rate on the North Anatolian Fault of 24 ± 1 mm∙yr−1 [11-13]. The GPS data indicate that most of this motion takes place along the northern strands of the NAFZ, including the Gazikoy-Saros segment. In addition to this, the results of palaeoseismic studies are consistent with GPS velocity vector values.
The Gaziköy-Saros segment of the North Anatolian Fault Zone (NAFZ) extends with an average strike of some 77˚ between the Sea of Marmara and the Gulf of Saros. In the east the fault continues underwater to the south of the Tekirdag Basin [14]. Westward, the fault splays into a horsetail at the eastern end of the Gulf of Saros. This fault separates the Gelibolu Peninsula to the south from the rest of Thrace to the north. Despite numerous surface geological studies [15-18] the detailed surface expression of the North Anatolian Fault Zone (NAFZ) between the Sea of Marmara and the Gulf of Saros until the research study of Kaya et al. [19] was unknown. Kaya et al. [19] in their work analyzed the geometry of the fault using remotely sensed data and Digital Elevation Model (DEM); however a comparison between the outlined fault geometry and the GPS velocity vectors was not completed.
The use of satellite sensor images for geological mapping has been an accepted tool for reconnaissance geological work for over decades. Satellite sensor images have been used for producing general geological maps [20,21], active fault analysis [19,22-26], mineral deposit exploration [27] and environmental studies [28,29]. These studies have been taken advantage of the higher spectral resolution of Landsat TM data compared with other satellite sensor images (e.g. SPOT HRV data) to obtain a better discrimination between many lithological and structural features [30]. In addition to this, combining Landsat TM data with a higher spatial resolution data, such as SPOT HRV Panchromatic data provide a better discrimination of lithological and morphological features with the advantages of increasing spatial resolution (Figure 2(a)).
In this study, we used Landsat TM and SPOT HRV Panchromatic sensor data and DEM data to specify the various strands of the fault between Gaziköy and Saros region. In order to differentiate the individual details of the fault segment we also employed the combination of enhanced remotely sensed data with digital elevation model (DEM) information. Through using this data set we presented a new surface geometry expression of the GazikoySaros segment of NAFZ. In addition the obtained new fault geometry was compared with the velocity vectors acquired via GPS technology.
2. Methodology
2.1. Digital Elevation Model (DEM)
With the purpose of understanding better the Earth’s surface many geoscientists use different viewing 3D ground elevation perceiving methods. The representation of the 3D supplies is very important information about the relationship between land shape and structure, slopes and waterways, surface material and vegetation growth, structure and geology. High resolution digital elevation model was derived from 1/25,000 scaled maps, which approach is widely accepted to be an objectively reliable source data for structural evaluation of a region. Topographic surface analysis efforts in geosciences have been supported using DEM [31].
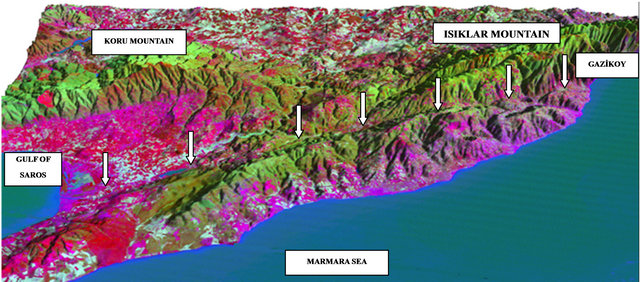
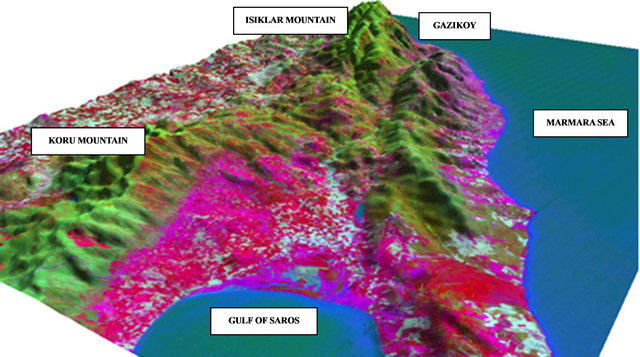
In this study, 10 meters intervals (taken at 0 (cost line), 10, 20, 30… etc.) counter lines in the topographic map (scale 1:25,000) were digitized to generate the DEM of the study area. The gridding method was applied for DEM generation and bilinear interpolation method was used in Z elevation interpolation. The DEM was transformed to raster format (Figure 3) and afterwards merged with the enhanced remotely sensed data (Figure 4) [19].
2.2. Remotely Sensed Data
Remotely sensed data sets include Landsat 5 TM data (acquired on July 11, 1992) and SPOT HRV Panchromatic data imagery (April 26, 1997). The data was taken from Istanbul Technical University, Remote Sensing’s laboratory of Department of Geomatics. Images from different satellite sensors and with different spatial resolutions had to be registered to a common coordinate system prior to image fusion process and to be evaluated with DEM data. Both Landsat 5 TM and SPOT HRV Panchromatic data were geometrically corrected using ground control points obtained from 1:25,000 scale map of the study area, and were transformed to Universal Transverse Mercator (UTM) coordinates using a first order polynomial transformation and nearest neighbor resampling method.
The enhancement of remotely sensed data was used to emphasize the spectral characteristics in an image. Principal Components Analysis (PCA) is a statistical technique widely used in remote sensing to maximize spectral differences [32].
Especially, enhanced remotely sensed data was important advantage, as this way various characteristics of the morphological structure of the earth’s surface could be displayed more clearly. Landsat 5 TM was enhanced using PCA and subsequently overlaid with digital elevation model (DEM) data. Using the combination of these data, the morphological structure and the linear features of Gaziköy-Saros segment were visibly interpreted.
3. Results
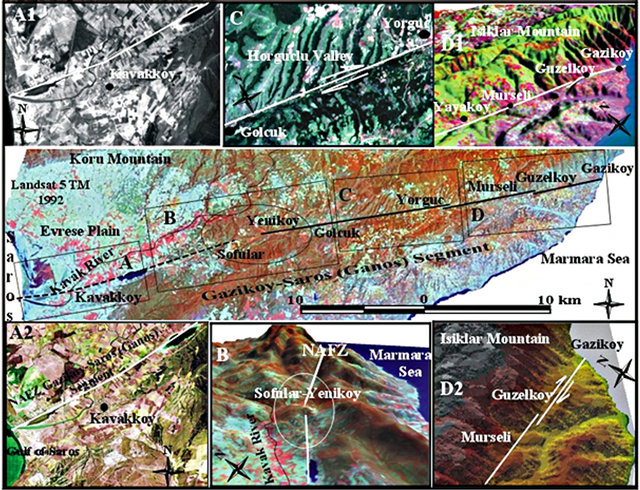
The Gaziköy-Saros segment of the NAFZ comes ashore from the Marmara Sea at Gaziköy, continues to Güzelköy across the steep slopes of Işıklar Mountain. We located three important points on this segment. The steep slopes and triangulated surfaces along the shore to the east indicate that the fault continues parallel to the shore after it has submerged into the Marmara Sea [19]. This first segment of the fault ends between Güzelköy and Mürseli village (nearly Güzeyköy) (Figures 2(a) D1, D2). The first recognized segment ends at the west of Güzelköy
 (a)
(a) (b)
(b)
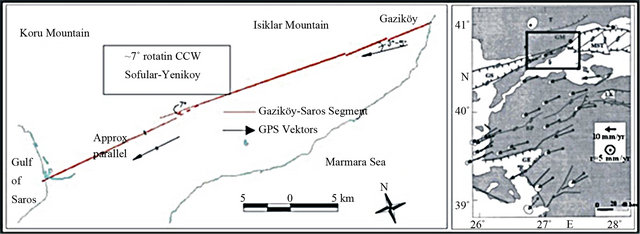
Figure 2. (a) Analysis of Gaziköy-Saros segment on the remotely sensed data, DEM and enhanced remotely sensed data overlain on a DEM; (b) Compare to new geometry with GPS velocity vectors.
then it steps over to the north and continues to the east until it reaches to Yörgüç village. This second segment passes through pass points combining two small hills at the south to the northern high and expresses a significant morphological structure (Figure 2). This segment steps over to the north and continues to the west, and ends
between Yeniköy and Sofular village. A small depression between these two segments is interpreted as a morphological response of right-lateral step-over. This west trending linear segment passes through the Hörgüçlü valley creating another morphological element, which is the offset of small tributaries at the north and south of the valley indicating right-lateral slip (Figure 2(a) C) [19]. 2004). Another discontinuity of the segment is between Yeniköy and Sofular village. The western segment of the fault differs from the eastern segment and it rotates about 7˚ degrees to the south under the Evreşe alluvial plain (Figure 2). This angular change was defined through both available remotely sensed images and digital elevation model (DEM) data and looked at from different angles these models. Rockwell et al. [10] traced the fault with 5 trenches in the Evreşe alluvial plain and clarified
 (a)
(a) (b)
(b)
Figure 4. (a) Enhanced Landsat 5 TM data overlain on a DEM; (b) Enhanced Landsat 5 TM data overlain on a DEM, looking different angle and high.
that the fault reached the Saros bay at the mouth of Kavak River (Figure 2(a) A1, A2). As results, the new fault geometry of Gaziköy-Saros segment has been revealed. This geometry was compared with GPS velocity vectors.
As mentioned previously, the active fault morphology was determined benefiting from merged data taken from Landsat 5 TM and SPOT HRV Panchromatic images superposed with DEM data. Based on the morphological features of these data a detailed surface geometry of the Gaziköy-Saros fault segment is derived. In contradiction with the former studies, in this work I found that the fault segment surface geometry rotates in a counterclockwise direction, unlikely to the previously proposed single line surface geometry. Similarly, the GPS velocity vectors also move in a counterclockwise path. Nevertheless, in the east of Gaziköy-Saros fault segment (Gaziköy portion) the GPS vector makes an effect of 3 - 5 degrees, which impacts on elevating of Ganos Mountains and also causes the fragmentation nature of the morphology. Particularly after Yeniköy-Sofular village’s region Gaziköy-Saros surface morphology flattens in its western part. This is also another proof of the fact that the fault is moving in a counterclockwise direction analogously to the GPS velocity vectors.
4. Conclusions
In this study, based on the morphological features, the surface geometry of an active fault was questioned. Along with the usual morphological components evolving in strike-slip faults in the analysis of the fault segments, the fault pieces are distinguished from each other geometrically based on the emerging push-up, pull-apart and releasing steps, step-overs structures and also on the factors developing into an outcome of these structures were taken as a primary indicators in the analysis. Satellite sensor images has become an important tool for monitoring land cover/use, natural resources, environment and morphological analyzed land surfaces. One of the major reasons behind is that the satellite image data as a difference from the conventional terrestrial investigations and mapping provides a synoptic view, making feasible the delivery of a whole morphology formation in a single image file. Moreover as the image data taken from a satellite is in digital, raster format, this makes it also an easily operating implement in a computer environment that can to be run on multiple levels and processes, producing fast and accurate results. Furthermore, as it is additionally well-known satellite sensors detect information not limited to the visible light range, but to the vast portion of the electromagnetic spectrum creating the prospect of acquiring diverse land surface information.
The data obtained through enhanced remotely sensed images offer surface morphology information with high interpretability. As the boundaries between the features are sharpen up the surface structures are effortlessly determined. The option of overlaying satellite images with DEM data makes achievable the fault morphology to be characterized in a better way. Benefiting from this fact the continuity of the fault could be tracked, and in case of any morphologically continuity disrupted areas geosciences researchers can analyze it without difficulties. Field morphology studies of probable faults are much simpler through using these methods in advance. In this study the surface geometry of Gaziköy-Saros fault was re-drawn and compared with GPS velocity vectors illustrating the fault geometry features. With the advantage of availability of high-resolution data the improvement of such studies will provide valuable contribution to any future work based on fault surface geometry and structure.
5. Acknowledgements
The author would like to thank, Prof. Dr. Okan Tuysuz, Assoc. Prof. Dr. Cenk Yaltırak for their worthy help, and for the support of Turkish Earthquake Foundation and ITU Research Foundation. This paper is dedicated to the memory of Prof. Dr. Aykut Barka.