Event-related potential investigation of different neural pathways for face and pattern perceptions in the human brain ()
1. INTRODUCTION
For most human and non-human primates, face perception of other animals is essential for escaping from or attacking them. A core brain system associated with face recognition has been described [1,2] that involves two components [3,4]. The first, comprising the static figure analysis of shape, color, numbers, and facial patterns, involves the fusiform gyrus of the ventral or temporal association cortex, and the second, perception of motion in features, involves the parietal sulcus of the dorsal association cortex.
Even limited to the static case, the visual cognition system has been investigated systematically to identify various parts of the brain that participate in the instantaneous recognition of face patterns and features, revealing two distinct pathways for visual perception. One pathway particularly emphasizes features of facial emotion; it originates from the retina and proceeds to the pulvinar nucleus of the thalamus, then the amygdala, and finally the inferotemporal cortex [5,6]. The other pathway is necessary for pattern recognition, and it originates from the retina and proceeds to the occipital visual cortex, then the posterior parietal association cortex, and finally the fusiform gyrus. Additionally, this image information is compared with a stored image from the hippocampus or amygdala in the limbic system, which had been adopted in the Papez-Yakovlev circle [7] and recognized in the visual cortex [8]. Finally, both pathways are joined in the orbito-frontal association cortex and proceed to the visual sensory association cortex.
Recently these various brain areas and pathways have been investigated with fMRI and PET [3,9]. Most of these investigational procedures are based on blood density flowing to the organ, which limits time resolution to a minimum of 0.5 s [10] and prevents the acquisition of information concerning the temporal sequence of brain area activity throughout the pathway.
In contrast, the event-related potential (ERP) method is based on the spontaneous emission of the electrostatic potential waves induced by the neuronal activations due to event related sensory stimulation, and it possesses fine time resolution of less than 10 ms [11]. However, drawbacks to the method include the traditional limitation of the fine-grained spacial resolution of ERPs, and the overlapping of ERP waveforms, which can make analysis difficult [10].
ERP has already been systematically applied to the investigation of the components of brain activities [9,12] such as cognitive processing, by circumscribing specific stages of the distinguish, for example the N170 component of face perception [13].
Accordingly, we applied ERP to the present analysis of this perception process.
Here, different activation patterns were observed in response to different types of visual stimuli, supporting the existence of two different pathways in visual perception as discussed above.
2. EXPERIMENTAL METHODS
2.1. Participants
A total of 10 healthy subjects (20 to 24 years old male students) were involved in this study, and nine of them participated in the ERP experiment. They were all righthanded, and had normal vision with or without glasses, and they gave written informed consent about the experimental procedure and approved by the College committee.
2.2. Apparatus and Stimuli
In the present study the ERP wave forms were simultaneously observed on 4 channels using a signal processor (NEC Synax-2100, Tokyo). The band-pass filter was set at a frequency of 0.5 - 100 Hz.
Each subject was laid on a bed covered with a grounded conductive sheet for use of noise reduction in an electromagnetically shielded room, in which without any introduction of AC power lines and covered with a metal mesh wall, through which windows are set for light illumination and for video picture display to the participant.
All the signal wires from the electrodes were extruded from the room through a metal tube and led to respective pre-amplifier outside.
As the stimuli, facial features and geometrical patterns were adopted for comparison.
Nine portraits of actress [14] and 9 geometrical patterns were adopted as shown in Figures 1(a) and (b).
2.3. Experimental Procedures
For the ERP observations, Ag/AgCl electrodes were attached onto each subjects’ head at sites near the occipital visual cortex (O2), temporal cortex and amygdale (T4), posterior parietal cortex (Pz) and frontal and sensory association cortex (Fz), and also the reference potential electrode at the linked ear lobes. Before attaching the electrodes, the skin of the head was rinsed with alcohol and polished with abrasive until a contact resistance of less than 5 k ohm was attained, then it permitted us observation of fine ERP waveforms.
2.4. ERP Recording and Data Analysis
The figures of portrait and pattern were presented in a series respectively on the CRT display in random order that was determined by a statistical random number table in the computer. After the display start at 0ms, the time development of ERP was recorded simultaneously by the 4 electrodes at O2, T4, Fz and Pz.
The display was continued 0.5 sec and after an interval of 1 sec, and it was succeeded 50 times which time schedule is presented in Figure 1(c).
The evoked ERP waveform was recorded and integrated for the 50 times repetition by the signal processor, and it is shown in Figure 2.
The oddball method was adopted by instructing subjects to push a button (un-connected to a circuit, but having an enhancement effect on the mental cognition) when a pre-indicated figure (which was first selected by the subject as favorite) was realized and it was recorded as indicated (I) in Figure 2. There after the indication was changed by announcement to another figure, but the recording was continued unchanged, and the data from the same figure was recorded as un-indicated (U) as shown in Figure 3.
The time schedule of those observations is summarized in Figure 1(c).
These ERP data were obtained almost reproducibly for a long time repetition of the visual stimuli, in the course of indicated and un-indicated. Accordingly, about 1.5 hour continuous operation was adopted as routine, including 50 times sampling both of the indicated and unindicated cases and then 4 trials of the portrait and pattern sequence presentations as depicted in Figure 1(c).
3. RESULTS
The observed ERP data from 3 participants showed clear and similar “indicated” waveforms which were ascertained further several times examinations in later days.
However data from another 4 participants were partly unclear in some peaks. Data from the remaining 2 subjects were obscure, probably due to insufficient attention directed to the indicated display, as evidenced by their similar responses in the “indicated” and “un-indicated” conditions. Accordingly, we adopted the clear data for further analysis, as shown in Figures 2 and 3. Data averaging among the different participants makes the waveform round and fine peak structures are smeared out. As a result, a typical individual clear waveform is adopted in Figures 2 and 3.
In Figure 2, observed ERP waveforms on 4 electrodes at O2, T4, Fz, and Pz are shown in time t (ms), where the oddball method upon presentation is applied and the indicated figure (I) and the un-indicated (U), for either the case of face (F, red line) and pattern (G, blue line) at (I). Also in Figure 3, data of the un-indicated (U) are presented for face (F, orange line) and the pattern (G, green lines).
 (a)
(a) (b)
(b)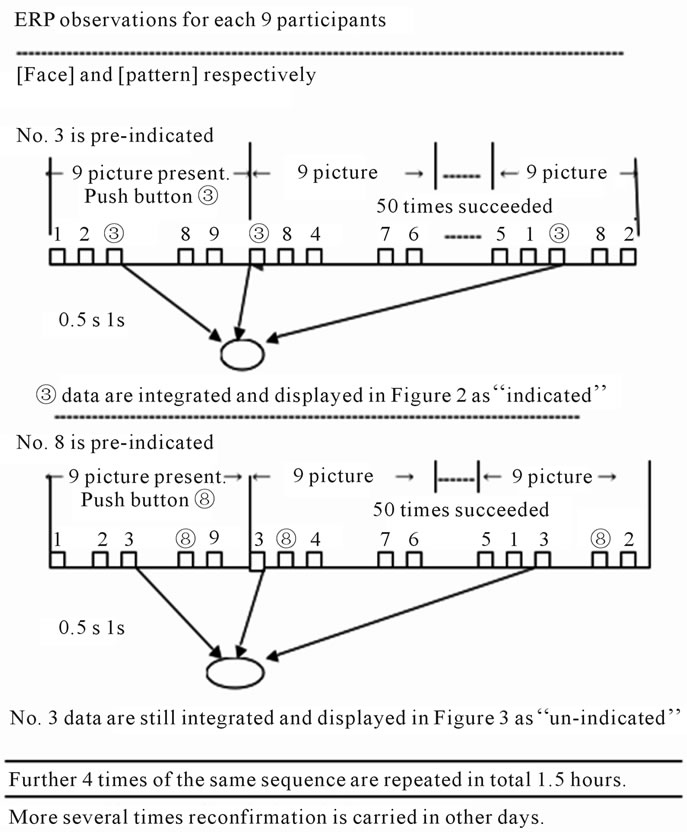 (c)
(c)
Figure 1. Figures presented to the participants and its sequence in the experiment: (a) 9 portraits of actresses’ faces (F); (b) 9 geometrical patterns (G); (c) Time sequence of the ERP observations. Here in both cases, data on ③ are really sampled, and in the former case ③ is pre-indicated by announcement , but in the latter case ⑧ is announced , for data of the non-indicated.

Figure 2. Observed ERP waveforms on 4 electrodes at O2, T4, Fz, and Pz as a factor of time (ms), for the pre-indicated figure (I) in the oddball method, on either a face (F, red line) or pattern (G, blue line).

Figure 3. Observed ERP waveforms on 4 electrodes using the oddball method upon presentation of the unindicated figure (U), which was either a face (F, orange line) or a pattern (G, green line).
As the result, different activation patterns were observed in response to different types of visual stimuli. Many noteworthy peaks can be realized, and they are listed in Table 1 in order of the latency time (t) after the stimulation start. The significant peaks are indicated by asterisks (*), and relevant comments and data already reported by other investigators are also included in the
table.
Most of the dominant peaks corresponding to the geometrical pattern (G) at O2 site agree well with previously reported findings. For instance, those peaks described as the first elicited peak at 100 ms of (F) at Fz and Pz [1,2], and also the face perception peak at 170 ms [13,16-18], and the attention index peak at 300 ms [12] were also observed in the present study both in (F) and (G). In addition, new peaks around N130, N180.190, N250, N400.430, and N470 were found.
In Figure 3, the ERP result of the oddball un-indicated (U) condition is also compared between the face (F, orange) and the geometrical pattern (G, green). The most remarkable difference between (I) and (U) is that the indicated display (I) induced significant peaks. But in (U), most peaks before 400 ms were degraded or diminished.
However, after then, several peaks that could not be observed in Figure 2 were likely to appear, such as those at 400, 520.540, and 700 ms, as shown in Figure 3. To be noted is that these peaks appear after 0.5 sec figure presentation.
4. DISCUSSION
Recently many ERP investigations have adopted multipoints observation methods, using 128 - 256 electrodes for obtaining fine potential distributions on the scalp [5].
Anyhow, most of them showed gradually changing among the electrodes, and then provided smooth potential distribution in space around a few maximum points that are mostly corresponding to the above indicated four points of O2, T4, Fz and Pz. Accordingly we took a dominant view among this four points ERP data as shown in Figures 2 and 3. The primary limitation of ERP experiments is that signal data must be collected from electrodes attached onto the head, and the direct correspondence between the signal and the activity of each brain area can be difficult to determine. However as is shown in Figures 2 and 3, the electrodes do not provide the same averaged signal; rather, they provide specific waveforms and amplitudes reflecting the activity of neighboring brain areas, as shown. For this reason, we selected the 4 electrode points, O2, T4, Pz, and Fz, corresponding to the key brain areas involved in the two-pathway model, which had been also adopted by Bentin et al. [2] as the key points, with some additional electrodes.
The site of the reference potential electrode should also be considered. In this experiment, it was set at the linked earlobes, and some signal depression at O2, and T4 may have been induced by their proximity to the reference [19]. Notwithstanding, in Figure 2, remarkably strong peaks were observed at N130 and P170 for (G) and (F). The placement of a reference potential electrode is an electrostatic potential problem in volumetric brain conduction, and doesn’t matter of the subjects’ (F) and (G) values. Accordingly, differences between the peak heights at O2, T4, Pz, and Fz in Figures 2 and 3 should be considered intrinsic.
Event-related potential (ERP) method possesses fine time resolution of less than 10 ms [11]. Accordingly, we applied ERP to the present analysis of this perception process.
In case of face stimuli (F) in Figure 2, N100 first appears significantly at Pz and Fz, but for geometric stimuli (G), N130 appears at O2. This finding supports the existence of two different pathways and suggests that an initial gate of rapid pathway 1, for faces, is near Pz and Fz, which is considered to be the thalamus or amygdala in the limbic systemNext the second initial gate of pathway 2, for geometric patterns, is the occipital visual cortex near O2; a little bit later. A previous report has described this gate as the so-called N170 peak [13,20], and dominantly related to face perception and originates in the occipito-temporal cortex. But, in the present study, we observed the peak at an earlier time of 100.130 ms.
Most of the significant peaks in Figure 2 are listed in Table 1, indicating that after the start of both pathways, (F) and (G) were detected by different electrodes up to 250 ms, [21] i.e., (F) elicits activity preferentially at T4, and (G) prefers O2. This finding is the second in this study to provide evidence supporting the two-pathway system, with pathway 1 for facial recognition activating the limbic system, and pathway 2 for geometric pattern recognition constrained to the occipito-temporal system.
How is one pathway gate selected and the other closed? When the face image (F) stimulates the retina, visual information travels to the thalamus at 100 ms, and the amygdala is then instantaneously activated. Simultaneously, the second pathway gate to the occipital visual cortex is closed, leading to no detectable ERP in the O2 region.
This situation may be understood simply by observing a typical childhood behavior that something fear glance, at once escape without any looking.
After 300 ms latency, common peaks can be observed in Figure 2 and also in Table 1, in which the same electrodes Fz (N)* and Pz (N)* appear in both of the (F) and (G) columns [22]. Accordingly, the pathways may be unified at this time point in the orbito-frontal association cortex (Fz) and the sensory association cortex (Pz), probably in the stage of conscious recognition because of the attention index notice [9] in Table 1. These kinds of information processing systems and the distributed areas in the brain have been discussed in several previous reports [1-4].
In light of our results, the system under investigation may be summarized and attempted in a diagram expression as depicted in Figure 4.
The ERP waveforms for the un-indicated condition (U) of the oddball method are shown in Figure 3. In comparison with Figure 2, which depicts the indicated condition (I), two points are remarkable. The first is that (U) demonstrates less prominent peak features than (I), likely due to the extent of attention. In the case of (G) in

Figure 4. A proposed diagram of the human visual perception process.
Figure 3, the waveform is almost smooth without any peaks, especially in the range of 300 - 380 ms (around the attention index in Table 1), which suggests that the subjects paid less attention to un-indicated images and patterns. The second is that after 400 ms, some gradual peaks appear in Figure 3, which may indicate that less initial attention is related to later intention of reconfirmations.