Easy Entry and Fast Strengthening Economy with the Monetary and Fiscal Policy ()
1. Introduction
For economic development, constant demographic growth of enterprises is necessary, since with new enterprises come new ideas and increased growth potential. Therefore, it is necessary to maintain conditions for constant new entries in the economy.
When initiating a startup or developing a company or enterprise, there is a need for financial resources for the minimum basic activities of moving the project forward. Crowdfunding is often used for this, and entrepreneurs take out loans even more often. In this case, the question arises: may it be necessary to take some action on the part of the state to spur the process of stimulating the start of new companies in the USA, which will bring more benefits to society since they will generate products and services that will result in the second advantage—creating workers places and the third is bringing revenue to the state budget in the form of taxes.
The reform researched in this article proposes the creation of an easy entry market for starting and developing businesses, decreasing FED interest rates, since it is impossible to start without the capital. Subsequently upon reaching maturity, the business will be subjected to high taxes that will be directed to the favorable business newcomers-oriented infrastructure development. Since it is impossible for newly opened businesses to start and for existing businesses to develop with high interest rates (without taking loans) and having low taxes at the same time.
The novelty of the research lies in the fact that at the moment the Federal Reserve Bank operates under a dual mandate: controlling inflation and employment and making decisions independently of other structures. The reform proposed in this article involves the cooperation of two structures, such as the Federal Reserve Bank (setting interest rates) and the Congress and the Administration (directing fiscal policy) to jointly agree on the reforms proposed here.
2. Theoretical Background: Concept Investigation and Hypothesis Establishment Introduction
In macroeconomics the main factor of economic well-being of any country is its measure of GDP, which is a quite complex term that involves other elements for the precise estimation. Accordingly, GDP and GDP per capita can be influenced by such components of economic processes as FED interest rate and tax revenue, particularly their decrease or increase leading to economic growth or recession. Although economic growth is a multi-step process which may be affected by other factors, for example, geopolitical and geofinancial, but in this article they are considered minor and are not investigated in detail.
In this section, we provide determination of the crucial concepts of the current research, such as GDP, GDP per capita, tax revenue and FED interest rate, as well as the overview of their effect regarding GDP as indicator of economic level. Besides, scientific method of literature investigation and analysis of practical historical cases are implemented to evaluate the result of tax revenue increase and FED interest rate decrease as possible instruments of positive economic development.
The focus of the section is the analysis of monetary and fiscal policy, which is expressed in lowering interest rates as a means of developing the business sector and increasing investment in combination with increased tax revenues with flexible system, as a means of ensuring a sufficient flow of funds into the state budget, which in turn affects economic development. Since the main demand of any startup is capital, low interest rates on loans are seen as an incentive for potential candidates to set up their own business. In other words, low interest rates provide easy entry at the initial stage, and with an increased level of flexible tax revenues system—full taxation of maturity businesses only, minimize the risks of bankruptcy over a longer period. Thus, on the one hand, the state provides support to start-ups at the initial stage, and on the other hand, it ensures the strengthening of the economy as a result of the expansion of the trade market and regular tax revenues from maturity profitable businesses, which constitutes a large share of the total replenishment of the country’s budget.
2.1. Definition of the Concepts of GDP and Its Types, GDP per Capita, Their Functions in Economic Area
Gross Domestic Product (GDP) is an indicator that reflects the market value of all goods and services produced in the country in all sectors of the economy. Only goods for the final consumer are taken into account, and not for the production of other goods. GDP in cooperation with other factors and political solutions serves as the main indicator of a country’s economic development. If the index of GDP shows growing tendency, it indicates successful economic policy and overall productivity increase. By calculating GDP for individual sectors of the economy, it can be found out in which areas there is active growth and where there is a decline. Besides, calculation of GDP is used both to assess the growth or decline of the economic state of a particular country, as well as to measure the global economy and to compare the economies of countries with each other by converting GDP into a specific currency (for example, the dollar). Basically, GDP is calculated annually, but quarterly calculations may also occur for complete evaluation. For example, the US government conducts complex two-stage calculations where GDP values are presented in “quarter groups” annually and the final summary of meanings for the entire calendar year (U.S. Bureau of Economic Analysis, n.d.-a) .
The calculation of a country’s GDP includes private and public consumption in total, government spending, investment, private supply increases, construction costs expanses and the foreign trade balance. During common computation of the rate export indicators are added to the value and imports are subtracted. Among all the components that constitute a country’s GDP, the foreign trade balance has a great meaning. A country’s GDP has an increasing tendency when the total value of goods and services sold abroad by domestic producers prevails over the total value of foreign goods and services purchased by domestic consumers. When this outcome is present, a country is said to have a trade surplus (U.S. Bureau of Economic Analysis, n.d.-b) .
Nominal GDP (current GDP, GDP at current prices) is the value of goods and services calculated at the prices at which they are actually sold this year. Thus, it does not exclude inflation and the rate of price increase, which may result in overestimation of growth index. Nominal GDP is measured either in local currency or in US dollars according to foreign market exchange rates to compare the GDP of countries in financial terms (U.S. Bureau of Economic Analysis, 2000) .
Real GDP demonstrates the number of goods and services and their price calculated within one specific year. This way of measure allows to exclude inflation/deflation from nominal GDP and compare real production volumes in different years. Real GDP can be determined with the use of the GDP price deflator, which represents the price difference between the current year and the base year. Consequently, the measure of nominal GDP should be divided by the deflator to give real GDP. Index of nominal GDP is usually higher than real GDP because inflation is usually expressed as a positive number (OpenStax, Rice University, 2022) . In general, real GDP reflects changes in value of the market and in its turn makes the differences less between productivity rates from year to year. In case of a significant between a country’s real GDP and nominal GDP, it may indicate inflation or deflation in the economy.
Another crucial concept that supplements economic potential of a particular country is GDP per capita that means Gross Domestic Product per person as a part of country’s population. In other words, this measurement represents the concept that the quantity of production or income per person in economy indicates the average rate of output or standards of living. In addition, GDP per capita index can be interpreted through nominal, real (with adjust for inflation) or purchasing power parity respectively (FocusEconomics, n.d.) .
Mainly, the measure of GDP per capita reflects a degree of value of production that can be attributed to each citizen individually. It can also be interpreted as a measure of national wealth in broad meaning as the market value of GDP per person serves as an estimation of prosperity.
Frequently, the index of GDP per capita is investigated in conjunction with other generally accepted standard indicators in order to evaluate domestic productivity of the own country and compare it with other countries’ results. The prominent part of such analysis is to determine two components of GDP per capita—country’s GDP and its population, cooperate and influence general result with the possible contribution to GDP growth. For instance, GDP per capita may grow with a stable rate of population in the result of technological progression, especially in the case when there is a small index of population but high level of GDP per capita. Thus, we can conclude that the country with the above-stated situation managed to create a self-sufficient economy that primarily relies on special resources.
The primary function of the GDP growth measurement is to define the tendency of economic growth by means of yearly or quarterly comparison of economic production and predominantly is provided as a percentage rate. It is a widespread attitude in economic policy sphere as GDP growth is related to the main government policy goals: inflation and unemployment rates (Iowa State University, Department of Economics, n.d.) .
Thus, there is a generally accepted tendency in economic regulation: in the case of a rapid increase in GDP, the central bank may decide to increase interest rates as such a manifestation may indicate an overload of the economy. The same rule works in an opposite way: when the index of GDP is lower than it is expected, the central bank decreases interest rates in order to prevent recession or even may implement an economic stimulus.
On the one hand, GDP rate is quite an unreliable mark of the overall economic progress and positive development with its productivity as a crucial component because the right estimation requires more complex calculation within several sectors. On the other hand, a high rate of GDP is still desirable because in any case it demonstrates economic growth. Furthermore, it is necessary to mention that GDP by itself does not provide any evaluation of the quality of living with country’s standards. However, such criteria as GDP per capita may provide some characteristics regarding the very pattern of living standard inside the country and show the way the average citizen lives—better or worse in comparison to other years or measurements of other countries.
At the same time, when the GDP rate demonstrates an increasing tendency in economic productivity, the value of money also growths. This happens because conventionally each monetary unit can be exchanged for a specific product or service.
It can also be observed that economic growth may have manifestations of deflation, despite a stable money supply.
2.2. Tax Revenue and Interest Rate: Their Role in GDP Growth and Inflation
The definition of the term “tax revenue” means all types of revenues that are collected from income taxes, profits, payments for social security, goods and services taxes, taxes from wages, ownership property taxes, etc.
Essentially, overall tax revenues, which are presented as a percentage of GDP, show the portion of domestic production that is obtained through taxation. Also, tax revenue collection rates are an indicator of control of economic resources by the government itself. The fiscal charges can be obtained calculating the overall tax revenues collected as a GDP percentage. In general, this criterion refers to all sectors of government and is predominantly represented in million USD and GDP percentage.
The next important concept in our section is the tax-to-GDP ratio, which reflects the amount of tax revenue a country receives based on the size of its economy. In turn, this approach is measured by determining the indicators of gross domestic product (GDP). This coefficient measurement supplies a practical overview of a country’s tax revenue because it demonstrates fiscal potential to the current economic situation. Also, this approach allows to observe the general trend of a country’s tax policy and create international comparisons of tax revenues data across countries.
Tax revenues rate is an essential indicator of internal country processes, including its development of nation and political management. Besides, the tax-to-GDP ratio determines the degree of efficiency in managing available economic resources. Following the mentioned statement, it can be concluded that the higher tax revenue rate the country implements, the more it can be invested in the development of infrastructure, health and educational sectors which are the main component of economy growth in the long term.
A fair formula of economic tax balance is revealed by the World Bank and states that the process of economic growth is predominantly based on the 15% or above tax revenues of gross domestic product rate (GDP) of the country (The World Bank, n.d.) . This measure is calculated objectively as such fiscal rate guarantees the necessary amount of finance supply that is able to cover the future investment and keep its gradual movement toward economic growth. Moreover, it should be added that usually all developed countries follow even a higher taxation rate. For instance, 34.1% was the mean index in 2021 determined among members of the Organization for Economic Cooperation and development (Organisation for Economic Cooperation and Development, n.d.-a) .
At present, politicians mostly take into account tax-to-GDP ratio in order to reveal the difference in received tax revenues between several years in a raw as it allows more objectively determine the degree of increase or decrease in fiscal rates. Simultaneously, tax revenues are connected to economic processes and proportionally increase when faster economic growth is detected as well as decrease when recession happens. In percentage terms, tax revenues rise and fall much more rapidly than the GDP percentage index itself. However, to maintain stability in the economic market, a balance is necessary between the ratios of these two indicators. It means there should be no sharp changes in direction of progress or regress, and there should also be a correlation between both measures. A good illustration here is the fact that in 2020 the US took 32nd place among 38 OECD countries in accordance to the tax-to-GDP ratio. In a year after it the US tax-to-GDP ratio got the same 32nd place in the ranking of 38 OECD countries and demonstrated 26.6% (Organisation for Economic Cooperation and Development, n.d.-b) .
The federal funds rate is the interest rate that has a significant influence on the stock market. Generally, different depository institutions, such as banks and other savings, loans and credit establishments, collect a fee in accordance to the current interest rate or so called federal funds rate for short-term loans, for example, overnight. At the same time, there is the discount rate which means a fee that is charged by Federal Reserve Banks in accordance to the current interest rate from depository institutions during collateralized loans (Federal Reserve Bank of San Francisco, 2004) .
Therefore, it is critically important to control the process of inflation with the management of the Federal Reserve which affects the federal funds rate.
The Federal Reserve implements the method of increase of federal funds rates in order to reduce the money supply allocated for purchases. This way leads to a certain increase in money value. The same principle can be observed in an opposite situation: when the federal funds rate is decreased, the supply of money inversely increases. In general, such strategy causes more spending as borrowing is cheaper. The use of a similar scheme can be observed in the central banks of other countries.
Any information related to rising or falling interest rates is often associated with the federal funds rate. In other words, these are the interest rates based on which banks provide loans to each other. This rate is not stable as it may change every day. Thus, due to the enormous influence of this main rate on all other lending rates, it determines the general nature of the current indicators of interest rates—whether they fall or rise.
On a larger scale, such changes can also have an impact on inflation and recession. In a practical sense, inflation is an increase in the prices of goods and services over a certain period of time. This is an absolutely natural process that signals a balanced, strong economy. However, if inflation is not controlled, it can negatively affect the level of purchasing power and lead to its decline.
To track inflation and control it, it is necessary to measure the Сonsumer Price Index (CPI) and the Producer Price Index (PPI). In response to the growth of these indicators by more than 3% per year, the Fed is raising the federal funds rate to control the rising prices.
Generally, higher interest rates will result in less spending by the public, since this trend means higher borrowing costs. As a result, inflation will fall as the demand for goods and services will fall too. A good illustration here can be the situation in 1980-1981 years when inflation rate showed 14% that led to an increase of interest rates to 19%. On the one hand, this rate change was the reason of a severe recession, but, on the other hand, it stopped the inflation. The Fed used the same principle to fight inflation in 2022-2023 by raising interest rates throughout the year (Federal Reserve History, 2013) .
This trend could also have the opposite effect, namely stopping a recession by lowering interest rates. The explanation for this phenomenon is the fact that when interest rates fall, borrowing money becomes cheaper, which leads to an increase in consumption and investments. For instance, an economic situation in 2002 leaded to the decrease of federal funds rate to the range of 1.25% which in its turn stimulated economic recovery in 2003 (Federal Reserve Bank of San Francisco, 2002) . To sum up, such kind of regulation of the federal fund rates—increase or decrease—allows to prevent continued inflation or minimize the scale of recession.
The consequence of rising interest rates is that borrowing money itself becomes more expensive. As the result, it becomes more expensive to buy goods and services for the regular clients, as well as for the business. In practice, this pattern looks like this: along with an increase in mortgage rates, the purchase of real estate becomes more expensive, and in the same way, with an increase in loan rates, the cost of financing business development increases. In practice, this pattern looks like this: along with an increase in mortgage rates, the purchase of real estate becomes more expensive, and in the same way, with an increase in loan rates, the cost of financing business development increases. The combination of these factors leads directly to a slowdown in the economy as consumers spend less. However, when interest rates decrease, the opposite occurs.
2.3. Raising Tax Revenues Combined with Low FED Interest Rates to Promote Economic Growth. Successful Economic Policy of President Bill Clinton
To reach economic growth rates, additional measures and incentives are needed. Among them are changes in the quality of productive capital and jobs, maintaining household incomes, increasing investment in fixed assets, investments in the “knowledge economy”, the development of housing construction and domestic exports. Fiscal policy attempts to find a balance between government spending levels and tax rates to influence the economy, as measured by the tax-to-GDP ratio. In a constant balancing act, policymakers must weigh new taxes against the losses society may face due to those taxes. At the same time, the government is obliged to predict the risks of a possible increase in inflation by regulating federal interest rates but taking into account their impact on the economy in order to prevent an economic recession.
An important component of a strong economy is a stable level of interest rates, as this provides predictability and confidence in assessing future financial prospects and planning investments in the long term. Moreover, the stability of interest rates plays a crucial role in the conduct of Monetary Policy. Accordingly, adjusting interest rates is an important method to achieve macroeconomic goals, including stimulating economic growth, controlling inflation and exchange rates. In general, stable interest rates stimulate economic growth because they encourage businesses to grow, borrow and invest finance. Based on these judgments, the central bank can stimulate economic growth by lowering interest rates. As a result, this solution brings benefits and leads to increased investment on the part of businesses, as well as increased spending on the part of consumers. All these mentioned factors lead to economic growth.
A good illustration here is the example of the situation during World War I and World War II when the Fed took a decision to keep interest rates stably low to simplify the process of financing government debt (Patel, 1953) .
During World War II, it was expected that deflation would follow the war, as happened after the Civil War and World War I. Therefore, after comparing certain consequences, such as high unemployment during the Great Depression and low unemployment during World War II, a current of Keynesian ideas spread. Mainly, Keynesians were convinced that increased private consumption would not be able to prevent a reduction in military spending after the end of the war. Subsequently, this will inevitably lead to depression.
An important element of the Keynesian consensus was the assumption of the practical inconsistency of the applied monetary policy. This line of thought primarily described an economy in a state of stagnation due to liquidity levels and low interest rates, to which the population had to adapt. As a result, the volume and velocity of money in everyday life will change depending on the psychological attitudes of investors. The combination of these ideas led to the conclusion that without control by the Federal Reserve and containment of interest rates on government bonds, chaotic price fluctuations will inevitably occur, which will completely destabilize the government bond market.
Economist John Keynes promoted countercyclical tax policies that counter the business cycle. This means that Keynesians advocated deficit spending on complex infrastructure projects in order to improve employment outcomes and ensure stable wages during periods of weakening economies. Further, followers supported raising taxes to stabilize the economy and prevent inflation during times of rising demand. In addition to this approach, a policy of lowering interest rates was also used, which in turn stimulated investment and, as a result, economic growth. However, when the money supply increases, the above methods do not work and do not bring positive changes.
Keynesian economics was a major current in policy and economic theory from the end of World War II until the 1970s (Jahan et al., 2014) .
Thus, a pattern of positive economic dynamics can be traced precisely with stable or reduced federal interest rates.
However, simply maintaining the level of federal interest rates or reducing them is not enough to transfer the economy from a state of recession to a state of developed progression. In addition to this approach, it is also necessary to reform tax policy, namely, to increase the level of income tax to support the financial needs of various public sectors, as well as their further strengthening and development.
An illustrative example of the implementation of this tax strategy in combination with low interest rate is the period of the administration of President Bill Clinton and his policy, which subsequently led to general economic development and an increase in jobs with a growing standard of living of the population.
Bill Clinton’s main economic focus during his presidency was investing resources in population, innovation, and infrastructure. Thus, there was a need to strengthen the financial position of the middle class and its average earnings, reform education and access to medical care. At the same time, the way to achieve this goal was to improve economic indicators mainly through political regulation of taxation and reorganization of the volume of spending.
The Omnibus Budget Reconciliation Act with a list of tax revenues increases, was adopted during President Bill Clinton’s administration in 1993. According to this act, the income rate was increased to 36% with a further surcharge in the range of 10% for the earners with the highest rate of income.
Along with the above change, the upper limit for the income medical tax was removed, certain deductions and benefits were eliminated, the rate of Social Security tax deductions was increased, and the corporate tax rate was raised to 35% (Congress.gov, n.d.) . As the result of such policy, more than 18.6 million workplaces were created, as well as the S&P 500 index with its increase up to 210% indicates a growth in the stock market (US Bureau of Labor Statistics, n.d.; Yahoo Finance, n.d.) .
Due to lower unemployment rate (5.3%) in 1997 the Taxpayer Relief Act was adopted. Under this act, the maximum capital gains rate was reduced to 20% and a $500 child tax credit was approved. In addition, married couples were exempt from capital gains tax on the sale of primary residences up to US$500,000, and the estate tax exemption amount was increased to US$1 million (U.S. Bureau of Labor Statistics, 2018; Congress.gov, n.d.) .
This tactic of reforming and replenishing the budget to eliminate the deficit by increasing taxes led to changes in the US banking industry. Mainly, Clinton’s policies enabled to keep interest rates low, which in turn had a positive effect on business and attracted a large amount of investment into the economy due to higher tax revenues (Congress.gov, n.d.) . In addition, Clinton signed a free trade agreement and was also the initiator of China’s accession to the world trade organization in 2001.
Having examined the above steps in detail, a pattern can be traced: low interest rates primarily attract current and potential representatives of the business sector, since the availability of a loan provides easy entry due to the opportunity to obtain capital for a startup or the development of an existing business. In the longer term, this will mean higher tax returns to the country’s budget, thanks to a larger number of entrepreneur-taxpayers (who make up a significant share) and, accordingly, an expanded trade market, which contributes to the development of the country’s economy.
Therefore, only an integrated approach that embodies a strategy of containing or reducing interest rates and increasing the rate of tax revenue can have a positive effect on the state’s economy both in the short and long term.
The specific result of adopting the described monetary and fiscal policy is its positive impact on the sphere of business. Low interest rates mean the availability of loans for easy entry, which is ensured primarily by the availability of start-up capital. Consequently, the number of new business projects will grow, the market will expand, and tax revenues to the country’s budget will increase. In this way, all-round support for the country’s economy occurs: on the one hand, the state supports start-up business projects or the development of an existing business to increase its scale and profitability, thereby minimizing the risks of bankruptcy and providing easy entry into the market, and, on the other hand, successful maturity business which replenishes the budget with increased rate of tax contributions. Overall, this strengthens the economy and allows it to develop due to the described monetary and fiscal policies.
3. Statistical and Factorial Analysis of the Datasets
3.1. Comparative Analysis
Influence of tax and interest rates on GDP and inflation
To begin the statistical analysis of the data appendix theory it is necessary to look at the branch of just I graph, such as GDP, GDP per capita and the federal interest rate and the tax revenue from GDP.
For a better understanding of the graph descriptions in the statistical analysis of the data, the least squares method has been used, namely the quadratic approximation and in some measures the Loess method has been used.
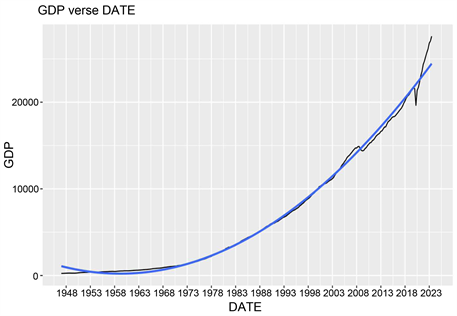
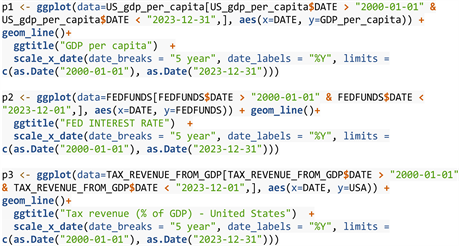
I. GDP verse DATE

II. GDP PER CAPITA verse DATE


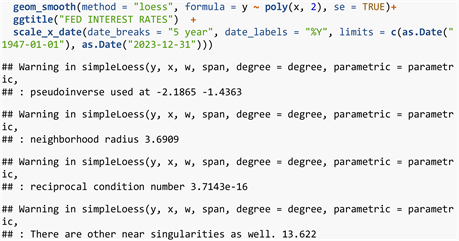
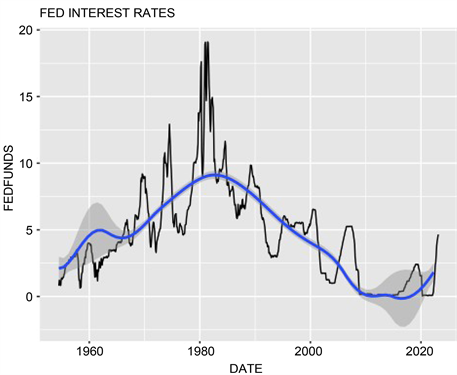
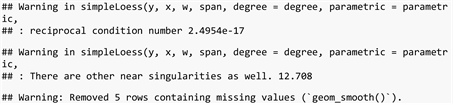
III. FEDERAL RESERVE INTEREST RATES verse DATE in this case, for approximation, we are using Loess parametric regression.
IV. Tax Revenue verse DATE.

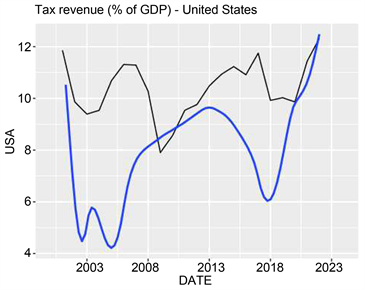
As we see, in the long-term perspective, we can notice the smooth growth. For more detailed picture, let’s take a shorter period, which would more vividly demonstrate volatility.
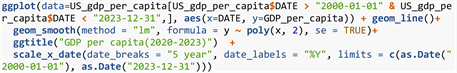
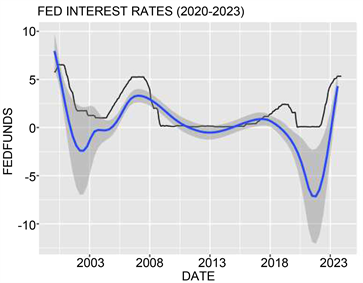
V. GDP per capita (2020-2023).
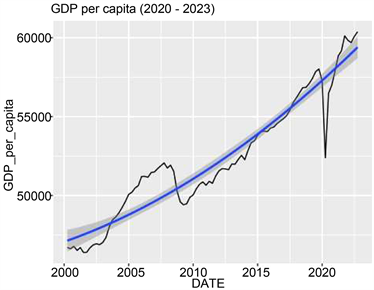
VI. FEDERAL RESERVE INTEREST RATES.
VII. COMPARATIVE ANALYSIS
To understand the correlation between these three main indicators, it is necessary to visualize these three graphs in the same window with same x-axis but different y-axis to track changes happening by year in the time frame 2002 via 2022.

With the combined comparative information of GDP per capita, Federal Reserve interest rates, and tax revenue expressed as a percentage of GDP in front of us, we need to put indicators with key dates to compare the data and determine their correlation and the correlation of treads and elasticities depending on each indicator.

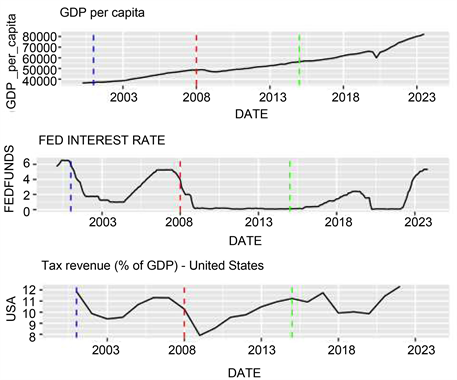
1) Beginning of 2011. 1 January 1—the decrease of the interest rates begins immediately and the growth of the GDP in the long-term is simultaneously present. We also see that the tax decrease is not sharp, and the long-term factor is weightless.
2) Regarding the red stripe indicating the date 2008. 1 January 1 is the day when the interest on Federal Reserve credit rates was at its highest. As a result, GDP growth slowed down in parallel with the process of raising the rates. At the peak of the raised rates the GDP started to decrease rapidly 3 in the case of 2015. January 1, the Federal Reserve continued to hold the level of lending rates and GDP began to rise precipitously despite the raising of Treasury earnings weighting quotas to GDP, i.e. tax hikes.
To mathematically evaluate the effect of Federal Reserve interest rates and tax revenue percentage of GDP. I propose plotting the correlation data so that we can explain the effect and elasticity of GDP per capita relative to FED interest rate and tax revenue percentage. For this purpose, I created a dataset combining the above-mentioned indicators, but only I made the dataset “comb” standardized (see paragraph 2.2).
3.2. Correlation Test of FED Interest Rates Verse GDP per Capita and Tax Revenue Verse GDP per Capita
To ensure the veracity of the study, you first need a statistical analysis, and then the actual to explain, refute or confirm the results obtained mathematically.
Correlation test
First, let’s conduct a correlation test of data pairs such as FED interest rate and tax revenue verse GDP per capita.
Testing correlation of GDP per capita verse FED interest rate:
![]()
Negative result of the correlation test r = −0.682 of the GDP per capita and FED interest rate indicates that the increase of the interest rate has a strong negative effect on the GDP per capita.
Now, it is necessary to test the correlation between GDP per capita and tax revenue:
![]()
As we see, the correlation test result is r = −0.120258, which indicates that there is very weak correlation between the GDP per capita and the tax revenue.
3.3. Linear Regression Assumption and Partial Elasticity Test of Such Correlations as FED Interest Rates Verse GDP per Capita and Tax Revenue Verse GDP per Capita Over GDP
Factual Test Method: the assumption of linear regression
To mathematically confirm correlation, I believe it is necessary to test the linear regression assumption of data such as GDP per capita and Federal Reserve interest rates as well as data pairs such as GDP per capita on tax revenue (% of GDP).
Let’s simulate the visualization model on a data pair such as GDP per capita and FED interest rates using the “lm” method (method of least squares).
![]()
VIII. Scatterplot: GDP per capita vs FED interest rate.
![]()
With the help of the visualization, we can state that the graph clearly satisfies the assumption of linear regression since it satisfies such features: linearity, homoscedasticity, normality, independence, outlier check. Thus, using linear regression assumption test, we can state that the variables have the vividly depicted negative correlation, the mean results of which represent the negative linear correlation. Thus, this theory enables us to make the correlation prediction stating that the increasing interest rate negatively influences the GDP_per_capita.
In addition to our factorial and correlation test, it is necessary to build line formula to also depict line formula of FED interest rate verse GDP per capita.
![]()
As a result, it is known that the additional 1% increase of FED interest rate will result in the 1995 decrease of the GDP per capita.
To determine how the GDP per capita reacts to changes in interest rates it is necessary to conduct a partial elasticity test. Partial Elasticity formula is:
In this case it is necessary to conduct the partial elasticity test.
![]()
The partial elasticity test of the pair of data: GDP per capita and FED interest rate, shows that the partial elasticity equals 0.05025 which implies that increasing interest rate by 1 would result in the reduction GDP per capita by 5.025%. In the calculation of the partial elasticity we used the mean of the GDP per capita.
![]()
![]()
Following the scatterplot with the linear regression the correlation does not satisfy Linear Regression assumption due to it fails outliers check, normality test, and linearity. In addition, we see weak correlation of GDP per capita and tax revenue.
In this case, it is necessary to notice the hesitations, but we can state that there is the weak correlation which states that GDP per capita indicator is less elastic to TAX (tax revenue % of GDP) changes than to FED interest rate changes, which proves that the same changes in the TAX (tax revenue % of GDP) would have less radical result than the same changes in the FED interest rates.
It is necessary to complete the same actions for tax revenue and GDP per capita and, in addition to our factorial and correlation test, it is necessary to build line formula of tax revenue verse GDP per capita.
![]()
3.4. Analysis Summary
Let us summarize the statistical and factual analysis. First, considering such pair of data as GDP per capita and FED interest rate, having a statistical correlation test, we see that the correlation r = −0.68 of these two indicators is strong and negative. Also, by doing a factual analysis, we made a scatterplot of the two indicators and ran a Linear Regression Test, which the two indicators passed. Further, since these indicators satisfied the Linear Regression Assumption, it was appropriate to learn the linear equation of the relationship between GDP per capita and FED interest rate, which showed that if the FED interest rate increased by 1 percent, GDP per capita decreased by 1995 dollars.
Analyzing such data pair as GDP per capita and tax revenue, according to the results of statistical analysis, the correlation r = −0.12 is weak and negative, indicating a weak correlation of tax revenue and GDP per capita. Also, according to the results of the actual analysis, the scatterplot of the two indicators does not satisfy the Linear Regression Assumption due to mobility outliers and absence in the normality of the results of two indicators. As a result, the linear equation is inappropriate for this data set because it does not satisfy the Linear Regression Assumption.
Outcome of the statistical and factual analysis
As a result of statistical and factual analysis, we can conclude that because the correlation of GDP per capita and federal reserve interest rates is stronger than the correlation of GDP per capita and tax revenue, their changes in federal reserve interest rates more actively affect the volume of production and services provided to the economy.
4. Solution: Theoretical Application of the Analysis on the Idea
4.1. Mathematical Simulation of the Idea
To demonstrate how a 5 percent change in GDP per capita radically affects company profitability. Let’s calculate information about the profitability of companies in different sectors before and after the rise in the interest rate by 1 unit. We will be comparing a measure such as revenue. For a more accurate determination I propose to use the indicator Sales per share of the index S & P 500, which will show the averaged picture, as it diversifies the performance of different companies, which will help to determine a universal picture of the effect of interest rates changes.
![]()
![]()
VIIII. Modeling sales per share over time.
![]()
The graph “Modeling sales per share over time” depicts three situations of GDP per capita change over time under different FED interest rates with the application of the exponential change method, where the exponential indicator formula is:
and the final formula of exponentially adjusted sales per share under interest rates experimental deduction is:
The bottom red curve depicts the real-life values of sales per share over time which leads sales per share to result in $1686.8 in the year of 2022.
The highest blue line depicts the sales per share under FED interest rates are zero which leads sales per share to result in $3355 in the year of 2022. And the green line depicts sales per shares under the lowered interest rate by one unit which leads sales per share to result in $2529 in the year of 2022.
Let’s calculate as a percentage how sales per share would change if rates were reduced by one percent in all years from 1988 to 2022.
![]()
As we can see with a 1% decrease in rates, sales per share would have been at least 56% higher than what we actually got.
4.2. Implementation of the Idea
One of the most important issues to start a business is the capital, as it is a fundamental resource, and it can be especially difficult for newcomers to obtain one. Thus, it is possible to attract more newcomers to the business sphere with low interest rates on loans.
In the stages of making a successful startup, the main element is the money resources for the debut of the business, which the startup entrepreneur cannot afford to get under favorable conditions. If the entrepreneur is eligible to get financing from a bank in the form of a loan, then there are three reasons why this startup may go bankrupt under the high interest rate that the financial institution will charge him. If to analyze this situation more precisely, it becomes obvious that the interest rate at which financial institutions (the bank) lends to individuals depends directly on the federal reserve interest rate. It means that the higher the federal reserve rate is, the higher the risk of default on the loan is. Therefore, the financial institution lending to business must increase the credit spread to cover loan defaults, which in consequence increases as well. As a result of this chain reaction, it becomes more difficult to set up a business, because according to statistics the startup makes a profit only after three or four years, and the amount of debt increases every year, which increases the risk of not being able to pay back the loan and going bankrupt.
From our statistical factual analysis, we see that GDP per capita and Federal Reserve interest rates have a very strong absolute correlation 0.68, while GDP per capita has a very weak response to tax revenue (% of GDP) fluctuations, i.e., taxes. Consequently, we can conclude that a change in monetary and fiscal policy is necessary.
I believe that having the existing policy of exempting startups from tax revenue unless they start receiving positive net income, it is necessary to think about creating favorable conditions for the budget financing of new startups. The following order of implementation of the reform is proposed.
1) Since GDP per capita, which reflects companies’ revenues with the volume of services provided, has a strong correlation with federal reserve interest rates, and since federal reserve rates have a significant impact on company productivity, it is necessary to lower credit rates, which firstly will reduce the startup’s bankruptcy risks, help the startup reach profit faster and stimulate synergistic growth of new businesses.
2) Secondly, it is possible to compensate for the budget replenishment by lowering interest rates by increasing the interest in the treasury from GDP, i.e. by raising taxes, because company productivity, that is GDP per capita, has a very weak correlation with the space income, i.e. taxes. When the company enters profit, the company will be considered mature and will already be able to pay tax on net income.
3) In addition to the exemption from the company before the exit to profit, it is necessary to provide the company with tax vacations so that the company could invest its money in its development.
4.3. Idea Summary
To summarize, reducing the federal reserve interest rates and increasing taxes would reduce the risk of non-repayment of loans taken from banks by startups and thus it would also compensate for risk free insurance charges which would make monetary resources more accessible to startups and upon reaching maturity of tax vacations (upon reaching maturity), it is possible to entitle them to pay high taxes. It would create the easy entry economic platform thanks to low interest rates for startups, easy development opportunity for newcomers thanks to tax vacations and it would strengthen the budget due to the already strengthened companies, as a result of this process, GDP will grow, the second is to create jobs and the third is to bring revenue to the national budget in the form of taxes.
5. Conclusion
Considering the material investigated above, we come to the conclusion that an integrated economic approach with lowering interest rates or curbing their sharp jump, as well as increasing tax revenues, has a positive effect on economic growth in the short and long term. The described method directly influences the indicators of GDP and GDP per capita, which in turn reflect the economic development of the country or its stagnation. Moreover, the indicated approach to economic regulation can control or completely minimize the manifestations of inflation, as well as preventing an economic recession. More specifically, these effective monetary and fiscal policies provide easy entry for business newcomers through low interest rates on loans. Thus, borrowing initial capital as a key element of a successful start-up becomes more accessible, which attracts more candidates to begin their own business. In turn, increased tax revenues on maturity businesses that bring good profits, in combination with low interest rates, provides more favourable conditions for starting a business, since it minimizes the risk of bankruptcy and the inability to repay the loan in case of insufficient profits (on average, payback business project and reaching a stable profit takes 4 - 5 years). Consequently, stable budget replenishment constant contributions from a successful operating business and investments improves economic performance.
In the theoretical section, comparative and scientific methods were used, which made it possible to draw an analogy with our hypothesis and find real examples of the implementation of the outlined economic method in practice within different years. A good illustration of the application of the method of stabilizing and reducing interest rates along with increasing income taxes is the period after the Second World War and the period of Bill Clinton’s presidency. Such a political decision regarding the economy made it possible to maintain an economic balance, control inflation and prevent an economic recession in the long term. At the same time, with the described monetary and fiscal policy it became possible to expand the trade market, stimulate business with more attractive loan conditions and, in turn, replenish the budget and attract more investments for economic development.
In the practical part, the comparative method of analysis was used to clearly prove our proposed hypothesis. Thus, the plotted graphs and tabular values for different time periods indicate that the opposite actions relative to our hypothesis lead to a significant decrease in economic indicators. Comparison of values regarding different policies for regulating interest rates and fiscal charges confirms our hypothesis that during periods of decreasing interest rates and increasing tax revenues, high rates of economic growth are observed.
All in all, the monetary and fiscal policy of lowering interest rates and increasing taxes with a flexible system for business provides not only local benefits—easy entry and minimization of risks for a startup, but also a stable budget replenishment and investment on a large scale, which in turn strengthens the economy.