Visualization of Landscape Changes in a 3D Environment Using the Storytelling Approach—The Example of the City of Pristina ()
1. Introduction
Landscapes are constantly changing due to the human interaction with the natural environment. Historical maps, landscape paintings and drawings give humans a visual impression of how a specific landscape looked in the past. Humans are interested in detecting landscape changes and being informed about them. In landscape changes, the relationship between humans and the natural environment is addressed to understand the consequences of these interactions in ecological, economic, and socio-cultural contexts (Sheppard, 2005) [2] .
As Sheppard (2005) noted, the community has become increasingly concerned with the visible effects of environmental change, especially in landscapes. For many people, understanding the change is linked to seeing its effects, and visual simulation is playing an increasingly important role in communicating landscape changes. Unlike technical language and information, visual images are easily readable and understood by the public. Sheppard (2005) presents a concise history of landscape change visualization techniques. Over the past 15 years, there has been an increment in investigation projects looking to create or apply technological tools for 3D landscape modeling [2] . According to Svatonova & Rybansky (2014), with the help of visualization, a realistic idea of the presented spatial relationships, landscape changes, and environmental processes can be created [3] . Sheppard (1989) argues that mapping landscape changes is a fundamental mission of cartography [4] . Bogucka & Jahnke (2017) agree and state that mapping the landscape is the basic mission of cartography. Landscape changes can be visualized with different techniques and in various forms. Traditionally, the changes have been visualized using topographic maps, photographs, drawings, and paintings [5] .
Since the 1960s photographs and photomontages have been widely used and since the 1990s the improved capabilities to link CAD, GIS, and landscape visualization software have substantially enhanced the possibilities for digital representation in a 3D environment [2] . Static geographical phenomena need to be described by size, location, shape, and meaning while location together with time describes dynamic phenomena [6] . In recent years, important advances in computer graphics have created exciting new opportunities to visualize our environment in three or four dimensions (where it can be animated over time or moving through space). Presentation of landscape visualizations can be static or dynamic, with different levels of interaction, and in immersive or non-immersive displays [4] . This results in a major interest in the landscape and environmental professions. Recent important developments include a highly realistic representation of vegetation, an efficient display of the terrain, and the automatic generation of landscape models and images from GIS-based data [7] found, that nowadays a common approach is to compile data for a study area in a CAD or GIS database and create three fundamental sorts of 3D yields out of it. According to Appleton et al. (2002), there exist three fundamental sorts of 3D yields, which are:
1) Rendered images (or scrolling panoramas) from defined viewpoints,
2) Animated sequences (showing fly—through along specified paths or changes over time),
3) Real-time models (or virtual worlds) where the user can freely navigate a landscape [8] .
In his research from 2005, Nicholson-Cole found that landscape visualizations included facilitating engagement (raising interest in an issue), developing shared understandings (social learning), collaboration (reaching agreement on a course of action), and education [9] . Nicholson-Cole (2005) classified landscape visualizations as follows:
● Engagement (level of interest, and attention),
● Cognition (related to knowledge, awareness and understanding),
● Affect (related to feelings, perceptions, and emotions),
● Behavior (related to changes in the behavior of the viewer) [9] .
Consequently, several visualizations of landscape changes exist. Several examples have been collected and analyzed for this thesis. For a better overview, the visualizations have been categorized into four different groups: 1) 2D visualizations, 2) 3D visualizations, 3) 4D visualizations, and 4) visualizations in virtual, mixed, and augmented reality.
The four categories will be explained in the following subchapters.
The main objective of this paper is to investigate how textual descriptions of landscape changes can be transferred and attractively communicated in a 3D model using the storytelling method.
This overall objective can be divided into two sub-objectives:
1) Visualization of textual descriptions using the storytelling method.
2) Evaluation of the effectiveness of the visualization (3D model and projection).
2. Literature Review
2.1. Visualization of Landscape Changes in 2D
In landscape visualization, visualization objects are the equivalents of mapping objects in two-dimensional maps [10] . Most visualizations of landscape changes simply use one, two or more maps in a 2D environment. These maps are placed next to each other in order to allow the map reader to easily compare two or more different stages and to communicate the landscape change. Cajthaml & Pacina (n.d.) argue that old maps provide a large amount of information about the historical landscape. In addition, georeferencing, vectorization, and change analysis can lead to impressive results. Changes can be displayed as area change values, classic printed maps, or online mapping applications. 3D landscape printing is a bold new method for user-oriented visualization [11] .
An example: Below in Figure 1, the difference of “Mount St. Helens” before and after the eruption is shown by a photograph taken from the same viewing location. Figure 1(a) shows the situation of Mount St. Helens before 1980, before the collapse of the dome complex. It can be seen very clearly in Figure 1(b) the change after 1980 when the eruption occurred.
The map in Figure 1, (a) shows that the volcano is a cone with a height of 9677 feets and the landscape before the eruption. The map on the (b) shows the topography of the mountain as it is today with the 8363-foot height of the peak. The event dramatically changed the volcano and surrounding land in southwestern Washington.
The “Swiss World Atlas” used the same map extract and a shaded relief to make the landscape visible on a map. The same colors are used for forests, except that in Figure 2, after (b) the eruption you can see the difference in the color of the forest
![]()
Figure 1. A picture taken from the same viewing location, showing Mount St. Helens before (a) and after (b) the eruption.
![]()
Figure 2. Mount St. Helens before (a) and after (b) the eruption in a topographic map.
and this is due to the eruption. The appearance of isohypse can also be clearly seen where the quota is 2550 (see Figure 2).
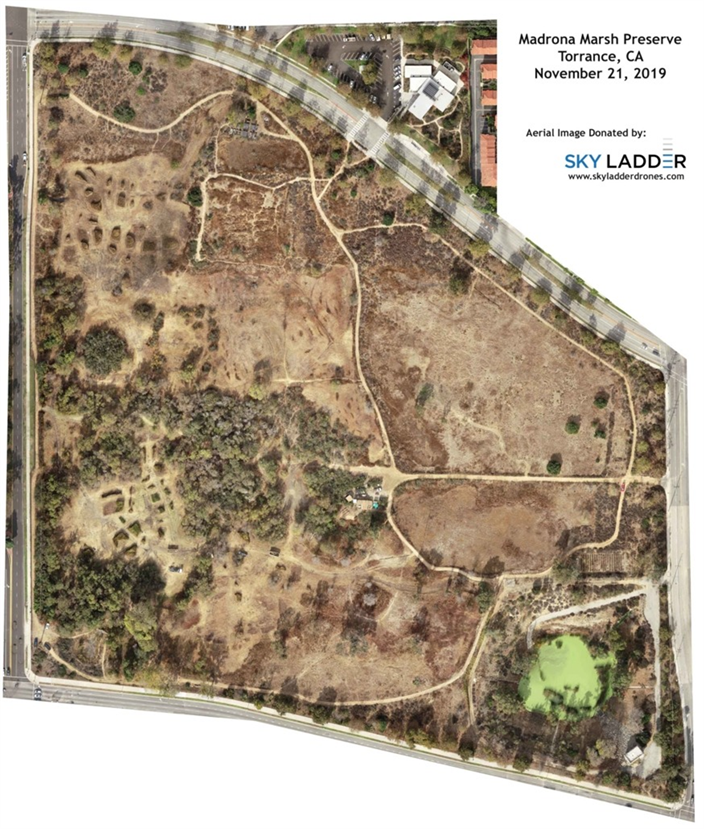
Besides maps, also satellite images and aerial photographs are used to present the landscape change in 2D in a visual way. An example is the visualization of “Madrona Marsh”. The Madrona Marsh in the city of Torrance in the region of Southern California looked like before and after a string of storms (see Figure 3). Many people find aerial photographs easier to understand than maps, possibly because these photographs provide more clues about the landscape. People
(a)
![]() (b)
(b)
Figure 3. Madrona Marsh before (a) and after (b) a string of storms.
with low map-reading skills tend to prefer photorealistic landscape visualizations [12] . Aerial or panoramic photos not only bring out the participants’ local knowledge, but also give the participants a sense of familiarity and help to make comments about the landscape [13] .
Also, visualization examples exist where the landscape change is shown in more than one map, simply by adding a map overlay, by highlighting and by using transparency to show different stages. An example of this is the “renaturation of the Lippe in Paderborn-Sande” 5 where in the first map (a) the development of the Lippe with its profile cut deep and the floodplain can be seen, wherein in the second map (b) an overlay is used. With the help of the overlay, users get new information as about the renaturation and bed evaluation. In the third map (c), the authors added another overlay for humidity and roughness (see Figure 4).
In total, eleven examples have been analyzed, Table 1 gives an overview of all examples and the visualization method used to visualize the landscape change.
In the example of “Lippe Paderborn Sande” the landscape change is shown with more than one map by adding a map overlay, highlighting and using transparency to show the different stages.
The example of “Beirut” shows the big explosion in the Lebanese capital. To show the landscape changes, aerial photographs and satellite images are used in accordance with 2D maps to show the city in ruins before and after the big explosion in the Lebanese capital.
In the case of “Nuremberg”, landscape changes occur in different places such as Port, Central Station, City Center, Castle, Main Market, and Nuremberg. The changes can be clearly seen in the development of construction and nature. In the case of the Port, four satellite images are displayed showing the changes that have taken place over the years. With the help of a time series, users can understand information about the city and the years of change.
In the “Munich” example, satellite imagery and times series are used. The Frauenkirche, Central station, Sendlinger Tor are the places where landscape
![]()
Table 1. Analyzed examples from visualization of landscape changes in 2D.
![]() (a)
(a)![]() (b)
(b)![]() (c)
(c)
Figure 4. Renaturation of the Lippe in Paderborn-Sande.
changes are shown among the years 1963-1978-2009. The changes appeared in the great development in construction as well as in nature.
In the “Waldkraiburg” example, the visualization methods used are the presentation of satellite imagery, times series and overlay. Landscape changes appeared during these years 1963, 1977, 1994 and 2009. The changes could be seen more from 1963 to 2009 in greenery and construction.
In the examples of “Neckarland”, Saxon Switzerland, and the Swabian Alb, topographic maps (ATKIS data) were scanned, georeferenced, edited and used as a map base.
To sum up, the following methods have been used individually or in combination in different 2D visualizations: 2D map (s), 2D satellite image (s) or aerial photographs, Animation, Overlay, Highlighting, and Time series.
2.2. Visualization of Landscape Changes in 3D
Landscape visualizations are specific forms of geo-visualization, which can also represent the visual landscape in perspective 3D views and with varying degrees of realism [10] According to Egberts & Bosma (2014), 3D visualizations are flexible and effective media for conveying complex spatial or geographically-based information to a varied audience. They also convey the so-called “effective” qualities; these are characteristics that make viewers experience emotions towards the environment, such as excitement, fear and attraction [10] .
Bogucka & Jahnke (2018), describe the landscape change of the “Royal Castle in Warsaw” that has been visualized using the Space-time cube. The Space-time cube can be viewed on a 3D globe (Caesium). Cases of utilization for progressed space-time visualization strategies are directions of moving objects as well as occasions, which are happening at distinctive places and at distinctive times [5] (see Figure 5).
Popelka & Brychtová (2011) use five visualization components to precise the spatial-temporal change within the “City of Olomouc”. Textual information, historical and contemporary photographs, georeferenced historical maps overlaid over a current orthophoto, a 3D map and a photorealistic model are used [14] . According to Popelka & Brychtová (2011) changing the transparency of the old maps, the historical situation can be directly compared with the modern situation [14] (see Figure 6, Figure 7).
![]()
Figure 5. The model of the Royal Castle (a) in space time-cube for landscape changes depiction (b).
![]()
Figure 6. Flash application for comparing two images from different time periods.
![]()
Figure 7. Flash application for comparing two images from different time periods.
A large number of historical maps, prints, and paintings exist of the “Honselaarsdijck Palace” and its surrounding landscape. The static images offer only a limited degree of interactivity and perspective (see Figure 8). From digital color-prints of historical drawings and paintings, some relevant topographic information about the outward building and garden appearance of the Palace Honselaarsdijck estate is extracted. Historical maps and paintings can be upgraded to a 3D virtual environment.
For example of village “Shimo-Okubo” located in Japan visualized the landscape change by using drone images and arranging them in an animation [15] .
Parts of the “City of Presov”, Sekcov have undergone major changes over the past 50 years. Creating virtual city 3D models helps to better understand morphological and also functional changes in the city. With the help of the times series, a 3D city model city of Sekcov the changes in land use and new construction sites (apartment blocks, schools and other facilities-presented in a different color) from 1959 to 2012 have been visualized.
![]()
Figure 8. Palace Honselaarsdijck in year of 1683 and 2008 13.
The authors of the “Usti” example focus on landscape reconstruction and created a database of vanished municipalities in the Usti region. Besides aerial images, chronicles, historical photographs, old maps are used as the main visualization component. The old maps provide a huge amount of information about the historical landscape. The Usti project shows that georeferencing, vectorizing and change analysis can lead to impressive results. All Changes can be presented as values of area changes, classic printed maps, or web mapping applications [14] .
The visualization examples that have been found and analyzed within the thesis are summarized in Table 2.
To sum up, the following methods have been used individually or in combination in the different reviewed 3D visualizations: 3D map (s), Photorealistic 3D model, Animation, Overlay, Highlighting, Time Series, Orthophoto/Aerial images, Textual information
2.3. Visualization of Landscape Changes in 4D
Objects of more than three measurements can be utilized to show geographic wonders that happen in space, time, and scale. An example of a visualized landscape change in 4D is “The Stolen Heart Video Map”. The example uses 3D objects with interactive projected layers (animation) on top of a 3D model to show time periods. The Stolen Heart Video Map applied aerial views of Berlin’s city center from 1933 to the present day. The video content is incorporating archival images and topographic time-lapse elements (see Figure 9).
![]()
Table 2. Analyzed examples from visualization of landscape changes in 3D.
![]()
Figure 9. Stolen heart video map projection (left), extract of Berlin city center with projected orthophoto (right).
Another example of a visualized landscape change in 4D is “The Berlin Wall”, an animated story projected on top of a 3D model (see Figure 10). The Berlin Wall story combines text, audio, and small details like moving planes, and the line of change of the wall to visualize the event.
Appleton & Lovett (n.d.) describe a visualization of a landscape change in 4D in “White Bastion fortress, Sarajevo”. The 4D virtual presentation displays the historical development of this cultural heritage object through storytelling combined with interactive 3D models of the Bastion in various time periods. The “White Bastion” fortress story combines the time series of aerial photographs, interactive 3D models, and information about new building demolitions (see Figure 11). Casein an example showing the change of the” City of Verona” historical aerial photographs are used with dense image matching algorithms to realize 3D models of the city in different years. The models are used to study the urban development of the city and its changes through time [16] .
In total, five examples have been found and analyzed. A summary of the found visualization is shown in Table 3.
To sum up, the following methods have been used individually or in combination in the different 4D visualization: 3D model (physical), Aerial/satellite images or historical/archival Images, Animation, Overlay, Virtual reality, and Time series.
![]()
Table 3. Analyzed examples from visualization of landscape changes in 4D.
![]()
Figure 11. Sample images of the time series: 1954, 1981, 1997.
2.4. Visualizations in Virtual, Mixed and Augmented Reality
Eve (2018) agreed that the prospect of recreating a historic environment with virtual reality (VR) techniques is so enticing. Augmented reality (AR) is a way of combining digitally created content with the real world and also it is a part of the wider concept known as mixed reality (MR). Mixed reality is generally approved as a way to seamlessly combine our perception of the real world with digital or created elements [17] . Eve (2018) furthermore described the term augmented reality as a combination of the real scene viewed and a virtual scene generated by the computer in which the virtual objects are superimposed on the real scene [17] .
In an interactive environment, the maps are mostly arranged within an animation. An example is described by Houtkamp et al. (2014) in the project “Things have changed”. The VR visualization is created using topographic maps made in 1900 and 2006 in a region in the southern part of the Netherlands. Navigating the environment, viewers become aware of the effects of landscape features on their viewing points [18] . The animations of the historical and current landscape are juxtaposed and presented to the user together with a 2D route map for navigation purposes (see Figure 12). The immersive visualization offers the user the opportunity to explore the transformation from a landscape to a small-scale urbanization and natural habitats in a characterized modern landscape from large-scale, man-made interventions.
For the “Rome Reborn project”, a virtual reconstruction was created of the entire city of ancient Rome. The primary objective was to spatialize and present information and theories on how the city looked at that moment in time; and, the secondary aim was to make available the sources of archaeological information and the speculative reasoning supporting the digital reconstruction. The Rome Reborn project includes high quality graphics, precise textures as well as environmental elements (animated bodies of water, fog, clouds), to create a more attractive, immersive experience for the users (see Figure 13 and Figure 14).
Case study of the “Royal Castle in Warsaw”, Poland has undergone many transformations in its appearance during its existence period since the fourteenth century till nowadays. The primary objective was to explore the visual design aspects of the space-time cube in mixed reality [19] . Royal Castle in Warsaw includes map elements implemented in the MR space-time cube hologram: 3D
![]()
Figure 12. Topographic maps in the time series: 1960, 2006.
![]()
Figure 13. A digital model of Ancient Rome 1.
![]()
Figure 14. A digital model of Ancient Rome 2.0.
space-time cube, Interactive map legend, landscape features, text, time subintervals (see Figure 15).
In total, three examples have been found and analyzed. A summary of the found visualization is shown in Table 4.
To sum up, the following methods have been used individually or in combination in the different Virtual, Mixed and Augmented Reality visualization: 3D models: Photorealistic images, Space-time-cube, Highlighting, Time series
2.5. Narration of Landscape Changes
Woodfin et al. (1999) described the term landscape narratives as the interaction and reciprocal relationship that develops between landscape and narrative [20] .
Visualized information is information converted into a spatial form and therefore, in principle, suitable for current spatial analysis techniques [21] . The narrative function of the text is aiming to draw the reader into a shared involvement experience or a concrete story. Often these relate to personal encounters, in some cases incorporating direct dialogue [21] .
A narrative text is a series of written events that are significant. A story tries to solve important, problematic events or entertain its readers. Readers generally tend to observe a text in five unique dimensions which are: place, cause, time, cause and effect, and character(s). The descriptive text focuses on the use of plain text attributes, forms, and constructs that classify or categorize events, objects, and characters [21] .
![]()
Table 4. Analyzed examples from visualization of landscape changes in virtual, mixed and augmented reality.
Herman (2001) defined narration as the representation of the motion within coordinates, coordinates of space, and time. Reading the story Herman suggested interpreting it with horizontal and vertical movements and narrative events of the text. The horizontal narrative axis through the coordinates of space and textual time includes the linear movement of the characters, while the vertical axis includes space and time. A narrative may be a semiotic representation of a series of related events in a transient and casual way [22] . Narratives can be built employing an assortment of semiotic media: composed or talked dialect or images. Narrative structures may be more expansive in artistic texts, but narrativization is one of the foremost common ways of establishing order and a viewpoint on experience [23] .
Therriault & Raney (2007) state that more theoretical concepts are represented in expository text, allowing for the elucidation of new information, e.g., by explanations, justifications, and persuasions. Through its narrative and descriptive functions, the text provides the narration of stories, but through exposure, it can also give imagination; may represent action over time [24] .
Mapping narratives comes with its challenges of breaking the narratives into pieces of places to resolve the complexity of identifying their actual location. In addition, mapping narratives can be particularly challenging as geometry and geography will need to be linked. Caquard & Cartwright (2014) found that landscape narratives tend to be conceived primarily in terms of literal storytelling [25] . Mapping narratives can have a double purpose: exploring the geographical structure of a story and the impact of stories on the production of places [24] . Recent technological progressions have also modified the connections between maps and narratives. Places showing up in narratives, such as books and historical archives, can presently be found and mapped automatically [26] .
Landscape changes are often simply described with texts and supported by some photographs. Within cartography, the fundamentals have been described on how the texts can be mapped.
2.6. Storytelling in Cartography
The concept, the focus of the story, which enhances the ability of maps to communicate the same information in the narrative text on a map was developed by [1] . The focus of the story provides a more dynamic representation of important elements in the narration of a story by applying the structural elements of the text versions of a story. The essence of representations that use the concept of storytelling means describing what is important to the story and eliminating redundancies. However, as the story unfolds, the map and its elements may change over time.
Mocnik & Fairbairn (2018) depict, maps are great at representing geographic space, but texts have a more grounded affordance of telling a story than maps. Telling stories is, in any case, important to create information more personal and to capture the map user’s attention [1] . Storytelling describes a communicative process that passes on a story in an arrangement of events. Caquard (2013) describes the concept of “storytelling” as a form of spatial expression that demonstrates personal environmental experiences and contributes to creating a sense of place [24] .
Boer et al. (n.d.) describes a story consists of two types of events: the presumed and inferred events, such as expectations and imaginations, and the explicitly presented events. The plot of the story includes explicitly presented events, but also non-digestive visual and audio materials that are not part of the story, e.g., background music [27] .
Poletti (2011) describes seven essential components of digital storytelling: points and perspectives, drama, emotion, economics, rhythm, voice gift, and quality soundtrack. Perspective helps to “realize” history; the point of view makes it easy to personalize the story; the drama element helps the audience perceive the structure of the point of view powerfully and not casually. Emotion takes the place of holding the listener’s attention. Perspective and emotion give context to the influence of the narrator’s voice gift in telling a story [14] .
Narrative components are inalienably incorporated in every printed or digital cartographic product [28] . Nevertheless, they have been dismissed or ignored in most map concepts. In today’s cartography, narrating is basically accomplished by story maps where users get additional context-based, narrative information as clarified in [29] [30] emphasizing that users way better memorize stories than pure facts. In the example of a hostage-taking scenario, they provide a story script that, first gives an outline of the scene, then zooms into certain locations while highlighting entities and adding content. Gershon et al. (2001) also promote the use of metaphors such as a comic-like presentation [30] .
Storytelling is a centuries-old tradition of describing events in such a way that the audience is able to create mental images. Storytelling is known as a vital form of communication. However, digital media presents new opportunities in storytelling for the purpose of education, entertainment and marketing [31] . The process of telling stories from data should start with data exploration followed by story formulation, and then telling the story. Lee et al. (2015) summarized the three broad phases in the “Visual Data Story Process (VDSP)” [32] (see Figure 16).
The three fundamental stages are: Explore the data, make a story and tell a story. The methods aren’t linear: a few of the parts have to be repeated recursively. A story can be separated into four stages: data analyst, scripter, editor and presenter.
3. Results and Discussion
This chapter outlines the principal results of the research, analyzes how the research objectives were addressed, and answers the research questions formulated in chapter 1.
The first subchapter 3.1 describes the final practical result and addresses research objective I. Chapter 3.2 approaches research objective II. The set-up of the user study and information about the study participants are given. The user study results of the questionnaire and the interview will be discussed in detail.
3.1. The Prototype
A prototype of a 3D model with a projection on top of it was developed within
![]()
Figure 16. The process of storytelling process by data (Lee et al., 2015).
this thesis. The case study tells the story of the landscape change in the City of Pristina using the storytelling approach in a 3D environment. The key element of the visualization is a timeline. The types of media to be used and animated are cadastral maps, orthophotos, texts, graphics, and background sound. The main landscape change has occurred from 1893 until 2018 is Marshall Tito Street where it has been transformed into the main squares of the City of Pristina. At the location of Marshall Tito Street are now the Zahir Pajaziti Square and the Mother Teresa Boulevard.
In the City of Pristina are many objects that have an old history and are important, but finally 10 historical buildings have been selected due to the framework defined by the thesis. The 10 buildings have been mentioned in the available texts describing the landscape change of the City of Pristina. Each of these buildings represents a story in itself. During the years 1893-2018, all buildings were constructed, rebuilt and served for certain works. The projection starts with animated numbers counting down from 1893 to 2018. The first element of the timeline is the presentation of the cadastral map of 1893. The cadastral map has been selected to be presented as it is the only one given from 1893. In 1893 there was no orthophoto since the realization of orthophotos in Kosovo began in 2001.
As orthophotos have the positive attributes of a photograph such as details and timely coverage, the orthophotos from 2001, 2004, 2009, 2012 and 2018 have been used later in the timeline. The voice was used for narrating the main information for all the 10 buildings. In addition to the voice, the spoken text was also displayed in a shorter version in a reserved section on the 3D model. Objects and roads are colored with different colors (yellow, white) in order to draw the participant’s attention to important information in a text. Yellow is displayed when objects and roads are shown one by one with the most important information, while the white color appears when all objects and roads are displayed at the beginning.
Two materials were utilized for the 3D model: The PLA material is used for the creation of the 10 buildings; The wooden material is used for the presentation of the roads and boulevard. The reason for this combination was that the cadastral map and orthophotos can be visible on top of the transparent PLA material and will also be visible on top of the wooden material. In the following, some stages from the realization of the prototype will be shown. These stages are the sequences taken from the animation.
The following sequence is the presentation of the cadastral map of 1893 and continues with highlighting Marshall Tito Street and the 10 buildings presented in the 3D model. The selection and combination of white and yellow color was done for reasons of transparency in the wood material (see Figure 17).
The next sequence highlights the 10 selected objects without the cadastral map in the background. The sequence starts with information on the features of each object and archival images displayed on the right side of the 3D model. Text is always supported by voice. The landscape change from Marshal Tito Street to Mother Teresa and Zahir Pajaziti Boulevard is narrated (see Figure 18).
![]()
![]()
Figure 17. Cadastral map in 1893 with highlighted buildings and street.
The projection finishes with an orthophoto from 2018 and information about Pristina today given by element of voice. Finally, all roads today and the ten (10) objects are highlighted (see Figure 19). The animation is seven minutes long. The text written and spoken is in Albanian language, because the user study participants will be free to speak and give feedback in Albanian language. Details about the study participants, how the evaluation was conducted and how the user evaluated the prototype, are given in the next sub-chapters.
3.2. Study Design
This chapter now presents the outcomes of the user’s participation in the evaluation of the prototype: questionnaire and interview responses. In the latter part of this chapter, both the quantitative and qualitative analyses are combined to derive insights.
An exhibition prototype was installed in the amphitheater of the University of Pristina. To evaluate the prototype created with the case study, participants are invited to visit the exhibition and give feedback and comments. The study was anonymous and not monitored. The time required to answer each question about the story as well as the time and self-exploration notes was determined by the
experimenter.The participant had to fill in the first form with some general questions about their profile as well as questions about previous knowledge concerning the changes that have occurred in Mother Teresa and Zahir Pajaziti Boulevard. After entering and filling in personal data in the first form, users were asked to explore the exhibition themselves one by one. The exhibition prototype included the wooden base plate with the 3D models of the buildings with the dimensions of 1.50 m × 1.25 m × 0.80 m. To use the selected area with the 1:500 ratios, the projector holder was 4 m and 30 cm high (see Figure 20).
4. Analysis of the Questionnaire Responses
The evaluation was divided into two parts, a questionnaire and an interview.
In order to answer the research question under objective II, it was necessary to first ask the users about their experience and knowledge about the landscape changes taking place in the case study area. Besides, it was necessary to know if they had prior experience in landscape visualization in any environment.
According to the responses related to the participants’ profiles (age and highest completed degree), four participants between the ages of 20 to 30 have completed a bachelor’s degree Three of the participants finished geodesy and one of the participants finished a bachelor in department structural, while three of this age group have completed a master’s degree in cartography. Three from the age of 31 to 40 have completed the master’s degree and are geodesists by profession. Six participants in the age group 41 to 50 have completed master’s degrees and doctoral degrees in several disciplines as geodesists, architects, graphic and cartographers.
Three participants in the age group 51 to 60 years have completed their doctorate and are with occupation as structural, architect and geologists. And finally, a participant with an age group of +61 has completed his doctorate as a cartographer.
![]()
Figure 20. Filling the questionnaire on the left, exhibition prototype on the right.
To summarize, seven participants completed a doctoral degree in geodesy, cartography, structural engineering, architecture and geology. Nine have completed a master’s degree in the occupation of geodesist, Architect, Cartographer, Graphic and Architect. While four have completed a bachelor’s degree and by profession are geodesists and structural (see Figure 21).
Question 1.6 asked the participants if they knew any cultural monuments at Mother Theresa and Zahir Pajaziti Boulevard in Pristina. Fourteen (14) out of twenty (20) participants stated that they had previous knowledge of the cultural monuments while six (6) out of twenty (20) were without prior knowledge. Most of the participants without prior knowledge belonged to the youngest age group from 20 - 30. This was due to the fact that the younger participants do not live in the city of Pristina and do not have ample information about the cultural monuments (see Figure 22).
Participants with the profession of structuralist, geologist, graphic artist, surveyor and some architects had not worked with 2D, 3D, 4D, or with virtual-, mixed-, and augmented reality before. Participants belonging to the architecture profession replied that they did not work with methods of the latest technology due to their age and qualifications (see Figure 23).
Question 1.7 asked the participants how informed they felt about the main monuments on Mother Teresa and Zahir Pajaziti Boulevard in Pristina. Three (3) of the twenty (20) who participated in the study were very informed, nine (9) were informed, five (5) were less informed and three (3) neutral. The participants who felt very informed were citizens of the City of Pristina and therefore had ample knowledge of the changes that took place. The age group from 31-50 felt informed (see Figure 24).
As mentioned above, all the participants were professors or assistants working at the University of Pristina, but with different occupations such as Cartographer, Geodesist, Structural, Architect, Geologist and Graphic. Those who had an occupation as Cartographer and Geodesist, twelve (12) were familiar with visualizing
![]()
Figure 21. Age group division with highest completed degree parameter.
![]()
Figure 22. User’s prior knowledge for cultural monuments.
![]()
Figure 24. User’s prior knowledge for cultural monuments in boulevards.
landscape changes with the help of a map while users with occupation as Structural, Architect, Geologist and Graphic (8) had no prior knowledge in visualizing landscape changes with the help of a map (see Figure 25).
The participants who had an occupation as Cartographer and Geodesist (12) represent the landscape changes with the help of a map. Most of the participants practiced working with 2D and 3D visualizations (see Figure 26). One participant with a profession in geodesy and in the age group of 20 - 30 gave the following comment:
“Technology has advanced a lot in recent years. With these methods, we have many opportunities for use and development.”
Analysis of Interviews Responses
Following the questionnaire, an interview with each participant was conducted. The interview was used to get insights into the user’s perceptions. Users were asked to give feedback on their impression of the model itself and its features.
Almost all users, nineteen (19) rated the impression of the model itself and its features as “excellent” while one (1) user rated it as “good”.
The following comment has been given by one participant in the interview:
“It is very interesting and very accurate. The reason for the reply “good” is since I am an architect by profession and I have traveled a lot outside Kosovo, I am aware of 3D models that represent the change of a place or a storytelling with a time-series for a certain event. The advantage of the models I have seen is that they have used a larger space and have displayed more objects, more animation.”
Overall, most participants had comments to share about the model itself. They found the combination of a 3D model with the projection very interesting and informative. According to these users, four (4) of them preferred a different scale of the model and seeing more buildings.
A user said: “I was happy when I saw all the animations. I was born and raised in Pristina, every piece of information was accurate and reminded me of the
![]()
Figure 25. User’s experience knowledge about landscape change visualization.
![]()
Figure 26. User’s responses on question: which kind of maps have you worked to represent landscape changes.
past. The model looks quite interesting and very informative. Regarding the scale, I must emphasize I would prefer different scale in order to have 30% more objects.”
Most of the users, fourteen (14), gave feedback regarding the impression of the prototype. Most of the users liked the preparation of the 3D buildings, the narration and visualization of the changes with the help of a timeline, the combination of the orthophoto and the audio, and the combination and synchronization of the text part with the visual effects and animation. During the interviews, the users mentioned that the incorporation of the light source coming from the projector was exciting. The participants stated that the model looked accurate, informative and attractive to them.
Most users, sixteen (16), “strongly agree” with the meaning of the information presented in the prototype. Three (3) were “neutral” in understanding information about the City of Pristina. Participants with “neutral” answer would like to see more information about the city in general, not just about the chosen location. A user does not agree with the presentation of road information as the road information was only displayed for the selected location (see Figure 27).
Most of the users, sixteen (16), think that each element of the animation/projection helps understand the landscape change (see Figure 28). Three (3) were “neutral”, one thought it didn’t help understand the change. Seventeen (17) users responded that the audio element helped “very much” understand the landscape changes while two (2) were “neutral”. Ten (10) users concluded that the cadastral map “very much” recognizes the landscape changes of Pristina, at the same time six (6) users thought it “neutral” and one (1) “not at all”. All the users, twenty (20) agreed that the orthophoto is a huge help in understanding the changes that occurred in Pristina.
![]()
Figure 27. Information presented in prototype.
![]()
Figure 28. Responses regarding the understanding of the animation.
(17) out of (20) users stated that they would create a similar prototype and the possible change of landscape would be street B in the city of Pristina, the city of Prizren and the area of Camp Bondsteel in Ferizaj.
Overall, most of the readers could not pick one element. They found it hard to decide on either the audio and the text information of the story or the orthophoto and 3D buildings but rather went for both elements. According to these users, ten (10) of them, selected audio and twelve (12) textual information. Fourteen (14) of the users were “neutral” about the selection of the 3D buildings also thirteen (13) were “neutral” about choosing more orthophotos (see Figure 29).
“Prizren falls in the middle in the first place, but any city would be a good decision. Any area of the center and outside the center would be of interest, it would be good to place in museums and schools. I would select Prizren since I was born and raised and I very much hope to see a prototype with a different theme or the same, would be of great interest to me, but every city would be pleased to have such a prototype.”
The questions 2.9 and 2.10 (Figure 30) refer to the memory of the users, the process that are taking place to acquire, store, retain, and later retrieve information. The correct answers to the questions asked are Museum of Kosovo, Carshia Mosque and Clock Tower, but most users had the correct answer for only two of the objects. Eighteen (18) users marked the Museum of Kosovo and sixteen (16) marked the Mosque of Carshia. A very small number of users, two (2) gave the correct answer for the third object displayed in 1893.
Of most users, eleven (11) rated the difficulty level of reading the textual information as “easy”. For five (5) of the users the level was “moderate” while for the other users four (4) it was “difficult”. All these four users were in the group age 51 - 60. Their feedback was that they would prefer the time during the display of information to be longer as they could not concentrate on all details. It can therefore
![]()
Figure 29. User’s suggestion for similar prototype.
![]()
Figure 30. Memorization during the animation.
be argued that users in the age between 51 - 60 need longer to absorb, process, and remember new information (see Figure 31).
Seventeen (17) users consider the combination of textual information with audio as “very useful”. While three (3) users consider the combination of textual and audio information “useful”. As mentioned earlier in Figure 28 users in the 51 - 60 age group (3 of 4) here suggested (see Figure 32).
“If I had more time to focus on textual data and audio, I think I could understand better.”
As shown in Figure 33, most users, fifteen (15) consider the combination of textual information with the cadastral plan as “useful”. While five (5) of the others thought “moderately useful” and “slightly”, “useful”. There were some feedbacks from users who thought it was “less useful”. Their feedback was that if there were more cadastral maps followed over the years then the difference would be greater and the combination with textual information would be more appropriate.
Combining textual information with orthophotos was beneficial for all users (see Figure 34). Although it has been noticed that orthophotos change over the
![]()
Figure 32. Combination of audio with textual information.
![]()
Figure 33. Combination of textual information with cadastral maps.
![]()
Figure 34. Combination of textual information with orthophoto.
years in terms of resolution and the perspective of photography. In Kosovo, the realization of the orthophoto is not done every year because it has a high cost, but during the past years there were not many changes in many parts of the country.
5. Conclusion and Outlook
Pristina the case study, is an exceptional and favorable example of this kind of landscape change depiction. Pristina is a city that has undergone many transformations in its appearance during its existence period from the year 1893 till nowadays 2021.
The methods and techniques used apply to the city of Pristina and are a recommendation for similar cities that have overcome a similar landscape change, but not for cities or areas that have a different type of landscape change. A concrete example would be the presentation of the change of landscape in mountainous areas, then it is completely opposite from the case study in Pristina as there is a lack of buildings in mountain areas.
As stated in Chapter 1, this thesis aims to investigate how textual descriptions of landscape changes can be transferred and communicate in a 3D environment using the storytelling approach. This overall objective can be divided into two sub-objectives:
1) Visualization of textual descriptions using the storytelling method.
2) Evaluation of the effectiveness of the visualization (3D model and projection).
Two research objectives, each containing three sub-questions, were formulated in Chapter 1. In order to achieve these objectives all of research questions were answered in detail in their respective chapters, and are now discussed one by one. Afterwards, possible improvements of the methodology are described in outlook chapter.
5.1. Visualization of Textual Descriptions Communicated in a 3D Model
Through the visualization of textual description, storytelling aims to represent landscape change in action through time and to draw attention to the participant. Landscape changes in books are discovered year after year describing specific information about altered landscape changes describing the characteristics of landscape changes based on single objects.
Multimedia is the key element of interactive storytelling that can be used to represent and transfer textual descriptions in a spatial model. Time series, maps, texts, audio, and photos can be combined in an animated story and projected on top of a 3D model. Individual elements can appear at a certain time in the animation. The text is one element in the narrative approach and mainly supports the visualization by providing additional information on the most important landscape changes with the categorization of features. The text provides the narration of the stories, but through exposure, it can also give imagination; and may represent action over time.
To create a 3D model, data sets are needed, to visualize landscape changes the animation is needed, while to make the scenario structure, we need 10 selected objects. The scenario structure contains 4 main phases. The 3D model sequence with the time series element perfectly conveys the aspect of explaining landscape changes.
5.2. Evaluation of the Visualization
To test the effectiveness of the visualizations, research objective two was elaborated upon. The required elements for the answer to the research question (II-a) are text, audio, cadastral maps, and orthophotos, archival images.
According to the user test, a majority of users found the combination of textual descriptions an attractive solution for describing the landscape changes. Some of the users considered the combination as a result achieved by the great development of multimedia technology. All of the elements have the same weight to tell the changes in the City of Pristina. On one hand, users’ response to a combination of cadastral plans with textual descriptions differs from the other combination elements. The time series elements helped users see the visualization of changes through the time approach in storytelling. With this element, the emphasis is made on the main point or idea thus continuing through each specific year by giving new information for landscape changes.
The user test, as described in Chapter 4, showed that there are many factors that change each other’s participants’ responses. During the evaluation, the influencing factors were: occupation, age group and living area. From these factors, it can be concluded that work experience and older age groups have more work experience in visualizing landscape changes. The use of cadastral maps and orthophotos to show the landscape change was considered beneficial. The user impression of the 3D model was inspiring. Participants commented that the combination of the wooden plate with translucent colored buildings was appropriate as the presence of elements such as orthophotos and cadastral maps could be easily identified and analyzed. Also, during the interviews, participants who had not seen such a model were surprised and excited when they saw that the light source coming from the projector on top of a wooden plate. Overall, users stated that the model looked accurate, attractive, and the combination of materials was pleasing.
Acknowledgements
First, I would like to express my deep and sincere gratitude to my research supervisor, M.Sc. Juliane Cron, for giving me the opportunity and providing invaluable guidance throughout this research. Her vision, sincerity, and motivation have deeply inspired me. It was a privilege and honor to work under her guidance.
I am grateful for the opportunity to pursue this exceptional and wonderful study program given to me by the Cartography MSc program.
Secondly, my appreciation goes to my reviewer, DRS, Barend Köbben for his advice in the proposal defense and the midterm presentation. Also, I want to express my sincere gratitude to all the staff of Cartography M.Sc., especially coordinators at the four universities for their tremendous support.
I would like to express my sincere gratitude to all the professors and assistants at the University of Pristina for their participation in this research experiment and for their valuable comments and suggestions.
Finally, I am greatly indebted to my family especially to my parents Xhemajl and Shqipe for their unconditional love, caring, and sacrifices for educating and preparing me for my future. I deeply thank my brothers Getoar and Granit for their heart-warming kindness and support. I also thank my life partner Premtim for his love, motivation, and encouragement despite the long distance between us. And I dedicate this milestone to them.