The Factors Affecting the Adoption of e-PACRA Services through the Government Service Bus ()
1. Introduction
E-Government has been adapted in many countries the world over as the provision of services moves even more to electronic means on the internet. “E-Government in Zambia can be traced way back to 1993” (Chipeta, 2018) and can be “defined as the delivery of improved services to citizens, businesses and other members of society through drastically changing the way governments manage information” (Kumar et al., 2007). However, the internet is vast and can be likened to the wild west. It is therefore prudent that specific secure and controlled solutions through government internet portals have been set up for delivery of services to the public in general. One such solution is the Government Service Bus, which is a public sector administrative and payment solution on the e-Government platform. It has become overly vital to identify and quantify the usage of these online services to not only ascertain the return on investment but also provide a platform that will widen client access, ease of use, and deliberately enhance the synergy of government ministries, agencies, and semi-autonomous institutions for improved, efficient, transparent, and cost-effective delivery of services. PACRA’s annual report (PACRA, 2020), introduced four (4) of its services on the Government Service Bus (GSB). The Government Service Bus is a public administrative and payment online platform on which services are offered by government departments and statutory bodies and can be accessed by the general public (Smart Zambia Institute, 2020). This Government Service Bus platform was developed by Smart Zambia Institute in collaboration with the Ministry of Finance, with the primary agenda of providing an administratively effective online system with so many operational modules of service to the general public, with due emphasis on online payment capabilities in Zambia. However, the GSB has many modular functions which it hopes to incorporate through the Smart Zambia e-governance transformative agenda. Technically, the government service bus would provide a more robust, secure, and trustworthy platform to deliver electronic services.
According to (Office of the Vice President, 2019) ministerial statement on the progress of Smart Zambia, estimates of reduction in paper usage were evident, costs of broadband internet access were also significantly reduced, and the move to more electronic means further improved revenue collection and reduced audit queries, making government institutions more efficient in their operations and service delivery, enhancing accountability (The World Bank, 2020), and also positively impact the social and economic status of Zambia as a country. The system will also look to gain far and wide access as the network platform spreads all across the country.
This should translate into more customers gaining access, higher traffic culminating in higher revenue for institutions like PACRA. The objectives are therefore to investigate and identify factors that impede PACRA customers from using e-PACRA services through the GSB and to assess the challenges PACRA customers have in using e-PACRA services through the GSB. The GSB will increasingly improve the use and access of the e-PACRA services by the general public. These services will not only benefit customers but government interrelated institutions and provide transparency and reduce corruption and theft, thereby impacting government coffers in a positive way.
The transformation from manual and physical means to access and provide e-PACRA services has since evolved to electronic means through the e-government platform. It is on this Government Service Bus that e-PACRA users can transact using various payment platforms like Airtel, MTN, Zamtel, and even debit cards.
The research will bring to the fore the factors affecting the adoption of e-PACRA services through the GSB. This will set a basis for improvement of access, customer satisfaction and better delivery of services by PACRA. The study will therefore determine the reasons why customers will or will not use the e-PACRA services on the Government Service Bus (GSB) by using the Unified Theory of Acceptance and Use of Technologies (UTAUT) Model as a framework.
The Government Service Bus (GSB), where e-PACRA services occur, is an innovative solution that “aids smooth exchange of data among government entities” (TDRA, 2021), so as to provide services to the public. The UTAUT model adapted “explains about 70% of the variance in usage intention (Martins et al., 2014) and 50% of the variance in actual usage” (Daka & Phiri, 2019), which is significant compared to the eight original models. According to Cheng, “the UTAUT model is the most effective model for analyzing technology acceptance” (Chao, 2019). The study therefore brings attention to e-PACRA services to provide specific insight on matters of adoption of these services. The lack of technological know-how as well as educational gaps are among the challenges (Lishomwa & Phiri, 2020). “In fact, less than half of 700,000 people may be even aware of e-Government in Zambia” (Bwalya & Healy, 2010). It is estimated that e-government services as of 2020, “only 17.34% of individuals had access to the Internet or online services in Zambia, compared to the world average of 43.34%” (Sikaonga & Tembo, 2020).
The study therefore provides a unique position to assess the factors that affect the adoption of e-PACRA services through the Government Service Bus because of its evident low uptake of e-PACRA services on the e-government platform.
2. Key Literature Review
Table 1 gives a summary of the gaps in the literature review that was conducted in this research study.
![]()
Table 1. Literature review summary.
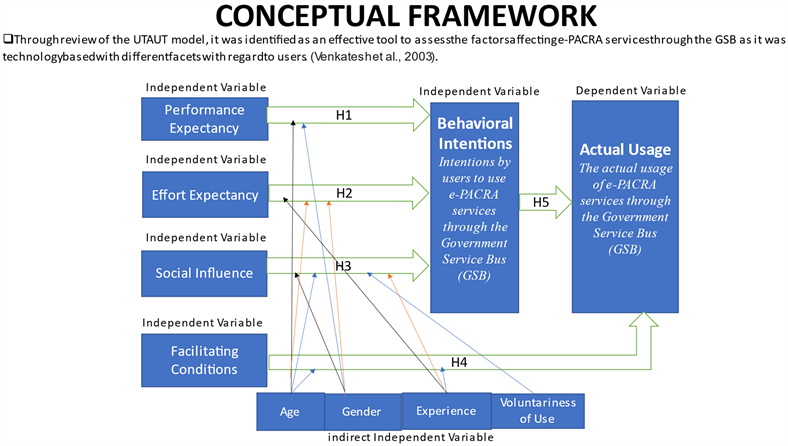
2.1. Conceptual Framework and Theoretical Framework
2.2. Theoretical Framework
According to Al-Qeisi (2018), technology acceptance research is a constantly developing field. The disciplines that contributed to its development are either belief-focused or system-focused. The unified theory of acceptance and use of technology (UTAUT) combined both. The current research model proposes an extension to the UTAUT that accounts for online usage behavior. The proposed research model was tested in two countries (UK and Jordan) to investigate the viability of the unified model of technology acceptance in different boundaries as a model of individuals’ discretionary usage of Internet banking. The study also questions the roles of other determinants and moderators in this context. Results found support for the effect of the proposed extension, website quality perceptions, on usage behavior in both countries’ models; the total effect of this extension exhibited website quality perceptions as the most influential determinant of usage behavior in both models, and the performance expectancy construct was second in effect.
According to Ajzen (1991), social influence had no impact on the usage behavior in both models, which is consistent with previous research that advocates a declining role of social influence under discretionary usage and increased experience conditions. Furthermore, the moderating role of performance expectancy previously established in TAM’s research was supported in the UTAUT model in both countries’ models. Moreover, both models reported a non-moderating effect of gender, which is also in line with recent research findings that suggest declining gender differences under voluntary usage conditions and advanced experience. Education and income were moderators only for the UK model. Although the research findings demonstrated that both countries’ models were “configurable” similar with respect to model specifications, the models’ explanatory power for usage behavior was dissimilar: the UK’s model explanatory power exceeded that of Jordan’s model, presenting an opportunity for future research. The current research contributes to knowledge in the field of technology acceptance research. It demonstrated that website quality perceptions, as a multidimensional concept, play an important role in the online usage context. It also demonstrated that the unified model of technology acceptance established in the western culture could be transferred to a non-western culture, although with varying degrees of explanation power (Ajzen, 1991).
2.3. Hypothesis Formulation
The UTAUT was therefore adapted for generating hypotheses used in this study. The main moderators or predictors were PE, EE, SI, FC and BI.
Source: Ajzen (1991).
Hypothesis Statements
H1 There is a positive relationship between performance expectancy adoption and the use of e-PACRA services through the government services bus (GSB) by users.
H2 There is a positive relationship between effort expectancy adoption and the use of e-PACRA services through the Government Service Bus (GSB) by users.
H3 There is a positive relationship between social influence adoption and the use of e-PACRA services through the Government Service Bus (GSB) by users.
H4 There is a positive relationship between facilitating conditions and the use of e-PACRA services through the Government Service Bus (GSB) by users.
H5 There is a positive relationship between behavioral intention and the use of e-PACRA services through the Government Service Bus (GSB) by users.
The hypotheses above were generated based on the UTAUT Model (Venkatesh et al., 2003), taking the PE, EE, SI, FC, and BI as independent variables and the adoption and actual use of e-PACRA services as the dependent variable.
3. Research Methodology
3.1. Introduction
This section presented the research methods such as the research design, sources of data, sample size, sampling methods as well as methods of data collection, reliability of data, validity of data and ethics that would be used in this study.
3.1.1. Research Design
The mixed method approach was used where both qualitative and quantitative data were obtained. The qualitative method helped to obtain in-depth information, while the quantitative helped generalize the results. The use of both qualitative and quantitative methods complemented each other in order to validate the methods that were used to realize the objectives of the research study.
3.1.2. Source of Data
Primary as well as secondary data sources were used. The primary data was collected from the entire research subject within the catchment area of the research task from which the sample size was selected from what was referred to as the target population. The target population would involve all PACRA clientele who use PACRA online services. Secondary data would also be obtained from relevant literature, including publications and reports on the effectiveness and efficiency of e-government services.
3.1.3. Sample Size
The Simple Random sampling technique was considered more representative of the total population as opposed to other sampling techniques because it wasn’t focused on inviting participants based on their position level in the organization. It was focused on maximizing the number of eligible respondents. It was broadly based with an emphasis on PACRA clientele registering businesses as a core function of the institution (PACRA) and accessing other related services. The main site and location for the study was the One Stop Shop in Lusaka’s CBD where questionnaires were distributed and collected.
The study adopted the Cochran’s sample formula to estimate the sample of e-PACRA respondents that were subjected to survey questionnaires.
According to Cochran (1977) and Sarmah et al. (2013), the aim of the calculation was to determine an adequate sample size which could estimate results for the whole population with good precision. In other words, one had to draw inferences or generalize about the population from the sample data. The inference to be drawn was related to some parameters of the population such as the mean, standard deviation or some other features like the proportion of an attribute occurring in the population. It was noted that a parameter was a descriptive measure of some characteristics of the population, whereas if the descriptive measure was computed from the observations in the sample, it would be called a statistic, is constant for a population, but the corresponding statistic would vary from sample to sample. Statistical inference generally adopts one of the two techniques, namely, the estimation of population parameters or testing of a hypothesis.
Initial Cochran’s formula:
Z = 1.96 at 95% confidence level and 5% Margin of error or Significance error (e) = 0.05, Probability of e-PACRA adoption & use assumed 50% which is 0.5
P = 0.5 and q = 0.5
= Initial Sample Size
The Cochrane’s initial formula:
Initial sample size
= 384.
According to PACRA, only 10,321 customers successfully registered businesses country wide in the year 2020. Zambia has 10 provinces and at 20% as online PACRA users, each province was therefore estimated to have N = 10,321/10 = 1032.1, being customer’s registered businesses. The target population represented by letter N was captured from the registered businesses divided by the 10 provinces, which roughly worked out to 1032.1 per province. At 20% as online PACRA customers, the target population N works out to approximately 206. By using the modified Cochran’s formula below:
where N = Target Population, with N = 206, Taking Z = Confidence level of 95% (1.96).
e = Significance error or Margin of error at 0.05, n = sample size, p = probability of e-PACRA adoption & use (0.5) & q = 0.5.
The modified Cochran’s formula for obtaining sample size is shown and calculated as below:
n which represents Sample Size is rounded off to 132.
n = 132
Therefore, a sample of 132 respondents was deemed ideal for this research study.
3.1.4. Methods of Data Collection
A survey questionnaire and interview guide were used to collect the data. The interview guide had both structured and semi-structured interviews because it would help keep the focus as the interviewer was the one that had control and for it to be completed. Preliminary interviews also provided accurate screening as the individual respondents being interviewed were unable to provide false information during the screening questions such as gender, age, race etc. Therefore, interviews were used to collect data from the key respondents from the One Stop Shop site and the PACRA main office as complementary information in Lusaka, capturing a wide array of respondents without bias in the market. The survey questionnaire had a mixture of open-ended, semi-closed, and closed-ended questions. Survey questionnaires were also targeted at groups of anyone’s choosing and managed in various ways, i.e., research assistants could pick on anyone provided they met the criteria as a respondent to fill in the hard copy survey questionnaire. Some general information was obtained from Smart Zambia Institute, PACRA offices, the general public and PACRA agents on the subject. The general information and assertions, however, were not inherently used in the research study as analysis and findings relied heavily on the survey questionnaire as the guide.
3.1.5. Data Analysis
Primary data was processed and analyzed using the Statistical Package for Social Scientists (SPSS Ver. 23). This package was used due to its impeccable propensity to quickly analyze large volumes of data gathered through various methods of research. Its ability to make difficult analytical tasks easier and to keep one from making mistakes or forgetting important details or items. A category is a set of criteria that are integrated around a theme (Creswell, 2012). The first step in content analysis would entail the construction of categories. Thus, after identifying the categories, data was coded. The coded data would offer some evidence about the dominant categories, attributes and trends. Some of the data were presented in narrative form. The results were analyzed using the Pearson’s Correlation to determine the relationship between the predictors/moderators and the adoption and use of the e-PACRA services through the Government Service Bus (GSB).
3.1.6. Reliability of Data
The reliability of the data was achieved through two methods, such as the use of the inter-rater method, whereby the results of the researcher were compared with the results of the research assistant that was employed. The other method was the use of the internal consistency method where the questions and the responses were logically related and tallied.
3.1.7. Validity of Data
The validity of data determined would be applied to the research instrument by using the content validity. The content validity ensured that the research instrument was representative of the full content of the phenomenon under investigation. In addition, the content validity ensured that all the aspects of the subjects under investigation were covered.
4. Ethical Considerations
The research study was purely and exclusively academic and any consequential outcome would be treated as such. Therefore, the contents and findings were not to be used in any way for any other purposes other than academics. Further, the maximum code of ethics was followed by getting consent from all the respondents. There was no coercion or influence to participate in the research study. All rights and confidentiality of all participants were strictly observed by ensuring anonymity in the interviews and only codes for the analysis of all information were used; no information could be traced back to any individual respondent.
5. Demographics and Results Discussion
5.1. Demographic Profile of Respondents
The demographic information includes the following characteristics of participants: gender, marital status, age group, highest level of education, and type of employment. The demographics information is represented in Table 2 below based on frequency distributions and percentages. From the 132 respondents in this study, 85 (64.4%) are male and 47 (35.6%) are females. The calculated mean
![]()
Table 2. Demographic profile of respondents.
age of the respondents was 22.59 years old, with the majority of the students being in the age group 31 - 40 years old (67.3%). In terms of the marital status, 76 (57.6%) were married while 39 (29.5%) were single. Most of the respondents were in the age category 41 - 50 years (35.6%), followed by the age group 31 - 40 years (34.1%), 21 - 30 years (18.9%), 51 - 60 years (7.6%), less 21 years (2.3%) and above 60 years (1.5%). Concerning the highest education attained, 58 (43.9%) reported having a first degree while 38 (28.0%) reported having a diploma. Of the 132, a total of 67 (50.8%) were salaried employees, 56 (42.4%) were self-employed, 8 (6.1%) were not working, while 1 (0.8%) was a pensioner (Figures 1-5).
![]()
Figure 2. Respondents by marital status.
![]()
Figure 3. Respondents by educational qualification.
![]()
Figure 5. Respondents by employment type.
5.1.1. Reliability and Factor Analysis
To assure internal validity, the questionnaire comprised 25 items adapted from prior similar studies on both the dependent and independent variables. The questionnaire comprised 2 items on the adoption and use of e-PACRA services through the Government Service Bus (GSB), which was the dependent variable in the study. The independent variables were:
1) Performance Expectancy had 4 items
2) Effort Expectancy had 4 items
3) Social Influence had 5 times
4) Facilitating Conditions had 5 items
5) Behavioural Intention had 5 items
Items of the independent variables that required the respondents to rate were on a five-point Likert scale ranging from 1 = “strongly disagree” to 5 = “strongly Agree”. The questionnaire was pilot tested before final distribution to ensure that the questions were concise and, where necessary, correctly rephrased.
Reliability analysis of all the variables included, representing all dimensions of factors affecting adoption and use of e-PACRA services through the Government Service Bus (GSB). All Cronbach’s Alpha coefficients were above 0.7. Based on a study done by Mahiah, S. et al. (2006), this suggested that the items used in instruments were quite reliable. Items showing coefficients less than 0.7 were excluded from the analysis.
Specifically, exploratory factor analysis with principal components extraction and varimax rotation was conducted. The assumptions for factorability of the data with coefficients above 0.3 were fulfilled since the Kaiser-Meyer-Olkin (KMO) measure of sampling adequacy was greater than the minimum value required of 0.60, and the Bartlett’s Test of Sphericity was significant (p-value < 0.05) for all the variables. Table 3 illustrates reliability and factor analysis.
5.1.2. Hypothesis Results, Analysis, Interpretation and Model Building
Hypothesis 1 = X1: There is a positive relationship between performance expectancy and the adoption and use of e-PACRA services through the Government Services Bus (GSB) by users.
The relationship between performance expectancy and adoption and use of e-PACRA services through the GSB by users was investigated using Pearson correlation coefficient. The results in Table 6 indicate a very weak and positive relationship between performance expectancy and adoption and use of e-PACRA services through the Government Services Bus (R Square = 0.06, n = 132, p > 0.05). This means that only 6 percent of the adoption and use of the e-PACRA services through the GSB is determined by performance expectancy but this cannot be taken literally because the relationship is not significant.
Hypothesis 2 = X2: There is a positive relationship between effort expectancy and the adoption and use of e-PACRA services through the Government Service Bus (GSB) by users.
The results in Table 4 indicate a weak and positive relationship between effort expectancy and adoption and use of e-PACRA services through the Government Services Bus (R Square = 0.187, n = 132, p < 0.05). This means that only 18.7 percent of the adoption and usage of e-PACRA services through the GSB is determined by effort expectancy since the relationship is significant.
Hypothesis 3 = X3: There is a positive relationship between Social Influence
![]()
Table 3. Reliability and factor analysis.
a. Predictors: X1 = Performance Expectancy, b. Predictors: X2 = Effort Expectancy, c. Predictors: X3 = Social Influence, d. Predictors: X4 = Facilitating Conditions, and e. Predictors: X5 = Behavioural Intention.
and the adoption and use of e-PACRA services through the Government Service Bus (GSB) by users.
The results in Table 4 indicate a weak and positive relationship between Social Influence and the adoption and use of e-PACRA services through the Government Services Bus (R Square = 0.21, n = 132, p > 0.05). The relationship between the two variables is not significant.
Hypothesis 4 = X4: There is a positive relationship between Facilitating Conditions and the use of e-PACRA services through the Government Service Bus (GSB) by users.
The results in Table 4 indicate strong and positive relationship between facilitating conditions and the adoption and use of e-PACRA services through the Government Services Bus (R Square = 0.378, n = 132, p < 0.05). This means that only 37.8 percent of the adoption and usage of e-PACRA services through the GSB is determined by facilitating conditions since the relationship is significant.
Hypothesis 5 = X5: There is a positive relationship between behavioural intention and the use of e-PACRA services through the Government Service Bus (GSB) by users.
The results in Table 4 indicate strong and positive relationship between behavioural intentions and the adoption and use of e-PACRA services through the government services bus (R Square = 0.466, n = 132, p < 0.05). This means that only 46.6 percent of the users of e-PACRA services through the GSB are determined by behavioural intentions since the relationship is significant.
5.1.3. Model Building
The hierarchical regression results in Table 5 and Table 6 below reveal the model development to address challenges or poor adoption and use of e-PACRA services through the GSB. The ANOVA table results show that all 4 of the 5 models are significant in explaining the adoption and use of e-PACRA services using GSB. The only invalid variable was performance expectancy while the rest were significant.
a. Dependent Variable: X1 = adoption & use of GSB, b. Independent variables: X1 = Performance Expectancy, X2 = Effort Expectancy, X3 = Social Influence, X4 = Facilitating Conditions, and X5 = Behavioural Intention.
![]()
Table 6. Hierarchical regression results.
Based on the regression results shown in Table 6, it can be seen that models 2, 4 and 5 each had at least 1 item showing significance (p < 0.05) with regards to explaining e-PACRA adoption and use through the GSB. Thus, the items that can be used to build a sound model based on the results of the study are:
X2: Effort Expectancy (I find the GSB platform easy to use)
X4: Facilitating Conditions
I have the knowledge necessary to use the GSB to access e-PACRA services
Help/guidance is available on using e-PACRA services on the GSB
X5: Behavioural Intention (I intend to use the GSB system in the next few months in order to improve my customer service experience at PACRA)
6. Discussion Linking the UTAUT Model to the Study Results
The main objective of this research study was to identify the factors from the UTAUT model that affect PACRA customers’ adoption and use of the e-PACRA services on the e-Government platform called the Government Service Bus. The results revealed that the UTAUT could explain PACRA customers’ behavior in relation to adoption and usage of the e-PACRA services and that all but one of the relationships posited in the UTAUT were supported (Abbad, 2021). Social influence strikingly did not influence adoption and use of the system, which is consistent with other findings in technology acceptance research results as “Not supported” (Jambulingam, 2013) and in e-government contexts (Abbad, 2021).
However, according to (Al-Adwan et al., 2018), “literature suggests that the impact of social influence will be significant in the initial phases of m-learning and will gradually decrease over time as m-learning becomes more widely used,” which was contrary to our findings in my study. This research result implies that social influence is not a significant predictor of the adoption and actual use of the system. The current digital generation was born into a digital environment where peer influence was less necessary (Jambulingam, 2013).
However, it was noted that accessing devices and or internet broadband was considered a challenge for most members of society in Zambia.
Performance Expectancy was also another predictor that was not an influence on the adoption and actual use of e-PACRA services on the GSB platform.
Due to these findings, it is essential that academicians, experts, administrators and designers of e-PACRA services on the GSB system to focus on promoting the efficiency and efficacy of a system that enhances PACRA customers’ main influencing constructs as shown in the hierarchical regression analysis results in Table 6.
Effort expectancy was the third most important determinant of adoption and use of the e-PACRA services. Similar results have been found by researchers using a different adoption model (e.g., TAM) in information technology contexts (Abbad, 2021). When building and/or modifying the e-PACRA services on the GSB, PACRA and SZI should therefore take this factor into consideration and make it as easy to use as possible (less effort) so that PACRA customers are motivated to adopt and use it. Facilitating conditions also significantly appeared to support PACRA customers’ 37.8% adoption and actual use of e-PACRA services on the GSB.
These findings are consistent with several previous studies in technology acceptance studies (Al-Adwan et al., 2018). PACRA customers will use e-PACRA services through the GSB when the necessary resources and technical support are perceived to be available or provided. PACRA and SZI should motivate PACRA customers to use the e-PACRA services on the e-Government Platform (GSB) through the provision of advertising, training, documents, and technical support where needed. Supportive and knowledgeable staff should be available at any time to help customers overcome any difficulties they may encounter.
The primary goal of this study was to use the UTAUT framework to assess the effectiveness and influence of the predictors on the (e-PACRA) services based on PACRA customers’ acceptance of technology. The results showed that effort expectancy, facilitating conditions, and behavioral intentions had a positive impact on influencing the adoption and use of the e-PACRA services. Performance expectancy and social influence did not have any meaningful effect on the adoption and actual use of the e-PACRA services on the GSB.
Finally, it is worth noting that behavioral intentions had the most direct and significant effect on customers’ adoption and actual use of the online system. The fact that behavioral intentions had a strong effect on usage shows that those customers with high levels of behavioral intentions had high levels of adoption and usage of the e-PACRA services through the GSB.
Alshehri et al. (2012) also discovered similar results regarding behavior intentions to use e-government services in acceptance of new technologies. In addition, performance expectancy was the least important determinant of customer behavior. This suggests that customers at 6% influence on the adoption and actual use of the system, performance expectancy didn’t help them much to complete their tasks.
A clearer understanding of the determinants of the adoption and actual use of e-PACRA services by customers will help decision makers at PACRA and SZI use the right technology and encourage customers to engage with the system by building and designing a technological environment that will help them enhance their interest in adopting and using the system. This is especially vital during such an unprecedented era of the COVID-19 pandemic, which has impelled institutions across the world to make use of E-Systems.
7. Conclusion
E-Governance has enabled governments all over the world to provide services that are as competitive, if not better, than those provided by corporate businesses in certain circumstances. Despite being non-profit instituions, governments have seen it fit to tap into innovative electronic solutions to provide user friendly services to their clientele. The adoption of such technology as the Government Service Bus has even further enhanced service delivery by allowing customers to access various services like form applications, payments online, and many more. All this is without human interaction and intervention. This can be seen from services like road tax, motor vehicle licensing, etc. from RTSA, Immigration, and the Zambia Police that provide various services that can be conducted online through the Government Service Bus platform. Day-to-day administrative operations have also been incorporated, and resource personnel have heightened their productivity and efficiency in doing their jobs using technology. PACRA, as a government agency that provides services to the general public and corporate world, has benefited from the e-governance initiative in Zambia. However, the generally low uptake of e-Government services hasn’t spared PACRA as an institution and therefore it became prudent to undertake a study to find out factors affecting the adoption and use of e-PACRA services through the GSB based on the UTAUT Model.
The research results using SPSS therefore revealed that performance expectancy, effort expectancy, and social influence had a positive weak correlation with the actual use of e-PACRA services. Facilitating conditions and behavioral intentions exhibited a strong positive relationship with the adoption and actual use of e-PACRA services. The study shows us that 4 out of 5 predictors significantly influence the adoption and use of e-PACRA services and can be used to improve the adoption rate. However, for future models, 3 out 5 were very significant to build a model with positive adoption results.
The reason behind this research study was primarily to investigate and identify the determinants of PACRA customers’ behavior in relation to the adoption and use of e-PACRA services on the e-Government platform (GSB), hence the topic “The Factors Affecting the Adoption of e-PACRA Services through the Government Service Bus (GSB).” The results of the research study suggest that PACRA customers’ adoption and actual use of e-PACRA services through the GSB is predicted and determined through direct or indirect relationship to actual use. Effort expectancy is indirectly linked, while facilitating conditions and behavioral intentions are directly linked to the actual use of the e-System. The results also indicate that both facilitating conditions and behavioral intentions had a significant effect on actual use of e-PACRA services. In the context of PACRA and SZI, this research affirms the utilization of the UTAUT framework/Model in predicting factors affecting the adoption and use of e-PACRA services by customers in developing countries like Zambia.
Given these results, PACRA and SZI should encourage PACRA customers to use e-PACRA services to enhance the low uptake of e-services on the e-Government platform (GSB). The successful implementation of the system depends on PACRA customers’ acceptance of the technology and how they embrace it. It is therefore necessary for management, administrators and developers of e-PACRA services through the GSB to design effortless and user-friendly applications to encourage and motivate PACRA online customer uptake on the platform. PACRA and SZI management should ensure that all the required resources are available for PACRA customers/clients, designers and technical support staff when needed. This will help PACRA and SZI to react immediately in the event of any changes to the system if required or in the case of an emergency such as COVID-19’s multifaceted effects on human life and the world over.
Limitations
The study was limited to the capital city of Zambia, Lusaka. As for academic research, restrictions due to resources and sites were a limitation. Zambia currently has 10 provinces, but only a section of Lusaka was considered in this study.
With the UTAUT having PE, SI, EE, FC, and BI as independent variables, potential determinants, namely, age, gender, experience, and voluntariness of use, could have a bearing on strengthening the prediction of PACRA customers’ behavior but were not taken into consideration. This effectively narrowed the scope of the study and is a limitation in and of itself.
Recommendations
● PACRA should increase awareness of the use of e-PACRA services through front line officers and increased advertising.
● PACRA should consider the use of GSB as a platform for customers to easily access the services even with low-speed internet connections to increase the user base.
● PACRA should also critically consider the three identified model building predictors from the UTAUT framework to help improve service delivery, adoption and use of e-PACRA services through the GSB.
● PACRA could also gradually increase mandatory access to e-PACRA services, compelling clients to use the system. This might seem unorthodox or too drastic, but due to human nature and with change being philosophically abhorrent to human nature or not easily acceptable, a theory of utilitarianism might bring about transformative change to the way PACRA customers do business. As evidenced by a memo at PACRA head office, a list of services to be accessed on the e-PACRA platform has been pasted on the notice board.
● It is also recommended that further study should be done on factors affecting the e-PACRA services through the GSB in all provinces of Zambia with the view to increasing knowledge and cementing findings of this subject/study going forward.
● A study could further be undertaken, widening the scope of moderators to include age, gender, experience, and voluntariness of use as variables.
● Although this study discussed the role of the UTAUT model in the conceptual framework development, the moderators in the UTAUT model are not all included. Therefore, future studies could consider these indirect moderators as variables that might influence the adoption and use of e-PACRA services on the e-government platform in Zambia.
Acknowledgements
I acknowledge the valuable assistance and support of all my associates who participated in this research and who have indeed encouraged me till this day. Special gratitude goes to my mother, my supervisor, and my family. Many thanks also go to the Graduate School of Business and its entire staff (the year 2021).