1. Introduction
Drought is a complicated incidence, which is difficult to define and affects all regions of the world [1] . However, drought is essentially a climatic phenomenon, as a consequence of an abnormal decrease of precipitation and untimely rainfall on a particular location. When strike over a particular forest, drought become the most significant climatic threat affecting the productivity of tropical forest ecosystems more profoundly than any other climatic natural disasters [2] .
A drought is an extended period when a region experiences a deficiency in its water. Generally, this occurs when a region receives consistently below average precipitation for a given period. Drought can have a substantial impact on the forest ecosystem and agriculture when hits a given region. Although droughts can persist for several years, even a short, intense drought can cause significant damage. It is not possible to avoid drought but drought preparedness can be developed and drought impacts can be managed. The success of both depends, amongst others, on how well the droughts are defined and drought characteristics are quantified [3] . Yet carrying out drought analysis would enable us predict drought occurrence and plan appropriately on ways of mitigation.
Over the past two decades there has been extensive tree mortality on every vegetated continent and in most bioregions in the world triggered by drought conditions [4] . Droughts affect the function of forest ecosystems and ultimately lead to poor supply of goods and services. On the other hand, drought reduces the resilience capacity of the natural ecosystems to stabilize itself after disturbances. Impacts of drought on forest ecosystems are much influenced by drought patterns i.e., frequency, duration and intensity [5] . Global climate change has been acknowledged by scientists as the major cause of severe droughts around the world [6] [7] .
Literatures show that droughts pose considerable impacts on forest ecosystems especially in the tropical forests regions [8] . The increased drought intensity and alternating high and low precipitation patterns disrupt ecosystem stability, thus causing large carbon emissions [9] . It has been reported that East Africa is, on average, drought free for only 21 out of 100 years [10] . Extreme rainfall anomalies are common in East Africa, and some of these are localized, while others cover a larger area and persist for several seasons or years [11] . In Tanzania droughts have already caused severe effects to different sectors [12] . Although the coastal forests of Tanzania have been subjected to wide fluctuations of droughts conditions [13] , no attempt has been made to quantify the impacts of droughts on the coastal forest ecosystems. Given the existence of droughts in Tanzania and importance of coastal forests ecosystems goods and services, our understanding of drought and its effects on forest ecosystems is very important.
As a step toward attaining that understanding, this study focused on identifying drought events and their patterns (i.e., duration, severity and intensity) particularly during the growing seasons along the coastal zone of Tanzania in order to facilitate identification of droughts impacts on coastal forest ecosystems. The study aims were achieved by analyzing the long term droughts along the coastal zone of Tanzania specifically within growing seasons, which is an important step to monitor the response of forest ecosystem to droughts. The growing seasons of the study area are March, April and May (MAM) which is referred as long growing seasons and October, November and December (OND) which is called short growing seasons.
2. Materials and Methods
2.1. Study Sites
This study was conducted in coastal forest zone comprising Pugu-Kazimzumbwi at Kisarawe, in the coastal mainland of Tanzania, Ngezi Nature Reserve and Jozani National Park which are located in Pemba and Unguja islands of Zanzibar respectively (Figure 1). The study areas are characterized by the bimodal rainfall regimes with the long rain season (Masika) experienced between March and May (MAM) and the short rain season (Vuli) occurring between October and December (OND).
2.2. Methods
Meteorological drought patterns were established by using Standardized Precipitation Index (SPI). The SPI is accepted by the World Meteorological Organization as the reference drought index for more effective drought monitoring [14] and most suitable drought index for monitoring droughts in East Africa [9] . Using the precipitation data, the SPI has anability to determine duration, magnitude and intensity of droughts [15] [16] . Monthly precipitation data were obtained from TMA for 4 weather stations in Pemba, Kisarawe, Julius Nyerere Interna tional Aiport (JNIA) and Jozani. Average rainfall data with at least 30 years per study area was calculated according to Guttman [17] and WMO [18] .
The SPI computation was done by fitting historical precipitation data to a Gamma probability distribution function for a specific time period and location. The Gamma distribution was transformed to a normal distribution with a mean of zero and standard deviation of one [19] . The alpha (α) and beta (β) parameters of the gamma probability density function were estimated for each station along the coastal zone of Tanzania using the maximum likelihood solutions (Equations (1) & (2)) as per Thom [20] and Edwards [21] .
 (1)
(1)
 (2)
(2)
where
 (3)
(3)
and n is the number of precipitation observations The resulting parameters were then used to find the cumulative probability starting with a gamma probability density function of an observed precipitation event for the given month and time scale for the station in question. According to Edwards and McKee [22] , a gamma probability density function to a given frequency distribution of precipitation totals for the station of interest is fitted as:
 (4)
(4)
Letting
 (5)
(5)
This equation becomes the incomplete gamma function:
 (6)
(6)
Since the gamma function is undefined for x = 0 and a precipitation distribution may contain zeros, the cumulative probability becomes,
 (7)
(7)
where q is the probability of a zero. If m is the number of zeros in a precipitation time series, then q can be estimated by m/n according to Thom [20] .
Then the calculated cumulative probability  was then transformed to the standard normal distribution to yield SPI according to Abramowitz and Stegun [23] . This study used time scale of 3- and 12-month SPI as recommended by WMO as best time scale to monitor drought on forest ecosystems [18] . The drought conditions corresponding to the SPI values were classified according to the McKee [24] .
Drought patterns were calculated as follows:1) The drought duration
 (8)
(8)
where Di, is defined as the number of months for which the SPI values is below zero.
2) The drought severity or Magnitude is the cumulative sum of SPI for that particular drought event which is:
 (9)
(9)
where j starts with the first month of a drought and continues to increase until the end of the drought (x) for any of the i time scales.
3) Drought Intensity is value obtained by dividing the Severity over Duration i.e.,
 (10)
(10)
where I is Drought Intensity, S is the severity or Magnitude and D is stand for Duration
3. Results
Comparing drought and non-drought events, the results show that Zanzibar Islands exhibited higher drought events over the wet events than in Tanzania mainland (JNIA and Kisarawe). As shown in Figure 2, Unguja and Pemba experienced 52% of drought events compared to 48% of non-drought events. Despite that Tanzania mainland revealed low frequency of occurrence of drought events per observation periods, it displayed higher frequency of occurrence of extreme drought events over the whole study area. For example Kisarawe exhibited 13% of extreme events which was higher than any other location in the study area.
Results reveal that extreme drought years along the coastal zone of Tanzania were 1965, 1975, 1976, 1996, 2003, 2004, 2006, 2009 and 2010 while the severe drought episodes were 1956, 1961, 1970, 1975, 1976, 1980, 1984, 1987, 1990, 1991, 2000, 2003, 2004, 2006, 2009, 2010, and 2011 (Table 1 and Table 2). Drought incidences were found to strike more during the short rainy seasons of October to November than in long rainy seasons of March to May. Again, results shows that Pemba region is less affected by extreme droughts during the past ten years compared to Unguja and Pugu-Kazimzumbwi areas. The trend line shows that there is an increase of drought incidences in all study areas along the coastal zones overtime (Figure 3).
Comparing drought incidences among these study sites, results show that Unguja Islands and Kisarawe areas were affected by extreme droughts within this decade from 2001 and 2011 more than any other time within the observation period (Figure 3 and Figure 4). Results of the 3-month SPI indicates that extreme drought stroke Unguja areas during the 1997, 2001, 2003 and 2011 events. The 12-month time scale SPI indicated that the extreme drought events were 2003, 2004 and 2009. In Kisarawe, results show that the severe drought years exhibited similar trend to extreme drought events. Results show that in the 3-month SPI, severe drought affected

Figure 2. Percentage of frequency of occurrence of drought years for coastal zone of Tanzania—3 SPI Scale.

Table 1. Drought years within Growing Seasons for the Coastal zones—3-Month SPI.
Kisarawe areas in 1980, 1986, 1987, 1997 and throughout from 2001 to 2011 with exception of 2005 and 2008. Results indicate that both extreme and severe drought events affected both long and short growing seasons around Kisarawe areas.
In Pemba, the frequencies of extreme and severe droughts were detected more in the 1990s events than any other time period plus 2003 and 2004 events. On the other hand, Pemba experienced severe droughts in the 1976, 1987, 1990, 1991 events and consecutive years of drought from 1994, 1995, 1996 and 1997 events (Figure 3 and Figure 4). For 12-month SPI the severe drought events were 1975, 1991, 2003 and 2004. According to 3 month SPI, drought events were detected well during both long and short growing seasons with exception of severe drought event in MAM. The 12-month SPI shows that there were no extreme drought events during both long and short growing seasons (Table 1 and Table 2). Extreme droughts episodes during growing seasons around JNIA reoccurred at minimum of every 2 and maximum of 8 years. Results show that extreme drought years in JNIA were 1955, 1961, 1965, 1974, 1975, 1980, 1982, 1991, 1997, 2001, 2003, 2006 and 2009 (Figure 3 and Figure 4).
Table 2. Drought years within Growing Seasons for the Coastal zones—12-Month SPI.
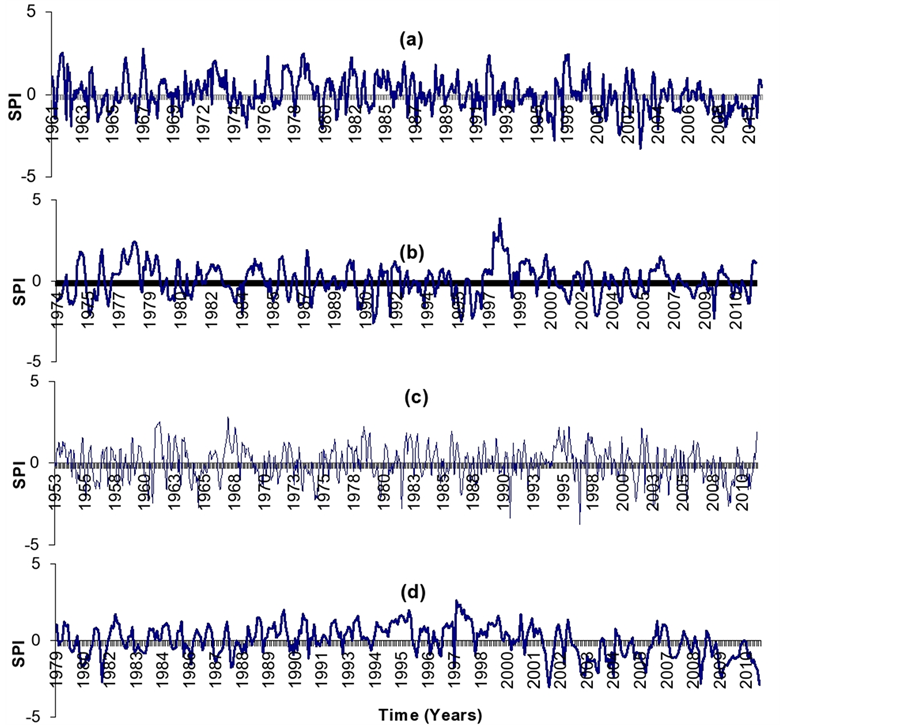
Figure 3. 3-Month SPI for (a) Unguja; (b) Pemba; (c) JNIA and (d) Kisarawe coastal zone of Tanzania.

Figure 4. 12-Month SPI for (a) Unguja; (b) Pemba; (c) JNIA and (d) Kisarawe coastal zone of Tanzania.
Comparing drought incidences among these study sites, results show that Unguja Islands and Kisarawe areas were affected by extreme droughts within this decade from 2001 and 2011 more than any other time within the observation period (Figure 3 and Figure 4). Results of the 3-month SPI indicate that the extreme drought stroke Unguja areas during the 1997, 2001, 2003 and 2011 events. The 12-month time scale SPI indicates that the extreme drought events were 2003, 2004 and 2009. In Kisarawe, results show that the severe drought years exhibit the same trend as in extreme drought events. Results show that in the 3-month SPI, severe drought affected Kisarawe areas in 1980, 1986, 1987, 1997 and throughout from 2001 to 2011 with exception of 2005 and 2008. Results indicate that both extreme and severe drought events occurred both during long and short growing seasons around Kisarawe areas (Table 1 and Table 2).
In Pemba, the frequencies of extreme and severe droughts were detected more in the 1990s events than any other time period except for 2003 and 2004 events. On the other hand, Pemba experienced severe droughts in the 1976, 1987, 1990, 1991 events and consecutive years of drought from 1994, 1995, 1996 and 1997 events (Figure 3 and Figure 4). For 12-month SPI the severe drought events were 1975, 1991, 2003 and 2004. According to 3-month SPI, drought events were detected well during both long and short growing seasons with exception of severe drought event in MAM. The 12-month SPI shows that there were no extreme drought events during both long and short growing seasons (Table 1 and Table 2). Extreme droughts episodes during growing seasons around JNIA re-occur at minimum of every 2 to maximum of 8 years. Results show that extreme drought years in JNIA were 1955, 1961, 1965, 1974, 1975, 1980, 1982, 1991, 1997, 2001, 2003, 2006 and 2009 (Figure 3 and Figure 4).
The coastal zone of Tanzania exhibited higher drought duration from 2000 to date than previous time. Based on 3-month SPI, the 2008/2011 was the strongest drought event at Unguja with 40 months period which was also the highest duration over the whole study areas (Figure 5 and Figure 6). The 2008/2011 drought was followed in magnitude with 2003, 1974/75, 1964 and 1999/2000 events with magnitudes of 13, 12, 10 and 10 months respectively. Comparing with 12 SPI scale, the 2008/2011 remained the strongest drought with 44 months period.
Pemba has experienced higher drought during the 1983/84 event which lasted for about 16 months period followed by 2007/08 and 2001 with 14 and 11 months period respectively (Figure 4). Based on 3 month SPI, results show that drought events distribution reveals no larger discrepancy for the rest of drought events, i.e., ranging from 2 - 8 months time (Figure 5 and Figure 6). However, when using the 12 SPI scale results show large discrepancies among drought episodes. The 2003/06 and 2007/2010 were strongest drought events which lasted for 38 and 30 months time respectively.
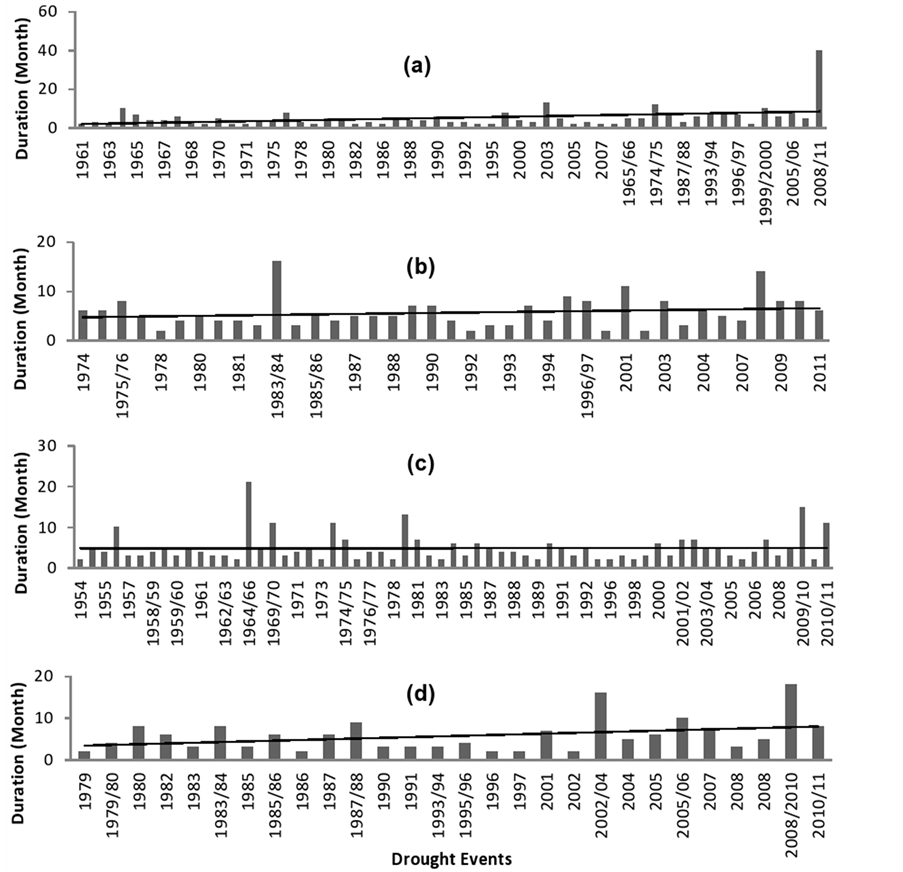
Figure 5. Drought Duration (3-month SPI) for (a) Unguja; (b) Pemba; (c) JNIA and (d) Kisarawe zones of Tanzania.
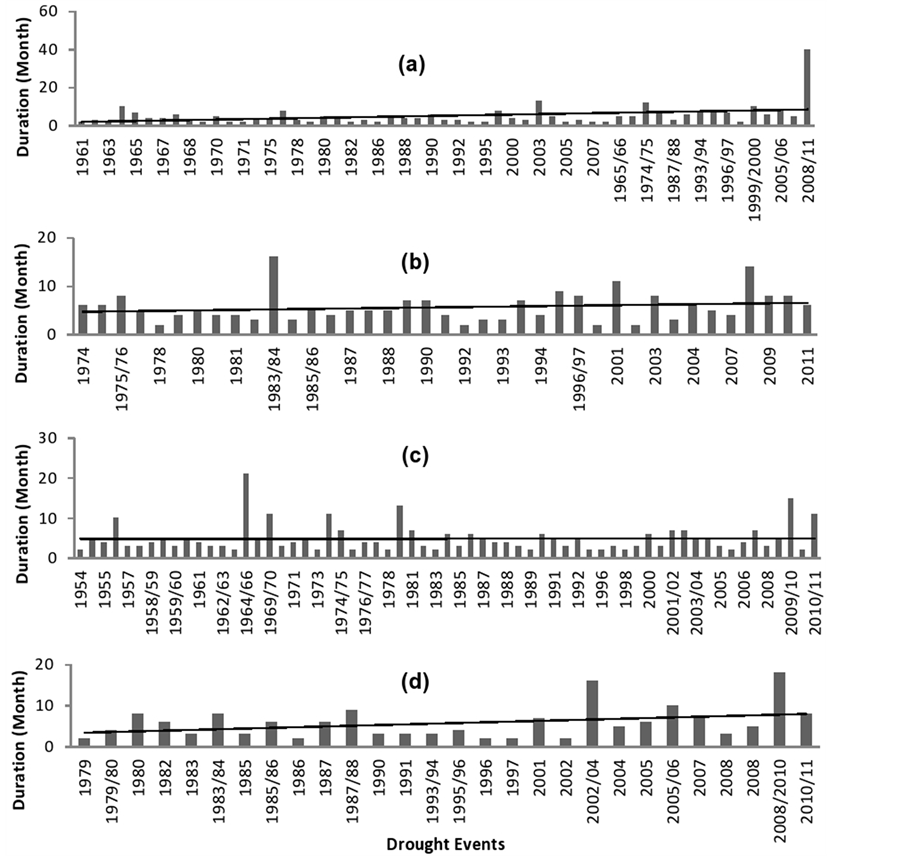
Figure 6. Drought duration (12-month SPI) for (a) Unguja; (b) Pemba; (c) JNIA and (d) Kisarawe zones of Tanzania.
The 2000 to 2011 periods have experienced strongest drought events in Kisarawe. Results for Kisarawe show that the 2008/2010, 2002/04 and 2005/06 events were leading by higher drought duration which lasted for 18, 16 and 10 months. The same trends were revealed by 12-month SPI in which 2007/2011 and 2003/06 showed higher drought duration of 47 and 46 months (Figure 5 and Figure 6).
Results in JNIA show that there is difference in distribution of drought events compared to Kisarawe because previous events (before 2000) are dominated by higher drought duration around JNIA areas. Based on 3-month SPI, the 1964/66 periods exhibited strongest drought duration in JNIA which lasted for about 21 months period (Figure 5 and Figure 6). However, the 12 SPI shows that 2007/2011 experienced higher drought duration with 49 months period followed by 1973/76, 1970/72, 1987/89 and 2003/04 with 29, 26, 25 and 21 months respectively Based on 3-month SPI the 2008/2011 year recorded the highest drought severity in Unguja with cumulative SPI of −36. The same year had the highest drought severity over whole study areas. It is followed by events of 2003, 1996/97, 2001/2002 and 1974/75 with cumulative SPI of −15, −11, −10 and −10 respectively (Figure 7 and Figure 8). The 12 SPI scale results follow similar trend to 3 SPI scale beyond the 2008/2011 event leading to drought severity with cumulative SPI of −63 for Unguja. This was the strongest severity over the whole study areas. It was followed by 2000/02 with cumulative SPI of −28 (Figure 7 and Figure 8).

Figure 7. Drought Severity (3-month SPI) for (a) Unguja; (b) Pemba; (c) JNIA and (d) Kisarawe zones of Tanzania.
In Pemba, the 1991 drought event had stronger severity with cummulative SPI of −2.59. The 1991 event was followed by 1987/88 and 1974 events with cummulative SPIs of −1.5 and −1.2 respectively (Figure 7 and Figure 8). Despite being the strongest drought severity, the 1991 year did not show any reflection of emergent event for drought duration. The drought event had less duration but with higher sum of SPI values (stronger drought severity). Based 12 SPI scale the 2003/06 drought event had higher severity in Pemba with cummulative SPI of −31. The event was followed by 1990/92 and 1980/82 with cummulative SPI of −22 and −20 respectively (Figure 7 and Figure 8).
The 2002/2011 and 2009/10 events revealed higher drought severity for Kisarawe and JNIA respectively. Results shows that the highest drought severity for JNIA was experienced within the period of 2009/10 which exhibit the cummulative SPI of −19. The event was then followed by the 1964/66, 1979/80, 1974/75 and 1950 events with cummulative SPI of −16, −10, −10 and −10 respectively (Figure 7 and Figure 8). In Kisarawe, the 2002 to 2011 were the drought years with higher drought severity as reflected by cumulative SPI of −20, −19, −11 and −10 respectively for 2002/04, 2008/10, 2010/11 and 2005/06 (Figure 7 and Figure 8).
Despite of higher drought duration and severity as indicated by the 2008/2011 event, the 2001/02 and 1996/97 events had higher drought intensity in Unguja Island with SPI of −1.7 each. Results show that the last decade

Figure 8. Drought Severity (12-month SPI) for (a) Unguja; (b) Pemba; (c) JNIA and (d) Kisarawe zones of Tanzania.
from 2000 to date was severely affected by droughts in Unguja because the decade was dominated by higher drought duration, severity and intensity (Figure 9 and Figure 10). As for drought severity in Pemba, the 1991 year also exhibited higher drought intensity. Results for Pemba show that the year 1991 had intensity of −0.64 SPI followed by 1992 and 1987/88 which had SPIs of −0.36 and −0.31 respectively. Based on 12 SPI scale, the 1974/75 displayed higher drought intensity in Pemba than other study sites with SPI value of −1.0 (Figure 9 and Figure 10).
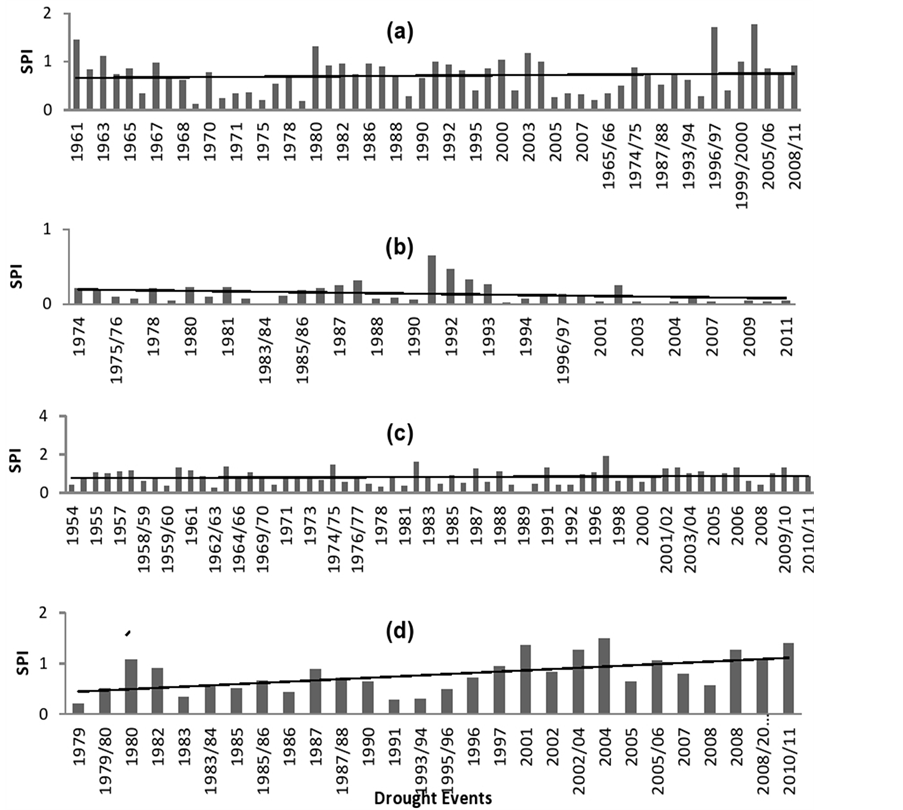
Figure 9. Drought Intensity (3-month SPI) for (a) Unguja; (b) Pemba; (c) JNIA and (d) Kisarawe zones of Tanzania.
Results of 3-month SPI drought intensity revealed that in Kisarawe the years after 2000 were extremely affected by drought intensity compared to the years before 2000. The year 2004 was highly affected by drought in Kisarawe as illustrated by higher drought intensity with −1.49 SPI. The 12 SPI scale showed similar trend in Kisarawe where years between 2000 and 2011 were dominated by higher drought intensity. The 2003/06 and 2007/11 events exhibited higher drought intensity with SPI of −1.2 and −1.0 respectively. The situation was different for JNIA because before 2000 was dominated by higher drought intensity. Based on 3 SPI scale, the year 1997 in JNIA was leading by higher drought intensity with SPI of −1.9. With SPI of −1.9, JNIA exhibited the highest drought intensity over the whole study areas while for 12 SPI scale, the years before 2000 had higher drought intensity.
4. Discussion
Drought incidences was found to strike more during the short rainy seasons of October to November than in long rainy seasons of March to May. Kijazi and Reason, [25] suggested that the northern Tanzania coast experienced below average rainfall during OND, and lesser extent in MAM. Based on 3 SPI scale more extreme drought were detected within 2001 to 2011 events in Unguja Island which strike both MAM and OND growing seasons and affect vegetation particularly forest trees along the coast of Tanzania. Renneberg and others [26] suggested that extreme droughts kill trees through cavitation of water column within the xylem. On the other

Figure 10. Drought Intensity (12-month SPI) for (a) Unguja; (b) Pemba; (c) JNIA and (d) Kisarawe zones of Tanzania.
hands, when using the 12 SPI scale the consecutive negative value of SPI from 2007 to 2011 events indicate that the forest ecosystems in Unguja Island have been affected by drought as per Ceglar and others [27] . Generally, the trend lines show increasing of drought duration, severity and intensity with time along the coastal forests of Tanzania. Thus more effects of droughts episodes on vegetation are expected to be observed in last decades within observation periods. Collectively more extreme droughts were detected before 2000 years in Pemba which included 1975, 1984, 1991, 1992, 1996, 2003 and 2004 events (3 SPI). However, when 3 SPI scale results are integrated the 12 SPI scale we found that the forest ecosystems in Pemba might be affected severely by the 2003/06 than any other time during the period of records as per Renneberg and others [26] and Ceglar [27] . Frederic and Volkmar [28] suggested that this kind of results might lead to changes of forest cover and biomass over time; hence the 2003/06 is a useful event to determine the response of coastal forest ecosystems to droughts in Pemba.
Based on both 3 and 12 SPI scales, results show that only the drought duration shows slightly increasing trend with time along the coastal forests of Tanzania. The severity and intensity show decreasing trends with time which suggest that more effects of droughts on vegetation are to be found before 2000. Therefore, for more comparison, the investigation of response of forest biomass and cover would be useful to be conducted for 2002/06 and 1990/92 events. JNIA exhibited repeated episodes of drought in such a way that the site experienced more than one episode per year, a situation which may cause decrease in leaf area index in the forest ecosystems [29] -[31] . However, drought duration decreased with time, and both severity (3 and 12 SPI) and intensity (3 SPI) showed increasing trends with time within the observation periods. Moreover, results suggest that the years after 2000 displayed higher extreme of droughts values which again underscore the importance of determining the response of forests to the detected droughts by 3 and 12 SPI scales. Areas in Kisarawe experienced low frequency but higher extreme drought episodes especially during the 2000 and 2011. These results are supported by drought duration severity and intensity trend lines which display increasing trends over time within observation periods. The results suggest that it will be useful to examine the response of drought on forest ecosystems during the 2000 to 2004 and from 2009 to 2011 in the areas. These kind results which reflect stronger droughts phenomena within the last decades are really expected in many areas of Tanzania as part of the sub-Saharan Africa countries. Using SPI in the Horn of Africa and sub-Saharan African, Viste and friends [32] identified severe drought episodes within 2000 to 2011 than the previous periods recorded between 1972 and 1999.
The strongest drought years along the coastal zone of Tanzania was identified as 2003 which reflected maximum drought intensity range from −2.5 to −3.3 (3 SPI scale) for long growing seasons (MAM) and 2001 short growing seasons (OND). The results in this study display similar trends to other studies in Tanzania. For example, Kijazi and Reason [33] , reported that, the period 1998-2005 stands out as one of the worst drought period in recent decades over Tanzania. They reported that the 2003 OND dry season was preceded by a MAM 2003 drought (standardized value of about –1.2) followed by the driest season in MAM 2004 (standardized anomaly value of –1.57) making the impact of the 2003/2004 drought particularly devastating. Based on 12 SPI scale, the 2009 events show the strongest drought especially during the October-December season.
5. Conclusion
Drought phenomenon is one of the important elements in the perspective of forest ecosystems and their management. Trying to understand drought is also considered as the important step in solving drought-related problems occurring in the perspective of forest ecosystems. Generally, Tanzania coastal zone was never completely without drought or anomalously wet conditions at any time scale during the period of record used in this study. However, it was never entirely in drought at any time scale during the period. Drought patterns in the study area clearly show that drought magnitudes are increasing with time. This trend can cause severe effects on important sectors especially when there are no plans to adapt to the drought conditions. On the other hand, the results in all study sites show increasing drought events overtime. These results suggest that the impact of droughts frequency, duration, intensity and severity is quite evident and becomes persistent in the coastal zone of Tanzania. Since the results have been analyzed using 3 and 12 time scale SPI series, it is also likely that agriculture, forest ecosystems and water resources have been affected by the drought patterns and their characteristics. Therefore, the examination of the response of forest ecosystems to droughts in coastal zone of Tanzania would be useful to be carried out within the last decade from 2000 to 2011 in addition to 1990/92 events for Pemba.
Acknowledgements
Authors would like to give sincere thanks to the Climate Change, Impacts, Adaptation and Mitigation (CCIAM), a Norwegian Embassy funded research programme in Tanzania for the financial support. We are also grateful to Ardhi University, University of Life sciences of Norway (UMB) and the University of Oslo for technical inputs. We are indebted too to Tanzania Meteorology Authority (TMA) for providing us with the rainfall data. We also appreciate those who took interest in this paper and provided useful comments when it was first presented during the CCIAM writer’s workshop on January 2013.