An Intriguing Correlation between the Distribution of Star Multiples and Human Adults in Household ()
1. Introduction
Astronomy is the observational study of stars. Sociology is the scientific or systematic study of human societies. Evidently, there should not be any relation be tween the two fields. Yet, it is known that many stellar systems are coupled in binary stars [1] similar to people. Recent observational data of several thousand brightest nearby stars [2] and the following expert research analysis [3] supplied a unique opportunity for a comparison between the distributions of stellar and human multiples.
2. The Distribution of Stellar Multiples
The multiplicities of stars were collected for a set of 4559 bright stars with Hipparcos [2]. The observed sample contained multiplicities up to 7. Taking into account the observational biases, it was concluded that the actual distribution of stars in 1, 2 ··· 7 multiples is respectively 1459, 2179, 517, 202, 101, 44, and 48 [3], which respectively are 32.1%, 47.9%, 11.4%, 4.4%, 2.2%, 1% and 1% of the total sample. Note that there were only 4550 stars in the simulated data. Table 1 lists these values and the mean number of stellar multiples, which is 2.04, as well as data up to multiplicity of 5 for American adults, which are described below.
3. The Distribution of American Adults in Household
The stellar multiplicity values were compared with human data—number of adults in household. The reasons for including only adults were discussed in preliminary papers [4,5]. It was argued that the distribution of stellar multiples should be matched with adults, and should not include children and old people. According to the perception of these papers, the total population—adults, children and elderly—should be compared with stars, planets and old stars such as white dwarfs and neutron stars. The distribution of multiplicity of this stellar population is, however, not known yet.
Data on Earth’s total population are not available, so single countries were examined. The distribution of multiple stars was initially compared with the 2009 data of USA adult population [6]. For family households the numbers of 1, 2 ··· 5+ members in the age interval of 18 - 65 years old in 1000 units are 14,900, 43,479, 9190, 2878 and 739. For non-family households the data (up to multiples of 7) are unfortunately given for all ages: 31,657, 5363, 821, 338, 99, 30 and 23 thousands. Therefore, we normalized these data by the ratio of adults (18 - 65 years old) to all population in non-family household, which is 26,712/38,331 ≈ 0.7, and estimated 22,061, 3737, 572, 236 and 106 thousands of 1, 2 ··· 5+ adults in this

Table 1. Stellar multiplicity and number of American adults in household.
population. Adding together the values of family and non-family households, the final numbers of 1, 2 ··· 5+ adults in the age interval of 18 - 65 years old in 1000 units in all population are 36,961, 47,216, 9762, 3114 and 845. These data correspond to 37.8%, 48.2%, 10.0%, 3.2% and 0.8% of 1, 2 ··· 5+ adults in household. The American adult data are shown in the last entry in Table 1. The mean value is about 1.81 adults per household, which is close to the average stellar multiplicity –2.04.
In Figure 1 we plot the two distributions as well as a third dataset which is discussed below. The resemblance between them is outstanding. Indeed, we estimated from extensive Monte Carlo simulations that the distributions of stars multiples and American adults in household are consistent with each other with a probability level higher than 98% (Appendix). Note that previous works [4,5,7] ignored the contribution of non-family households to the adults population. In this case the match between the two curves was less prominent, and the significance level was slightly lower, but the mean number of adults in household was closer to the average stellar multiplicity value.
4. The Distribution of Persons in Household in Several Countries
Following the referee’s request, data on other countries were studied. We searched for information on the distribution of adults in the national statistical bureaus of the ten most populated countries [8]. Relevant data were only found in USA, in which the details of the statistics were the most comprehensive. In the other cases either no data were found or some partial data with no age information were available. An email was sent to the statistical bureau of each country requesting for the required data, but either no response was received or the reply was not helpful. The sample was thus increased to include a few more cases. English speaking countries were chosen to avoid language problems. An exception is Israel, the native country of the author. Table 2 summarizes the data search.
USA was the only country in the sample in which data on the number of persons in household were given with respect to age groups. Thus, it was decided to collect data

Figure 1. A comparison between the distributions of star multiples (blue circles), American adults in households in 2009 (red triangulars), and adults (concluded by a dilution) in the sum of six countries (green squares). There is a remarkable similarity between the stellar curve and the human distributions. Numerical simulations suggest that these results are highly significant.
on the total number of persons in household bearing in mind that this is not the optimal parameter for the comparison. Relevant data were collected for five more countries—Japan, UK, South Africa, Canada and Israel.
Table 3 comprises the data in the countries in which they were accessible. It lists the number of 1, 2 ··· 7+ persons in household as well as fraction from the total population and the total and mean number of persons in household. For UK and Canada the figures are only given up to 6+ persons in household. Note that the average values may be slightly larger than the mathematical calculation due to possible higher multiplicities. The sum of all six countries is also shown as well as the mean distributions of these countries, which actually assigns an equal weight to every single country. Finally, an artificial dilution of the sum and mean distributions to adults is calculated (see below).
It is noted that there was an attempt to collect data around the year 2009—the time of the astronomical data. The reason for this is elaborated in the discussion. There
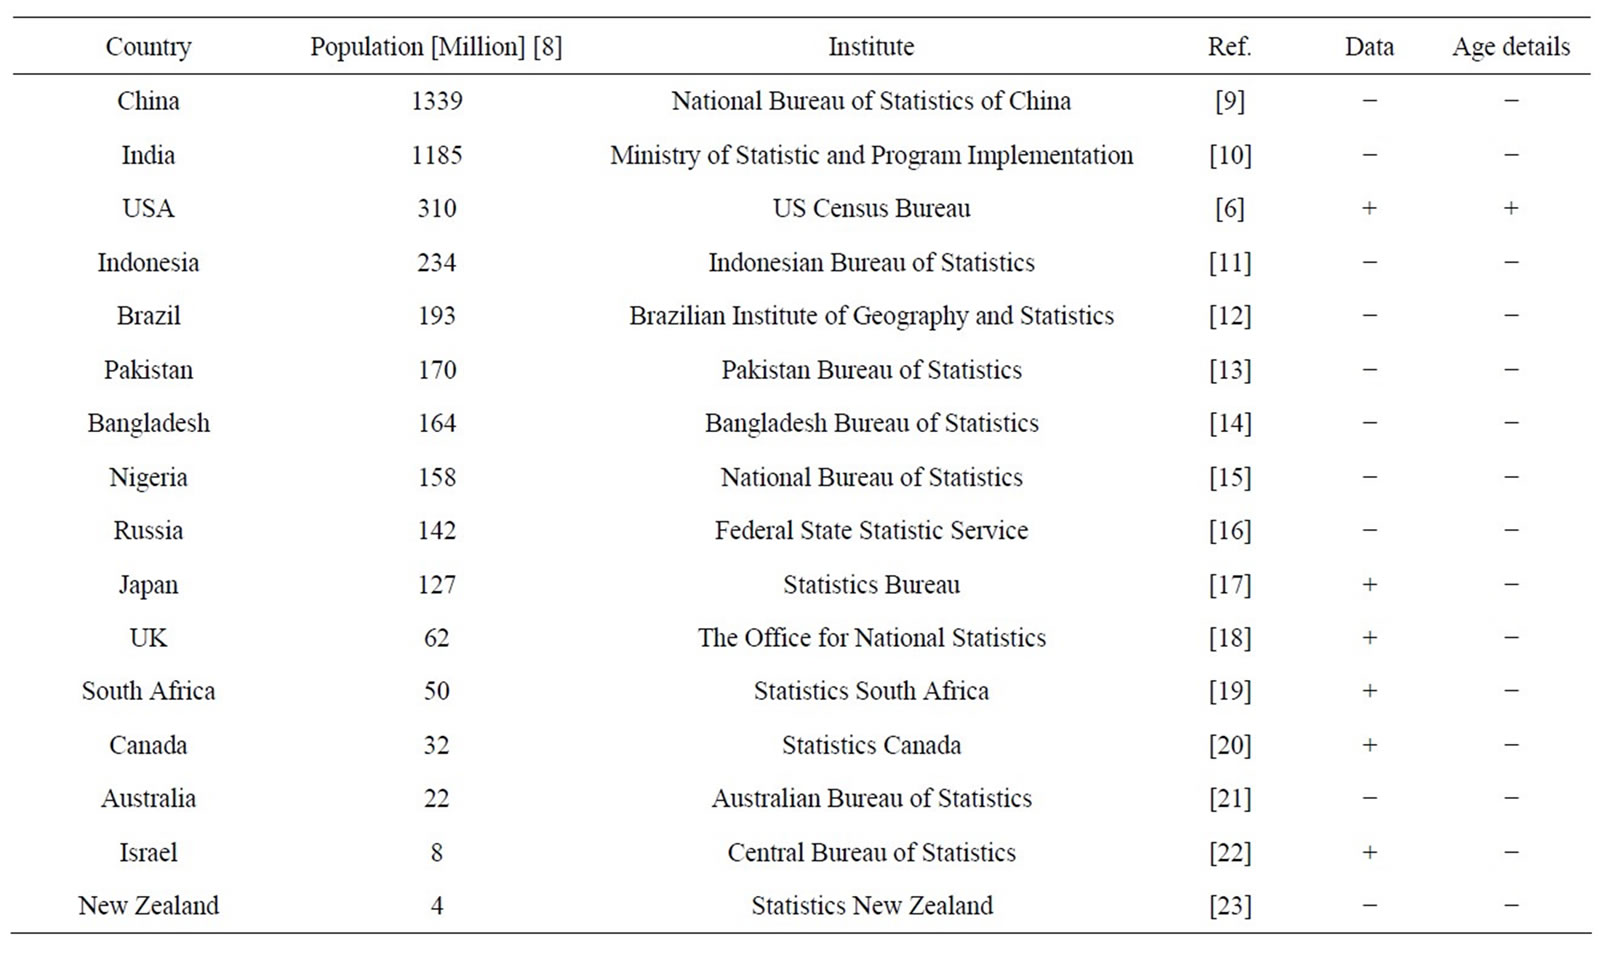
Table 2. Results of data search in ten most populated countries + six more.

Table 3. Number of persons in household in countries in which useful data were available and fraction relative to the total population. The last four entries present the sum and mean of the six countries, and their distributions after a synthetic dilution of the population to ages 18 - 65 years. See text for details.
are, however, minor differences between relative values (in percentages) from various years, and data are available only during the last few years or decades at max. We also comment that for all countries in the sample the total number of persons in household in Table 3 is lower than the overall population values in Table 2. The most likely reason is that the censuses are partial.
Figure 2 displays the distributions of number of all persons in household in the countries in which data were available. There is obviously some variety between different countries. The distributions of USA, UK, Canada and Israel are quite similar with a peak at 2. The curves of Japan and South Africa are not far from it with the highest peak at 1 person per household. The dotted-dashed line in red displays the distribution of the sum of the six countries, which also peaks at 2.