1. Introduction
The Ras proteins, H-, Nand K-Ras, are low molecular weight GTPases that play important roles in signal transduction of cell proliferation and/or differentiation [1]. In the active state, Ras binds guanosine triphosphate (GTP), and inactivation occurs by conversion of GTP to guanosine diphosphate (GDP). The rate of this reaction is crucial for the corresponding timing of the signal transduction, and requires the Ras protein to hydrolyze GTP to GDP in order to complete the normal activation of downstream effector proteins. The intrinsic low GTPase activity of Ras can be dramatically increased by binding to the GTPase activating protein (GAP). However, many oncogenic mutants of Ras escape regulation by GAP, which leads to Ras are always in its active state. The longer Ras remains in the active GTP-bound state, the longer it will transmit and also amplify certain signals, eventually leading to uncontrolled multiplication of cancer cells [2-4].
The vast majority of Ras mutations found in human disease occur in K-Ras, with mutations in H-Ras and N-Ras being quite rare [5,6]. Interestingly, the primary structures of these three Ras proteins are almost identical; in particular the amino acid sequences of H-Ras and K-Ras are identical until residue 95, and with only two differences up to residue 120 (see supporting Figure S1). Several mammalian Ras specific GAPs of various sizes and molecular architectures have been described to date. They all have high sequence similarity in their catalytic GAP domains, which are segments of 250 - 350 amino acid residues. The most prominent and best studied GAPs are p120GAP and neurofibromin [7]. The catalytic domains of neurofibromin (residues 1198-1530, NF1-333) and p120GAP (residues 714-1047, GAP-334), interact with all three Ras isoforms without preference.
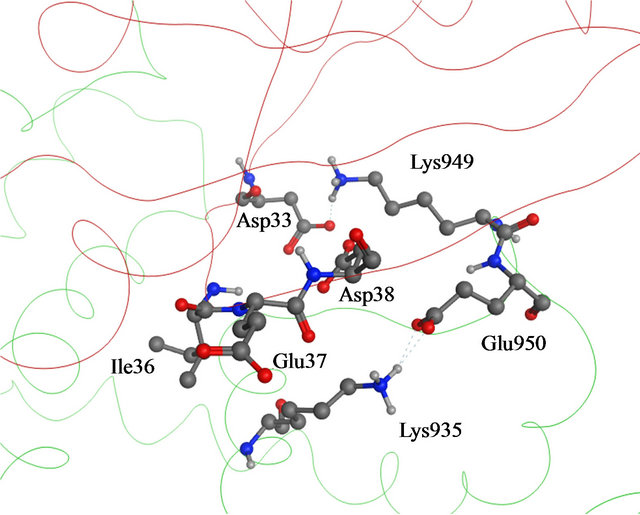
A likely catalytic mechanism for hydrolysis of Rasbound GTP by GAP has been illustrated through the Xray structure of an H-Ras-GAP complex in which H-Ras was bound to GDP and AlF3, where AlF3 resembles the cleaved γ-phosphate group of GTP [8]. GAP-334 contains eight helices (denoted α1c - α8c) separated by six loops (denoted L1c - L6c). Of these, the elements that contact with Ras are α6c, α7c, L1c, and L6c. L1c is called “finger loop” because it contains residues that enter into the GTP binding site of Ras; in particular Arg789, which interacts with Gly12, Gln61, and the fluoride atoms of AlF3. This residue has therefore been postulated to neutralize the developing negative charge on the GTP phosphate oxygen atoms during phosphoryl cleavage [9- 11]. GAP furthermore interacts with Ras Switch I and Switch II regions (containing amino acids 30 - 40, and 60 - 70, respectively), and stabilizes these two regions during the hydrolytic process (Figure 1). Different from previously identified mutation hot spot codons 12, 13 and 61 in tumors [12], some point mutations in the K-Ras Switch I region, including E31N, D33N and D38N, have recently been detected in cervical cancer and adrenal tumors [13-16]. In addition, Lys1423 in NF1-333 mutated to Glu or Gln in neurofibromas and solid tumors, have claimed to completely impair the GTPase stimulating activity of NF1-333 [17]. The corresponding residue in GAP-334, Lys935, is involved neither in binding nor catalysis; instead the side chain of Lys935 is located near Ile36, Glu37 and Asp38 of Switch I (Figure 2). Hence, either Ras mutated in the Switch I region, or transformed GAP with a mutated Lys residue spatially close to the Switch I region, seem crucial in oncogenicity. Judging from the positions of these point mutations, they cannot be directly involved in the catalytic reaction in the same way as the hot spot codons (12, 13, 61) which are in direct contact with the phosphoryl group of GTP. To explore how these mutants hinder the GTPase function of GAP, we have used molecular dynamics (MD) simulations to compute the effects of each mutant on the interaction between GAP-334 and K-Ras. Our investigations reveal a critical residue Tyr32 in the Ras Switch I region, which acts as a gate to access GTP and appears to be “open” when Ras couples with GAP for insertion of Arg789. The different mutations studied herein seemingly cause an incomplete “open” state of Tyr32 and lead to failed insertion of Arg789 critical for GTP hydrolysis.
2. Materials and Methods
2.1. Materials and Programmes
The X-ray crystal structure of H-Ras bound to GAP-334 (PDB entry: 1WQ1) [8], K-Ras with bound GTP analogue GppNHp (3GFT), and the GAP related domain of neurofibromin (1NF1) [18] were chosen as the initial structures.
All in silico mutations, structure superpositions and protonation state determinations of the residues were performed using the Molecular Operating Environment (MOE) 2009.10 program [19]. For MD simulations and energy minimization, the GROMACS software [20] (Version 4.0.4) together with the Amber 99 force field [21] was used.
2.2. Preparation of the Systems
MD simulations were performed on in silico mutated proteins in coupled and uncoupled forms to see how the
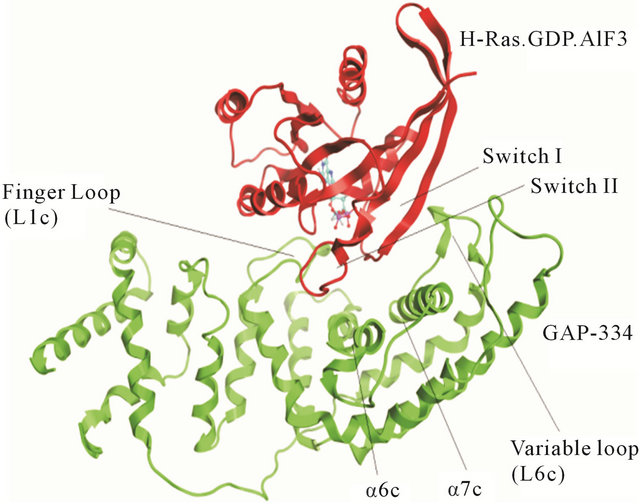
Figure 1. The complex between GAP-334 and H-Ras. The GAP-334 ribbon is colored green, H-Ras colored red. The contacting region of each protein is indicated.
 (a)
(a)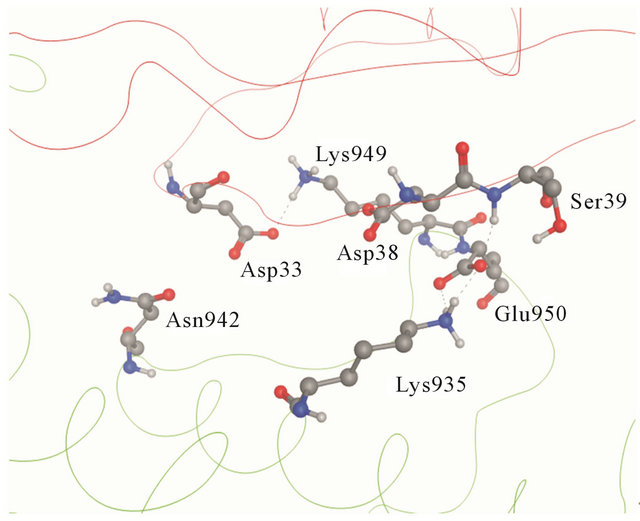 (b)
(b)
Figure 2. (a) Details of the interaction of H-Ras with GAP- 334. Switch I residues Asp33, Glu37 and Asp38 (backbone ribbon colored red) and GAP-334 residues Lys935, Lys949 and Glu950 (backbone ribbon green); (b) The Switch I region is fixated by Asn942, Lys949 and Glu950 of GAP-334. Asn942 forms a hydrogen bond with Asp33, Lys949 makes direct contact with Asp33 and water mediated polar contact with Asp38, and the carboxylate group of Glu950 interacts with the main chain amide group of Ser39.
mutated residues affect the protein conformations in the different forms.
2.2.1. Uncoupled Proteins
Using the crystal structure of human K-Ras in complex with the GTP analogue GppNHp (3GFT), we transformed GppNHp to GTP by substituting the N to a P atom, with the bond lengths and the charge of the atom updated synchronously. Based on this Mg2+.K-Ras.GTP structure, MD simulations were carried out (parameters described below), followed by energy minimization of the structure from the last snapshot of the MD trajectories. In order to investigate if the K-Ras Switch I mutants have an effect on the protein conformation, in silico mutations E31N, D33N and D38N of the optimised K-Ras structure were performed, followed by MD simulations. For GAP, MD simulations were performed on both wildtype and mutant (K1423E) NF1-333 (crystal structure 1NF1).
2.2.2. Coupled Proteins
The initial X-ray structure 1WQ1 contains the substrate GDP-AlF3 bound to H-Ras, where the AlF3 molecule is thought to “mimic” the γ-phosphate moiety of GTP. In place of the AlF3 molecule, we thus generated the γ- phosphate group bound to GDP in the active site of HRas. 10 different amino acids differ between H-Ras and K-Ras up to codon 95; we thus in silico mutated these ten amino acids, Q95H, D107E, A121P, A122S, E126D, S127T, R128K, Y141F, E153D and Q165K, to transform H-Ras to K-Ras (see supporting Figure S1). We then performed MD simulation (parameters described below), followed by energy minimization on the new complex of Mg2+.K-Ras.GTP.GAP-334 from the last snapshot of the MD trajectories. Based on the energy optimized Mg2+. K-Ras.GTP.GAP-334 complex structure, another four separate in silico mutations were performed followed by MD simulations as outlined above. The single mutant complexes include E31N, D33N and D38N of K-Ras, and K935N of GAP-334, respectively, with the aim to explore the effects of these frequent mutants on complex stabilities and interactions.
2.3. Molecular Dynamics Simulations
The GROMACS software and Amber 99 force field were used for all the MD simulations. The parameters for GTP were obtained from Meagher et al. [22] (atomic charges given in Supporting Information). The structures were solvated in periodic boxes with a buffer distance of 10.0 Å. A number of Na+ and Cl− ions were added to satisfy the electro neutrality condition and to give a salt concentration of 0.1 mol/liter, using the genion module in GROMACS. The obtained systems (~54,500 atoms in the complex system, ~19,000 atoms in uncoupled K-Rasand ~50,600 in uncoupled NF1-333 GAP) were energy minimized by steepest descent (200 steps) to remove close contacts. Position restrained simulations (2 ns duration, 1.0 fs time step, NPT ensemble, T = 298 K, P = 1 bar) were first performed, to enable the water molecules to attain more favorable positions. Particle-mesh Ewald (PME) [23,24] summation was used for long-range electrostatics. A 12 Å cutoff was used for both Coulomb and Lennard-Jones interactions. The temperature and pressure was controlled through the Berendsen coupling algorithm [25], with the time constants 0.1 ps for temperature and 1.0 ps for pressure coupling. All bond lengths were constrained using the LINCS algorithm [26]. During the production MD simulations (30 ns duration, 1.0 fs time step, NPT ensemble, T = 298 K, P = 1 bar), the temperature was controlled using the Nose-Hoover thermostat [27] with a time constant 0.1 ps, and the pressure was controlled using the Parrinello-Rahman barostat [28], with a time constant 1.0 ps. The remaining parameters were the same as in the position restrained simulations.
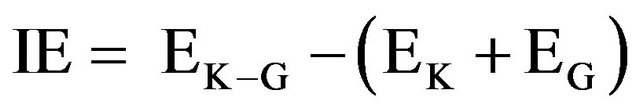
2.4. Interaction Energy Calculations
The interaction energy (IE) is defined as the potential energy difference between the K-Ras.GTP.GAP complex (K-G) and the individual K-Ras. GTP (K) and GAP (G) systems, Equation (1).
 (1)
(1)
In order to eliminate effects of the kinetic energy, geometry optimizations were performed with the Amber 99 force field, on the 10 snapshots from the last 1 ns MD trajectories of each system (including solvent molecules and Na+, Cl− ions). The interaction energy calculations were then performed on the optimized geometries of the various K-Ras.GTP.GAP complexes with all water molecules and ions removed.
3. Results and Discussion
3.1. Overall Dynamic Behaviour of Unbound Wildtype and Mutated K-Ras and NF1-333 GAP
Simulations of the unbound wildtype and mutated K-Ras and NF1-333 GAP were performed to investigate if the mutations cawuse any severe structural differences before the two proteins bind together.
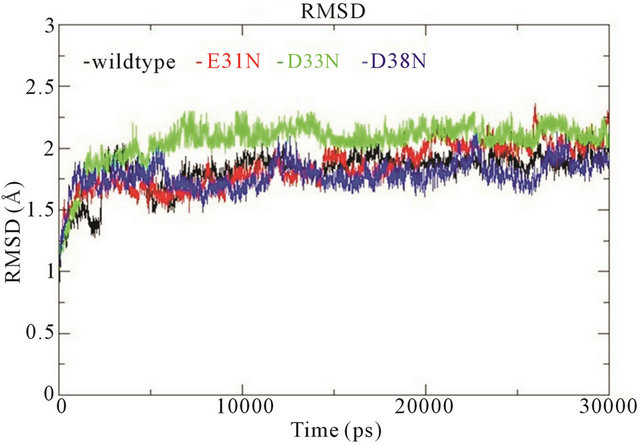
In the wildtype K-Ras protein, the side chains of residues E31, D33 and D38 are not interacting with any other surrounding residues; instead they all stretch out away from the GTP binding site (supplementary Figure S1(b)). After MD simulations, the mutated residues E31N, D33N and D38N keep the same position as in the wildtype. The RMSDs of the backbone structures were calculated for all simulations. The RMSD values stay fairly constant around 2 Å, and the mutants do not differentiate much from wildtype (Figure 3(a)). The backbone root-mean-square fluctuations (RMSFs) were also calculated since they can give an indication of backbone mobility. The backbone RMSFs fluctuate in a very similar manner for both wildtype and mutant proteins. For the Switch I region (residues 30 - 40), the RMSF values are very small, indicating that the region is stable (Figure 3(b)). Moreover, the average GTP to protein H-bond number from the last 1 ns of simulation in wildtype and mutants are the same (Table 1). We can thus conclude that these Switch I mutants in K-Ras do not influence the protein conformation itself, and do not interfere in GTP binding.
In wildtype NF1-333 GAP, K1423 is located on helix α7c from which it protrudes into the surface groove to form a salt bridge with E1437. In the mutated K1423E structure, this salt bridge is broken. The E1423 carboxylic side chain keeps the same position as wildtype K1423, but the electrostatic charge repels E1437 and the surface groove becomes slightly less defined albeit retaining the same orientation (see supporting Figure S2). The fluctuations of backbone RMSD show that the conformation of mutant K1423E is more unstable compared to the wildtype NF1-333 GAP. For the wildtype system, it reaches to stabilization after 10 ns and retains a RMSD value of 4.5 Å; for the mutant, it fluctuates in the beginning, and stabilizes first after 15 ns, whereafter it retains a relatively higher RMSD value of 5 Å (Figure 3(c)).
In conclusion, mutations in the single protein K-Ras or NF1-333 GAP do not induce severe structural changes. The two proteins should in principle still be able to couple to each other despite these point mutations.
3.2. Effects of Mutations E31N, D33N and D38N of K-Ras, and K935E of GAP, on Ras-GAP Interaction
Since the GTPase activity of Ras proteins is stimulated by GAP, it has been proposed that certain mutations either in Ras or GAP would cause a deficiency in GTPase activity resulting in uncontrollable cell proliferation. The
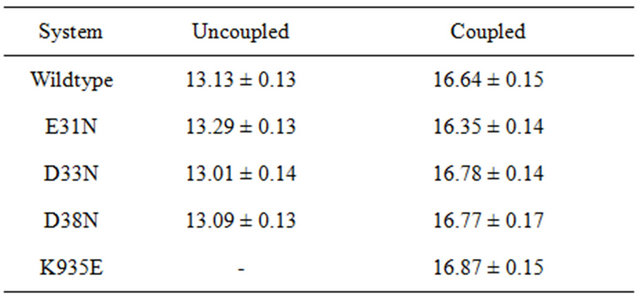
Table 1. Number of hydrogen bonds for K-Ras and GTP in different systems, including errors.
 (a)
(a)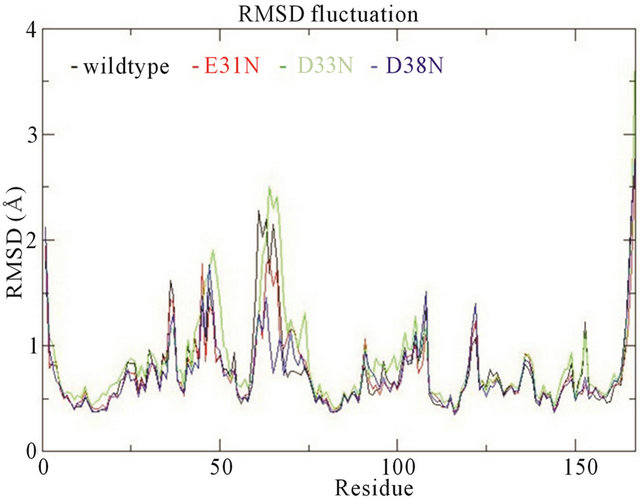 (b)
(b)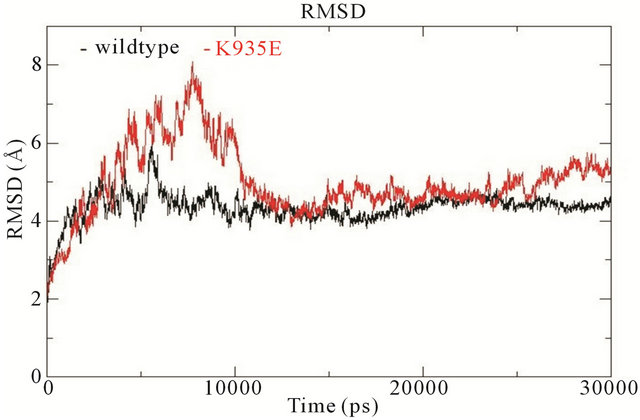 (c)
(c)
Figure 3. (a) Trajectories of the overall backbone RMSDs (in Å) of uncoupled K-Ras of the wildtype and mutant structures; (b) Backbone RMSF (in Å) of uncoupled K-Ras of the wildtype and mutant structures; (c) Trajectories of the overall backbone RMSDs (in Å) of uncoupled NF1-333 GAP of the wildtype and mutant structures. All data with respect to the corresponding starting structures over 30 ns MD simulation.
mutation hot spots located on codons 12, 13 and 61 of Ras are well established and have been widely studied. However, the mechanisms behind why codons 31, 33 and 38 of Ras, and codon 935 on GAP-334 (1423 on NF-333) also result in tumorigenesis are still largely unknown. To this end we performed 30 ns MD simulations of the different mutanted complex systems to predict the effects of mutations on protein structure and protein-protein interactions.
3.2.1. Root-Mean-Square Deviations (RMSD)
The RMSD trajectories of the backbone structures of mutant K-Ras or GAP-334 in the complexes display a different behaviour to the wildtype system (Figure 4). In the wildtype complex, both K-Ras and GAP-334 stabilize after ~3 ns; K-Ras RMSD varies between 1.0 - 1.25 Å after stabilization, whereas that of GAP-334 varies between 1.75 and 2.25 Å. In the E31N system, K-Ras stabilizes rapidly and attains an RMSD value from 0.8 to 1.2 Å, whereas GAP-334 gradually drifts and stabilize first at around ~20 ns, from where it fluctuates between 2 to 3 Å. In the D33N system, K-Ras again evolves rapidly and stabilize at ~1 ns from which it attains values of 0.8 ~ 1 Å, whereas GAP-334 does not stabilize until after ~12 ns, and then attains values between 1.8 - 2 Å. For D38N, both K-Ras and GAP-334 reaches stabilization after ~8 ns, with K-Ras attaining values of 0.8 - 1 Å and GAP-334 1.25 - 1.75 Å. In K935E finally, K-Ras evolves rapidly to 1.5 Å within the first 5 ns, whereafter it drops to values from 0.8 to 1 Å, whereas the mutated GAP-334 gradually drifts to stabilize at around ~20 ns and then fluctuates between 2 - 2.5 Å (Figure 4).
It can be concluded that the RMSD trajectories of KRas do not differ significantly in any of the systems.
3.2.2. Interaction Changes Caused by the Mutations
The RMSD trajectories of GAP-334 in the wildtype, D33N, and D38N systems are also quite similar, whereas in E31N and K935E, the RMSD trajectories of GAP-334 do not stabilize until after 20 ns, and at higher values, which reflects larger structural deviations occurring in GAP-334 in these two systems.
3.2.3. Interaction Energies
Table 2 lists interaction energies between K-Ras.GTP and GAP of the wildtype and mutant systems. Due to themutations, the overall K-Ras.GTP.GAP interaction for the mutant complex becomes weaker compared to the wildtype system. The K935E mutation causes a significant reduction in interaction energy. The K-Ras mutant systems cause less interaction energy difference; 36 kcal/mol in E31N, 44 kcal/mol in D33N, and 13 kcal/mol