1. Introduction
Microbial activity can reduce the saturated hydraulic conductivity by clogging soil pores with microbial cells and their synthesized products. This is called biological clogging (or bioclogging) of soil pores and is a major problem in in situ bioremediation practices [1]. Bioclogging also causes problems in the production of drinking water. Most wells in the river regions of the Netherlands are clogged, which has severely reduced the water production [2]. Bioclogging process can occur through many factors, including accumulation of bacterial cells, production of bacterial extracellular polymers, and entrapment of gaseous end products by microorganisms. The difficulty associated with the measurement of saturated hydraulic conductivity (Ks) to understand field clogging for unknown depth of saturation, non-uniform soil properties, and ill-defined flow geometry [3], has led many researchers to conduct controlled flow-cell experiments in the laboratory [4-7]. The researchers attempted to model using the data from controlled laboratory experiments, to estimate the extent of hydraulic conductivity reduction with respect to biomass growth [8-13].
The objective of this study was to observe bioclogging in a laboratory column experiment.
2. Materials and Methods
Flow-cell experiments were conducted under a constant temperature of 20˚C. Toyoura sand of 0.2-mm mean diameter was packed in an acrylic plastic flow system of 5- cm diameter and 10-cm height (Figure 1). The column consisted of five 2-cm rings. The top and bottom ends of the samples were supported by 4-mm-thick glass filters. Three piezometers were inserted equidistantly at different heights of the column, 0, 3, 10, 17, 30, 50, 70, 90, and 100 mm from the surface of the sample. The top and bottom piezometers, i.e., 0 and 100 mm from the surface, were set to contact the glass filters.
Sand was packed uniformly in the column (bulk den-
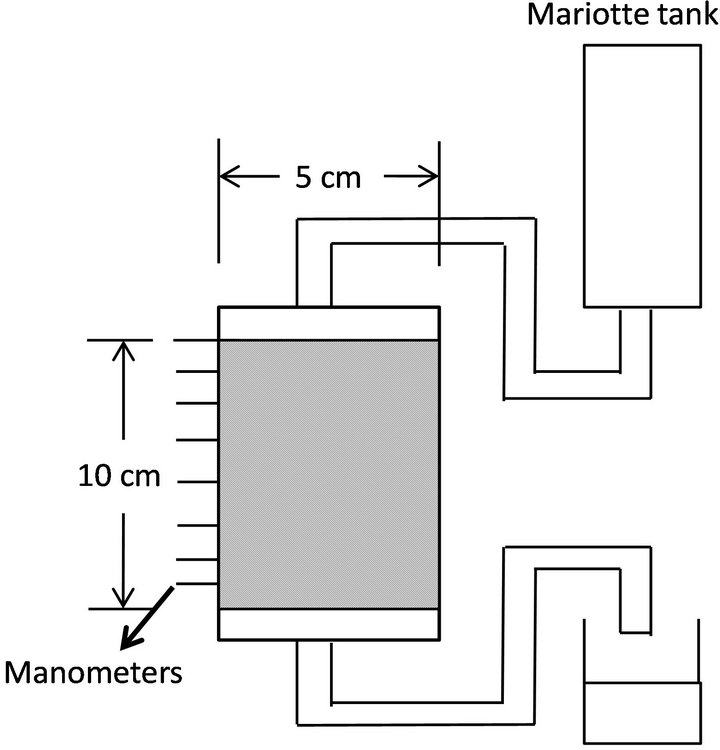
Figure 1. Schematic figure of sand and glass beads column.
sity = 1.64 g/cm3, porosity = 0.376) by hand to allow entry of water to fully saturate the sample. After packing of sand, water was supplied from the top of the column continuously for seven days. Seven runs were conducted. In Runs 1 - 3, sodium azide (NaN3) as germicide was dissolved in water to kill microbes in sand. In Runs 4-7, glucose solution of 50 g/m3 was used as a flow medium to enhance microbial activity in sand.
A Mariotte tank was used to maintain a constant head of water during percolation. The pressure of the piezometers was measured by reading the height of manometers, and the hydraulic head was calculated from the average value of the three manometer readings of each specified height. Saturated hydraulic conductivities, Ks, of each layer were calculated by Darcy’s equation.
After the flow experiment, the column was dismantled and the bulk density was measured by oven-drying the sand sample of 2 cm height to identify the increase of mass resulting from the growth of biomass.
3. Results and Discussion
3.1. Decrease in Saturated Hydraulic Conductivity
The extent of clogging (Ks[final]/Ks[initial]) of the top (0 - 3 cm), middle (3 - 7 cm), and bottom (7 - 10 cm) layers is compared in Table 1. The saturated hydraulic conductivity (Ks) in Runs 1-3, where sodium azide solution was applied, did not decrease remarkably (more than 10% of the initial value) for seven days in any of the sand layers or inside the glass filters. Therefore, the decrease in hydraulic conductivity in Runs 4 to 7 was attributed to the activity of microbes.
Figure 2 shows a typical profile of a hydraulic head at the beginning (0 day) and end (7 days) of the column experiments. After seven days of percolation, the hydraulic head decreased greatly at the top filter (from −0.4